. 2023 Sep 14;186(19):4117-4133.e22.
doi: 10.1016/j.cell.2023.07.027. Epub 2023 Aug 16.

Atlas of the aging mouse brain reveals white matter as vulnerable foci

Affiliations

Atlas of the aging mouse brain reveals white matter as vulnerable foci

Oliver Hahn et al. Cell. .

Abstract

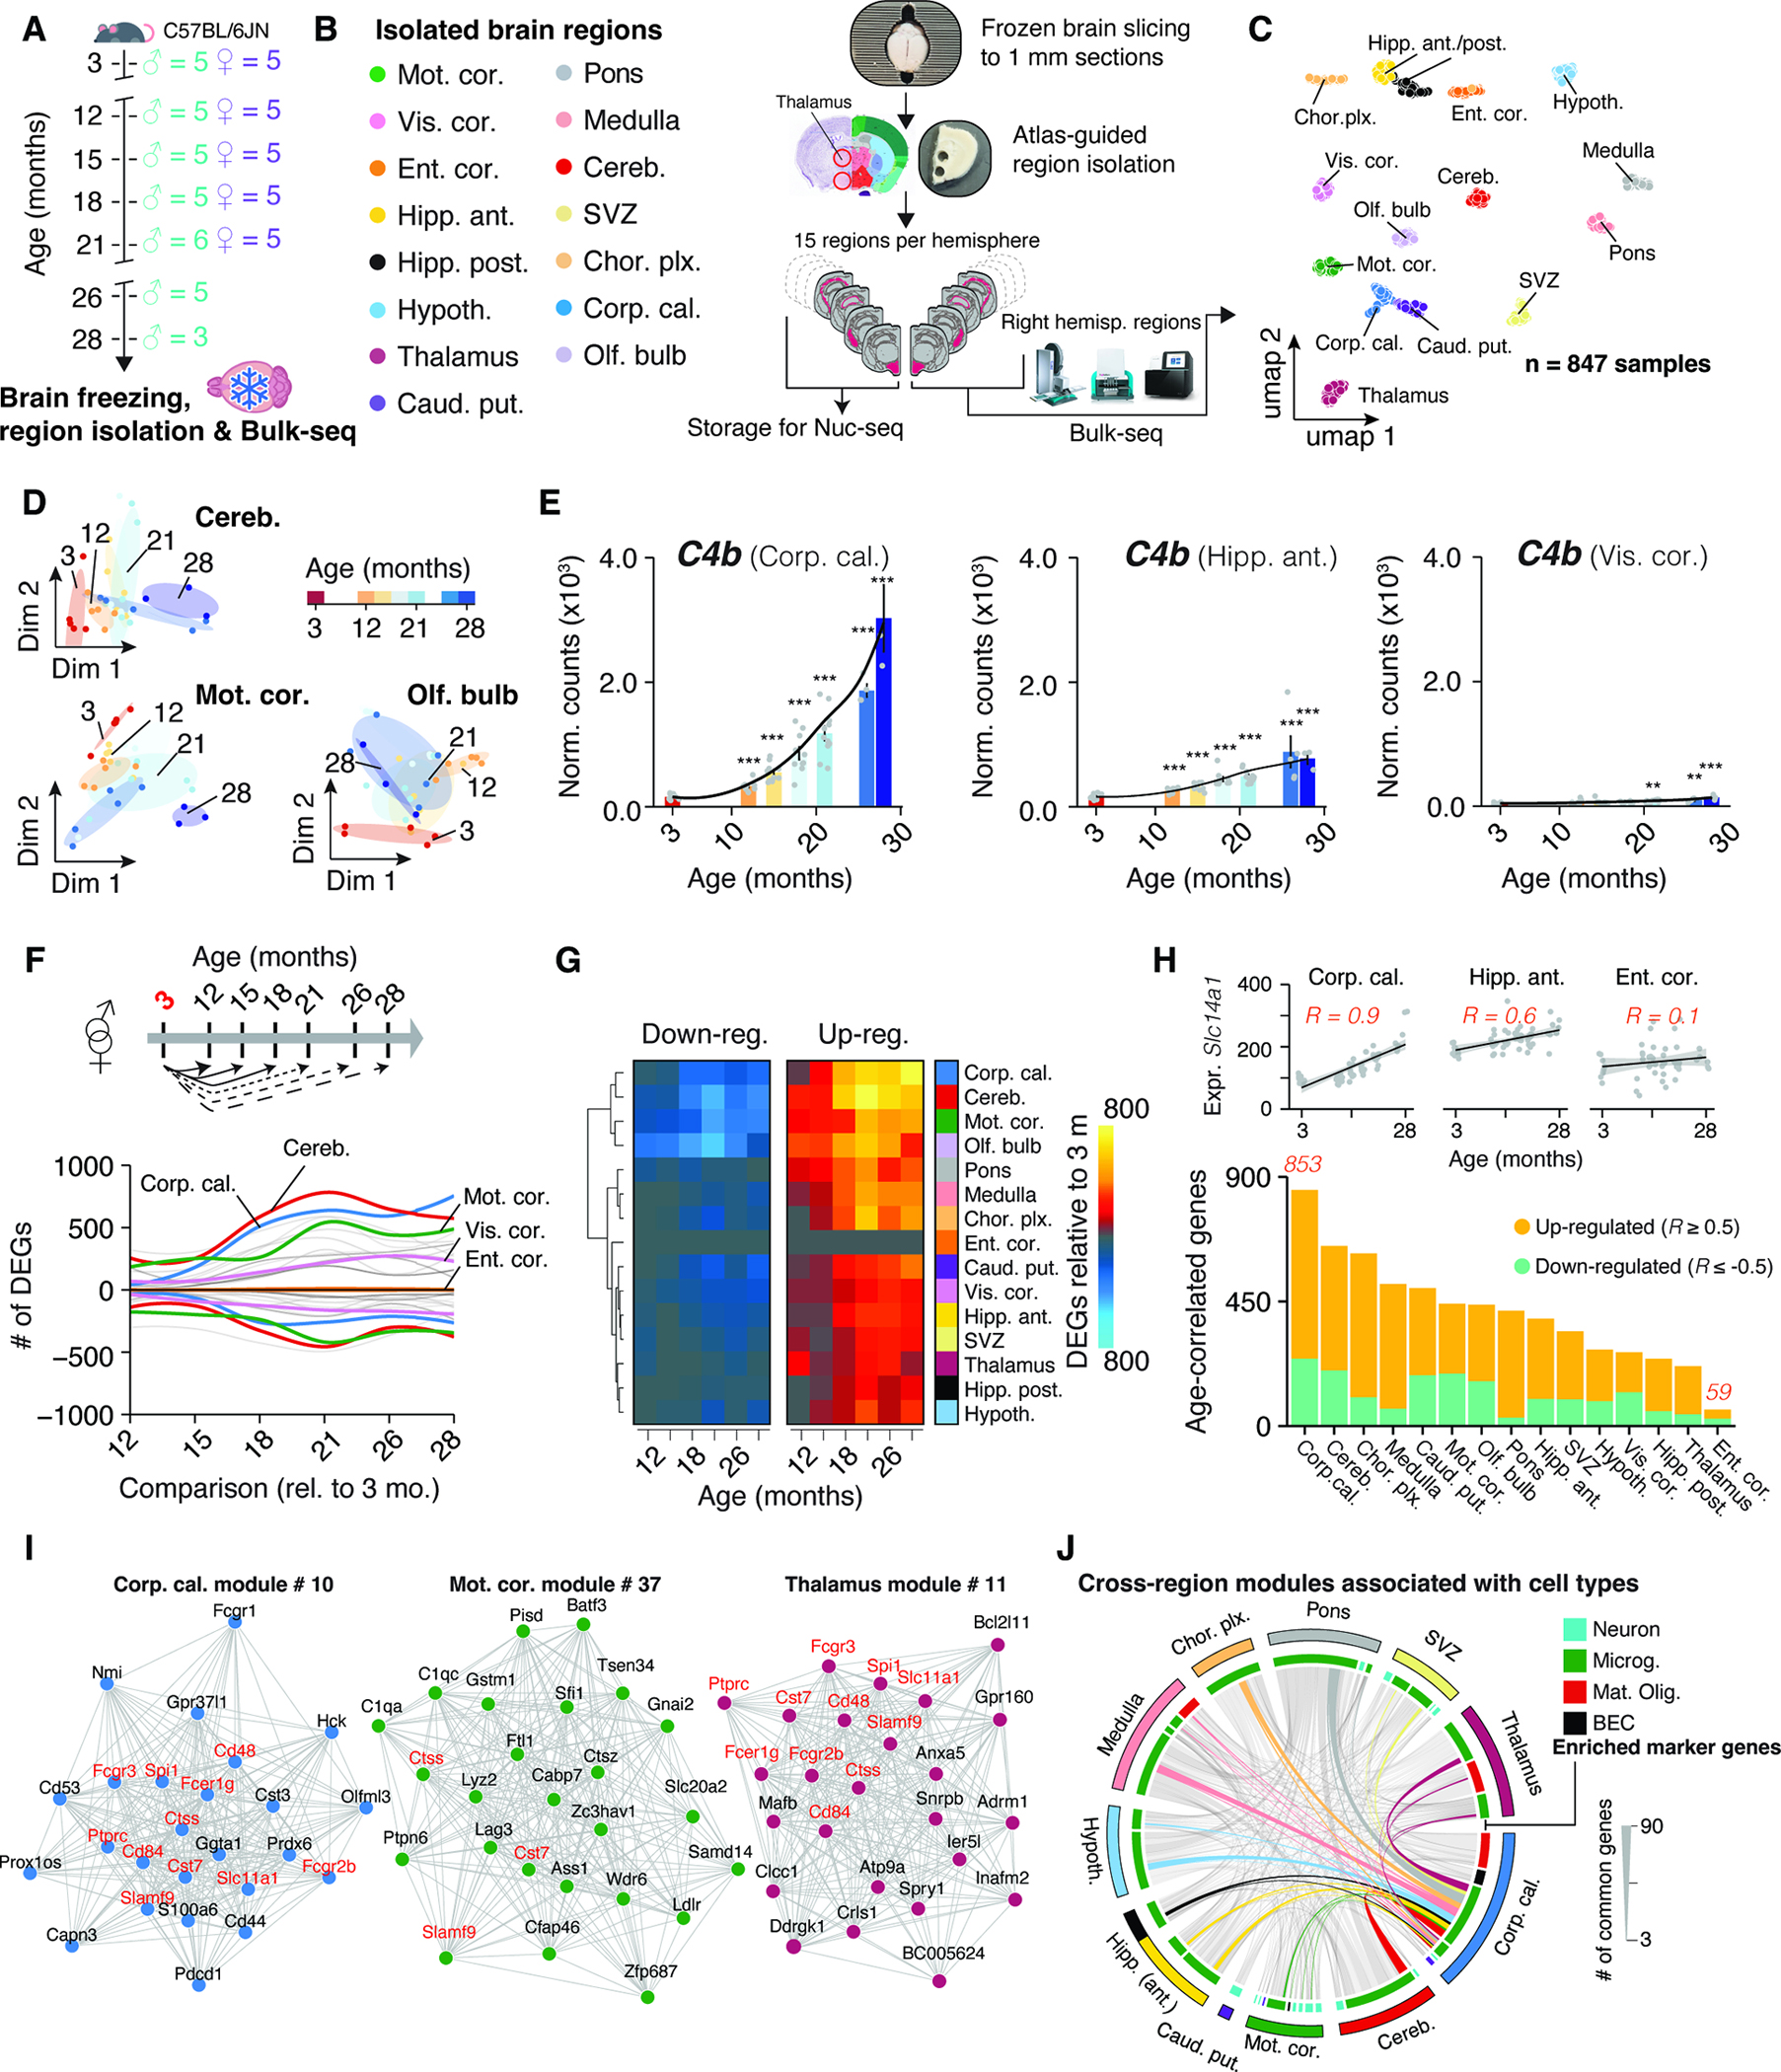
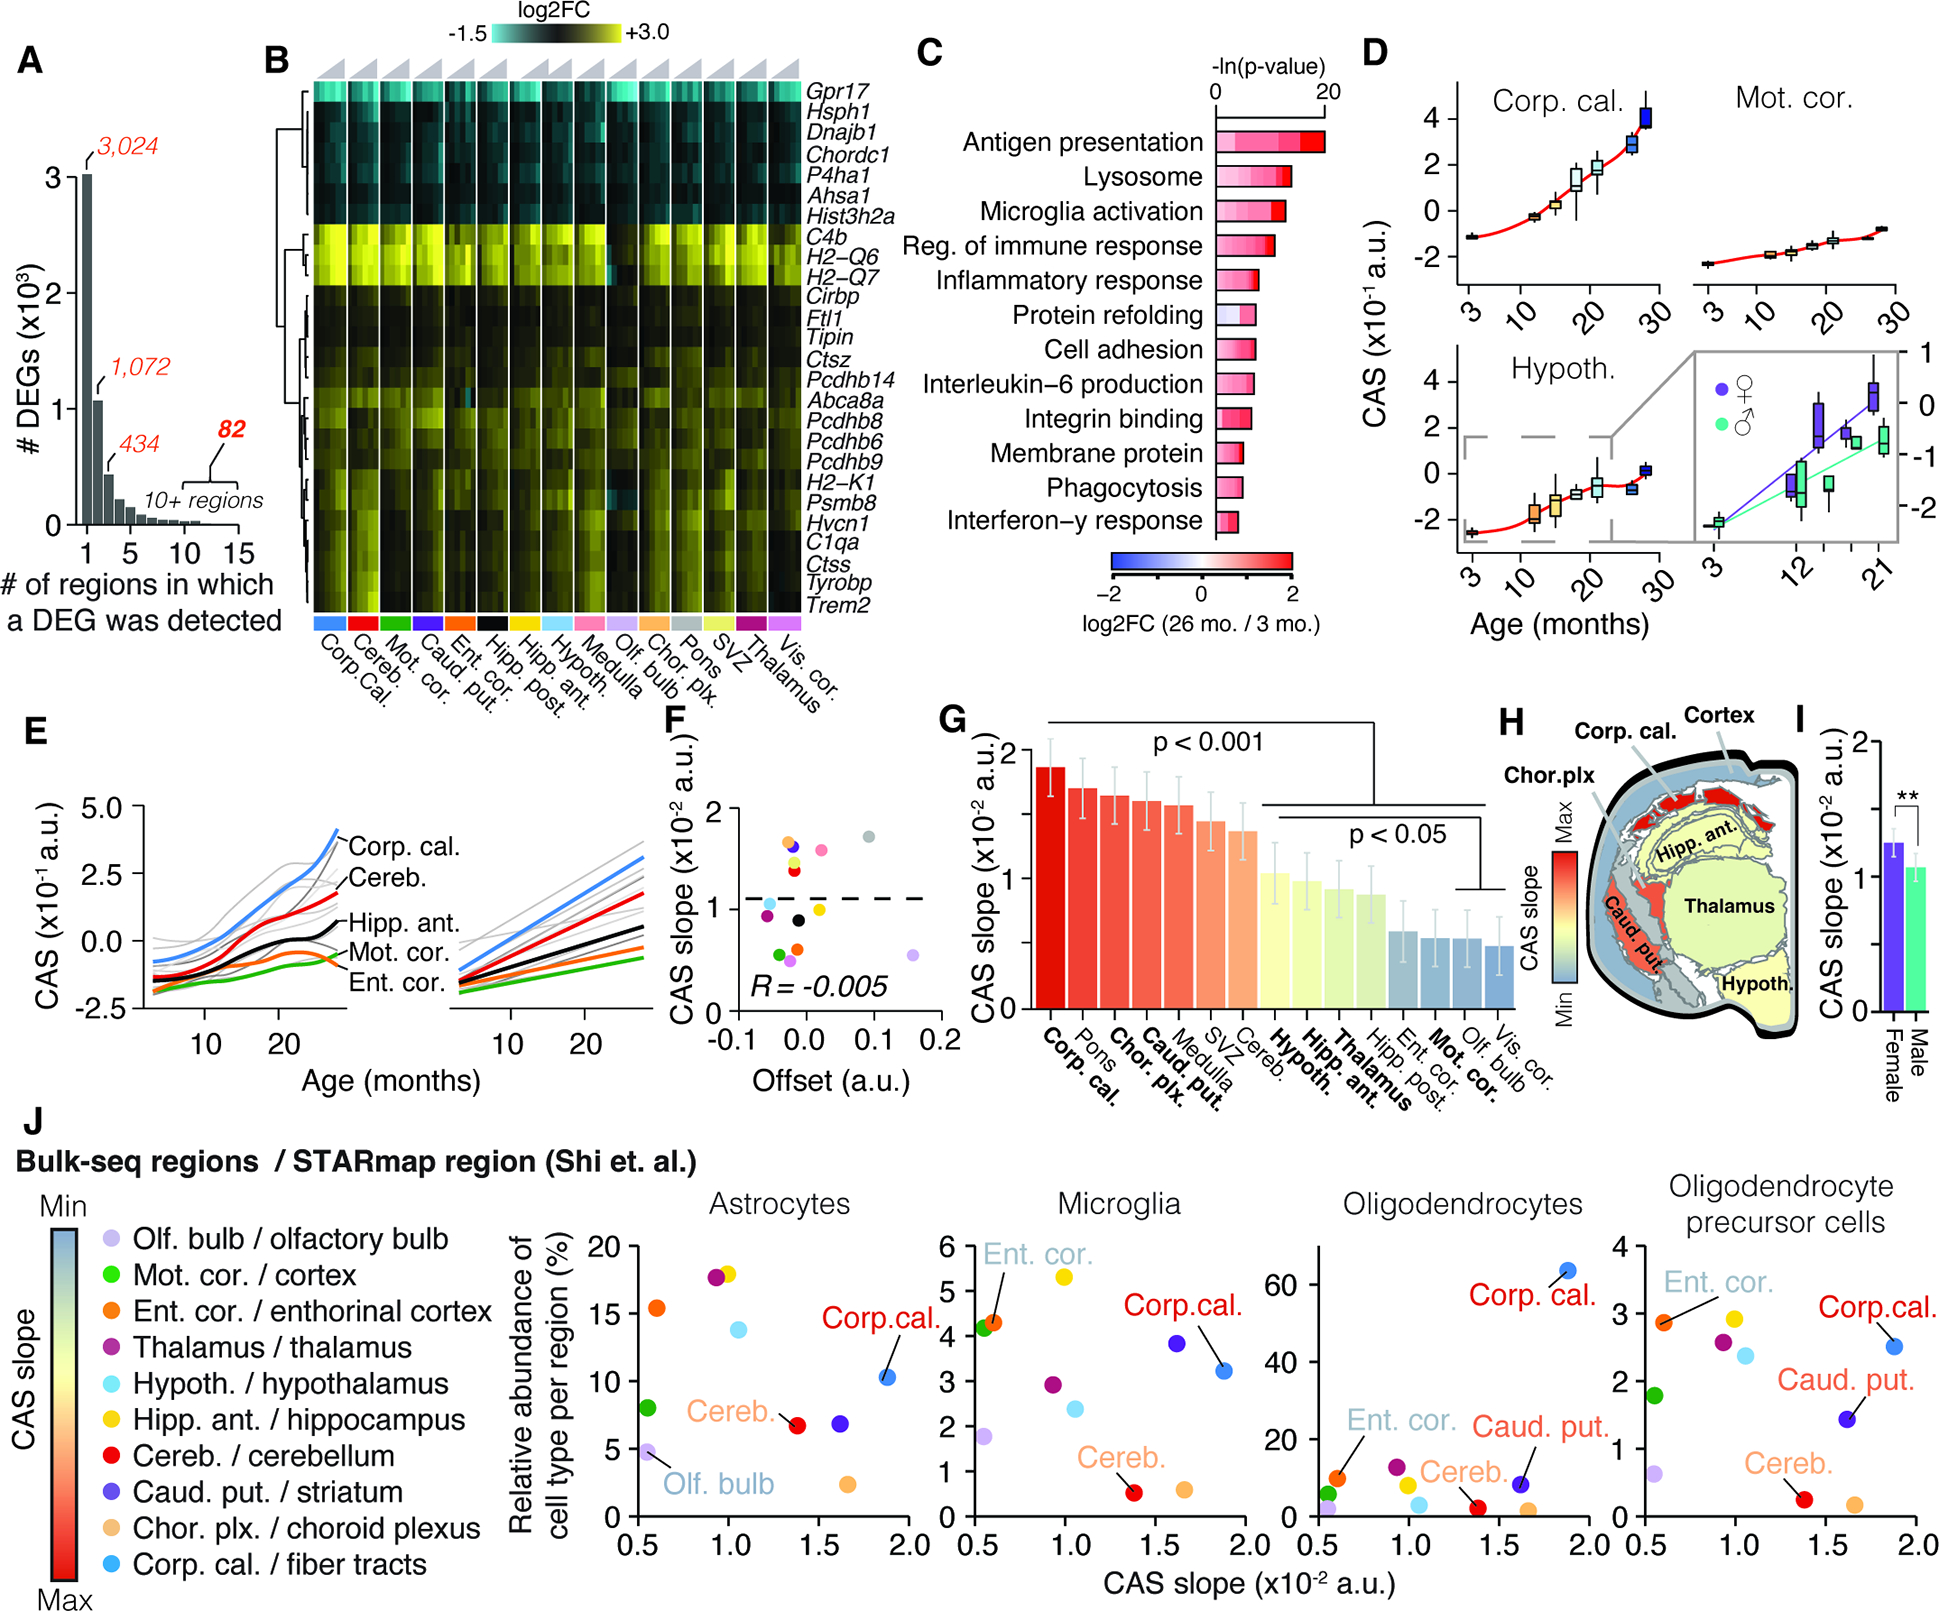
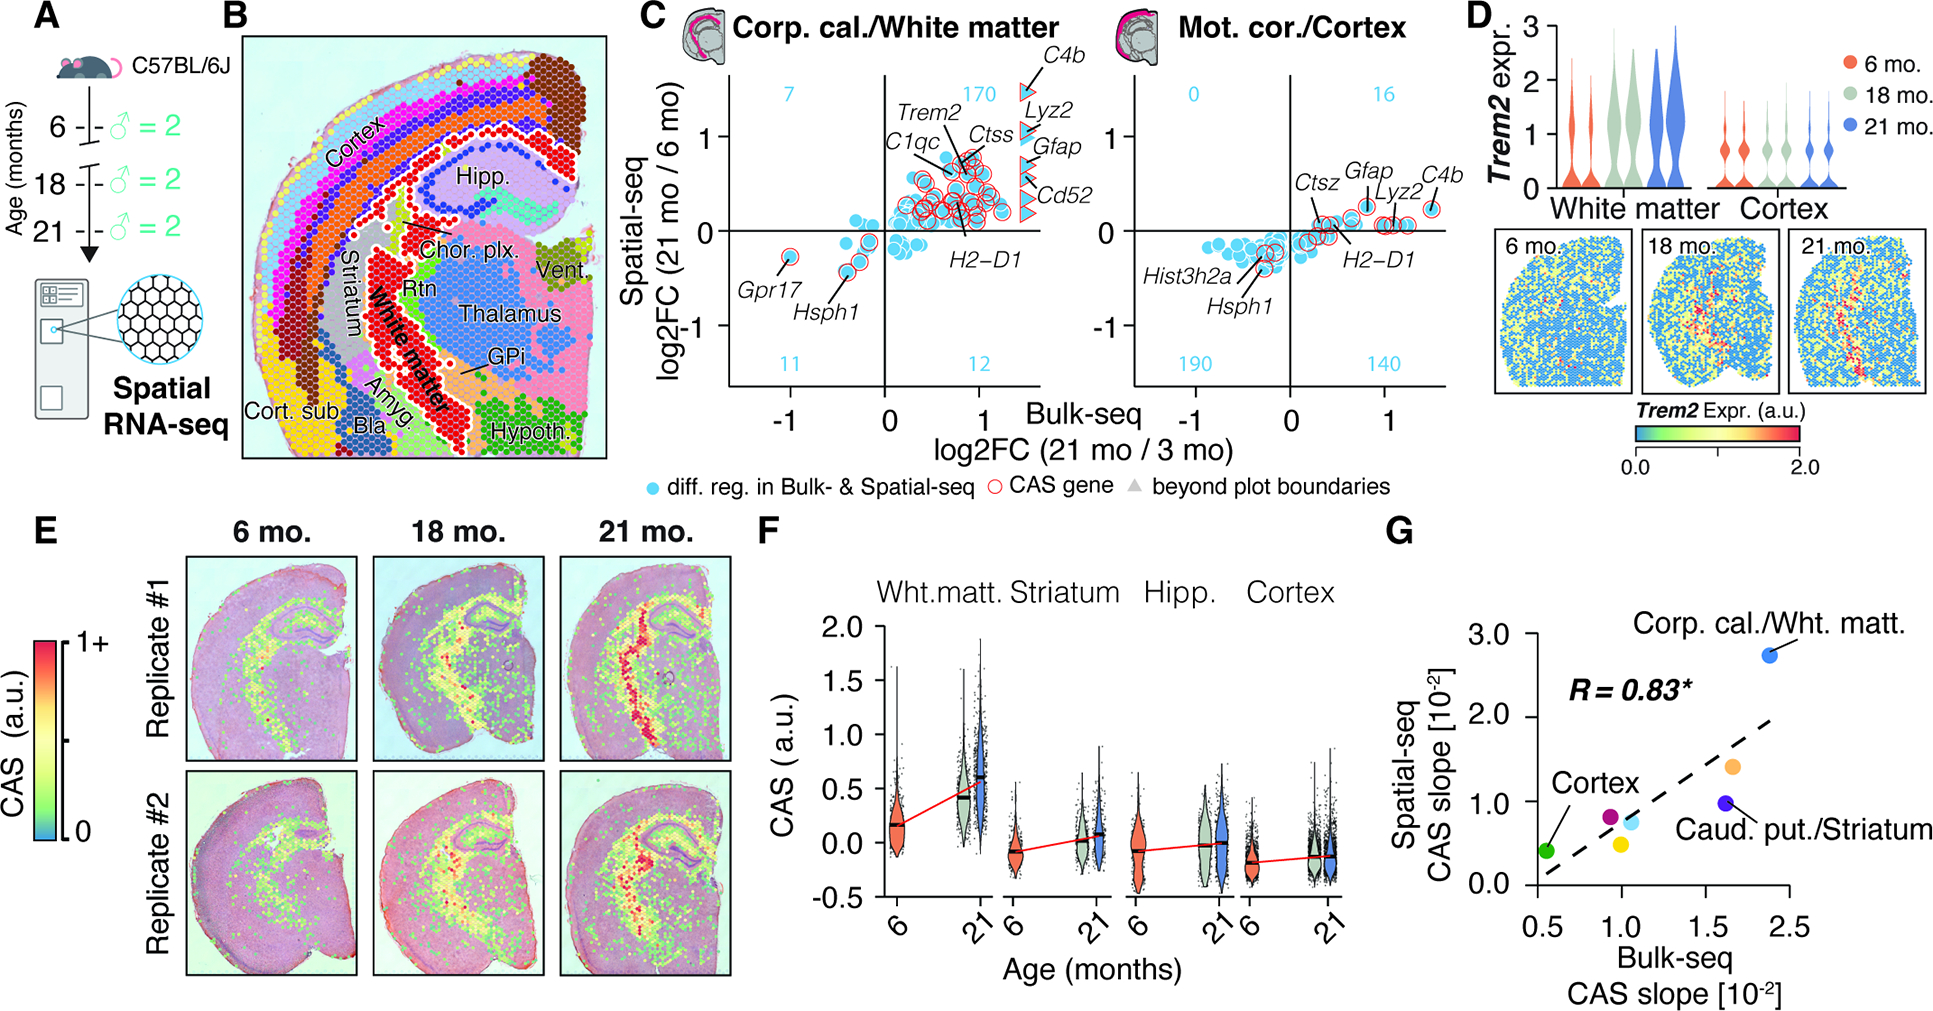
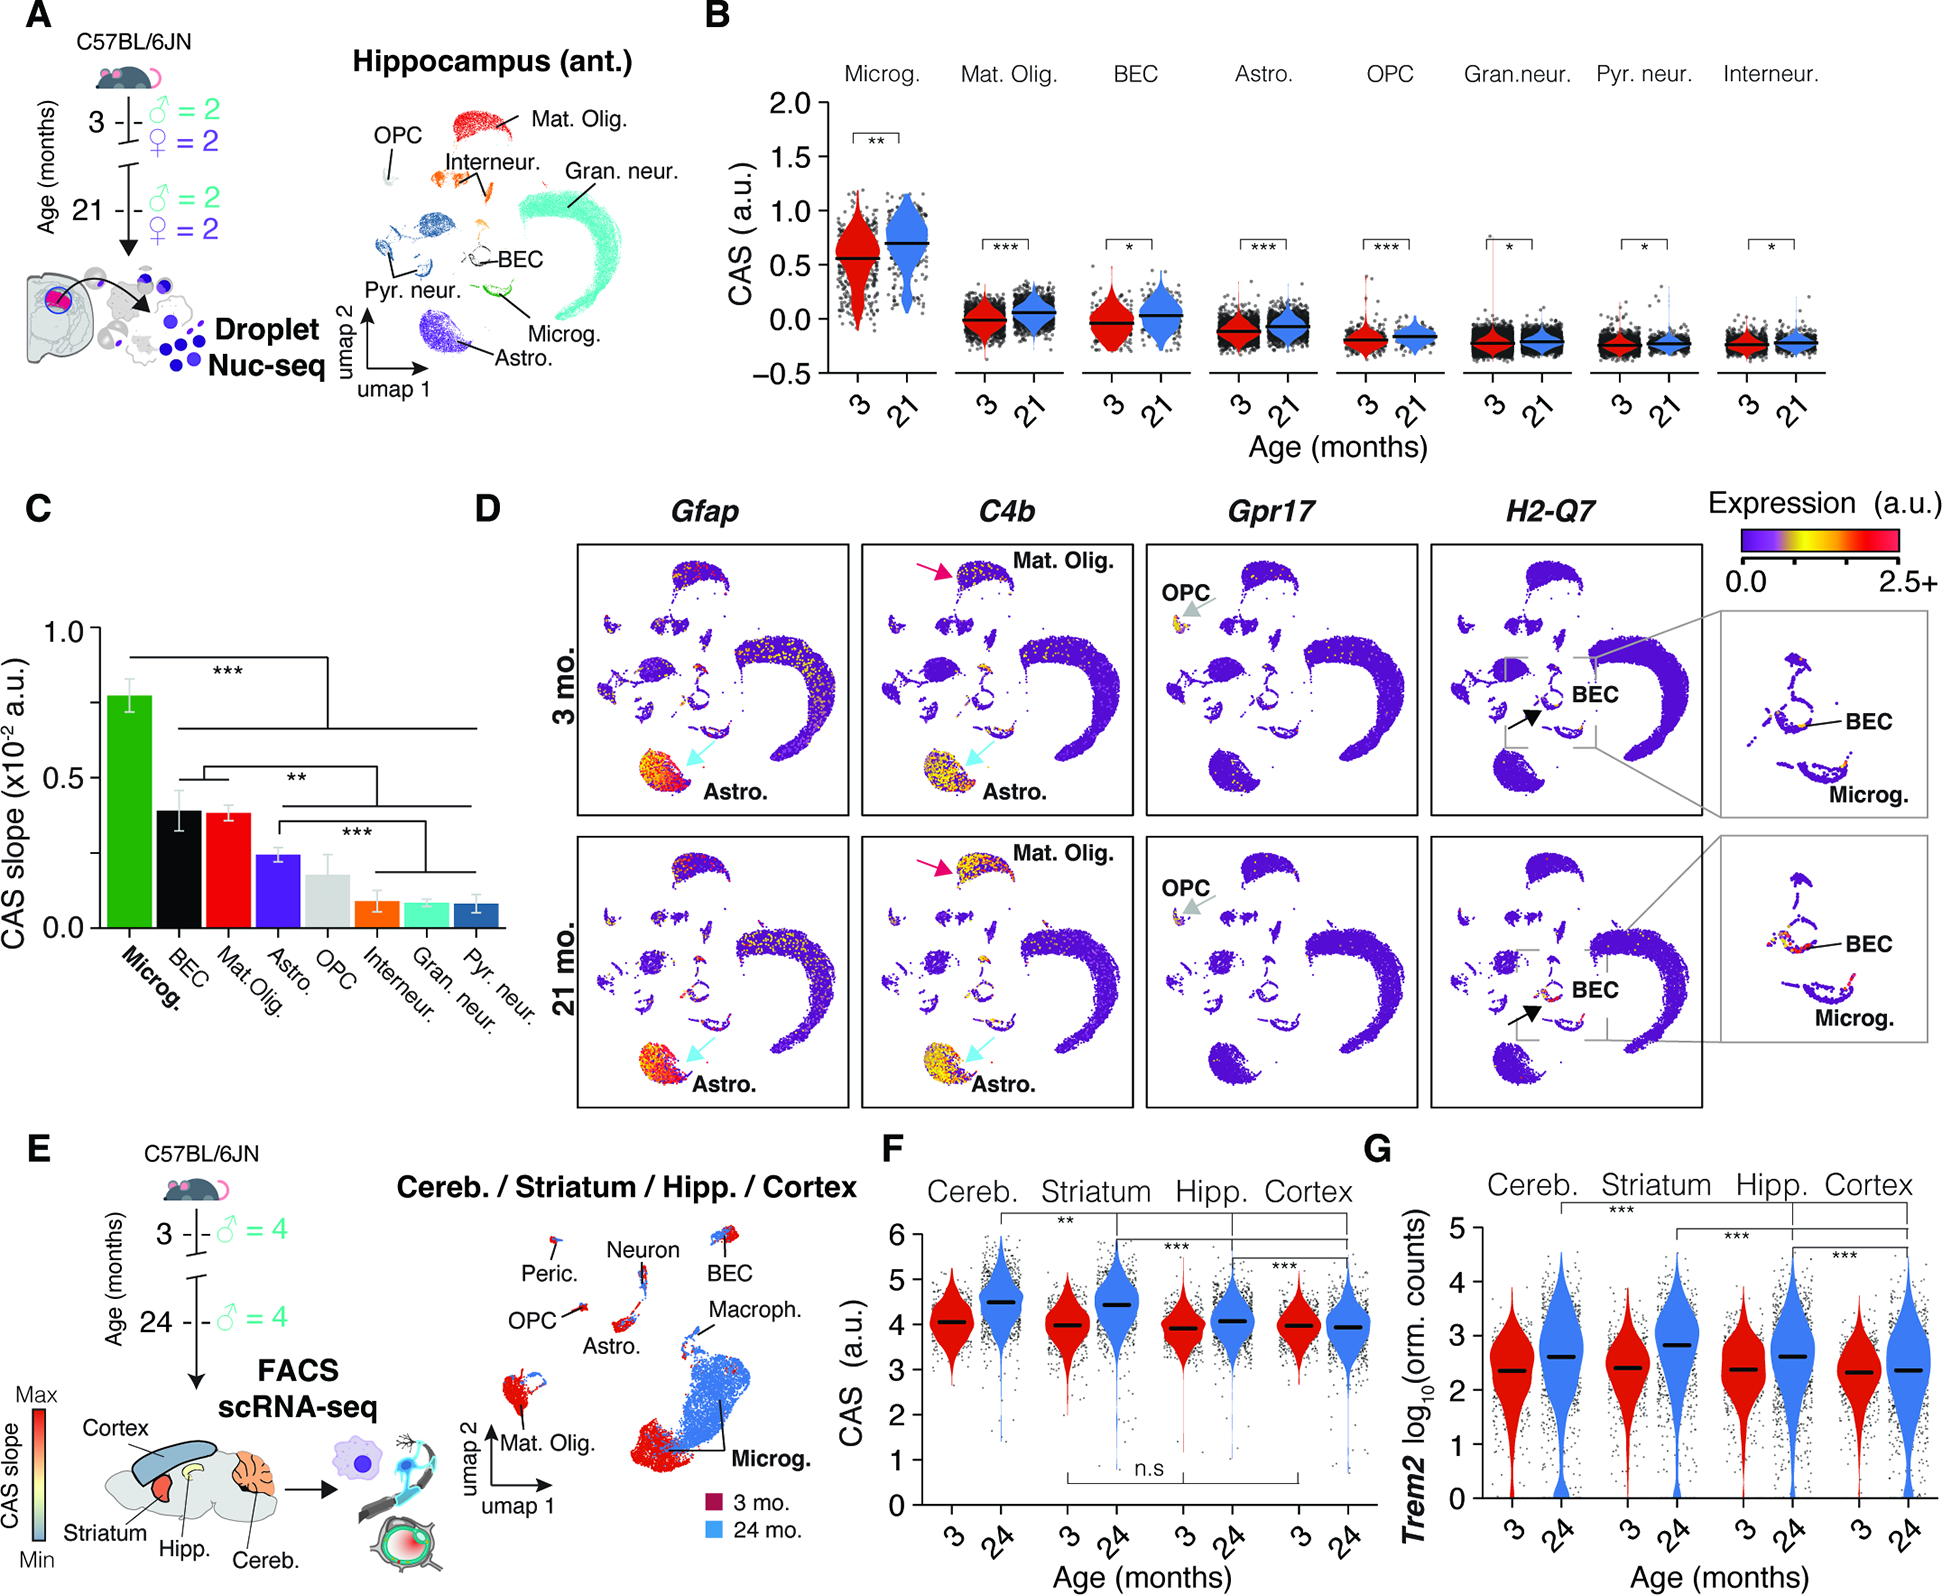
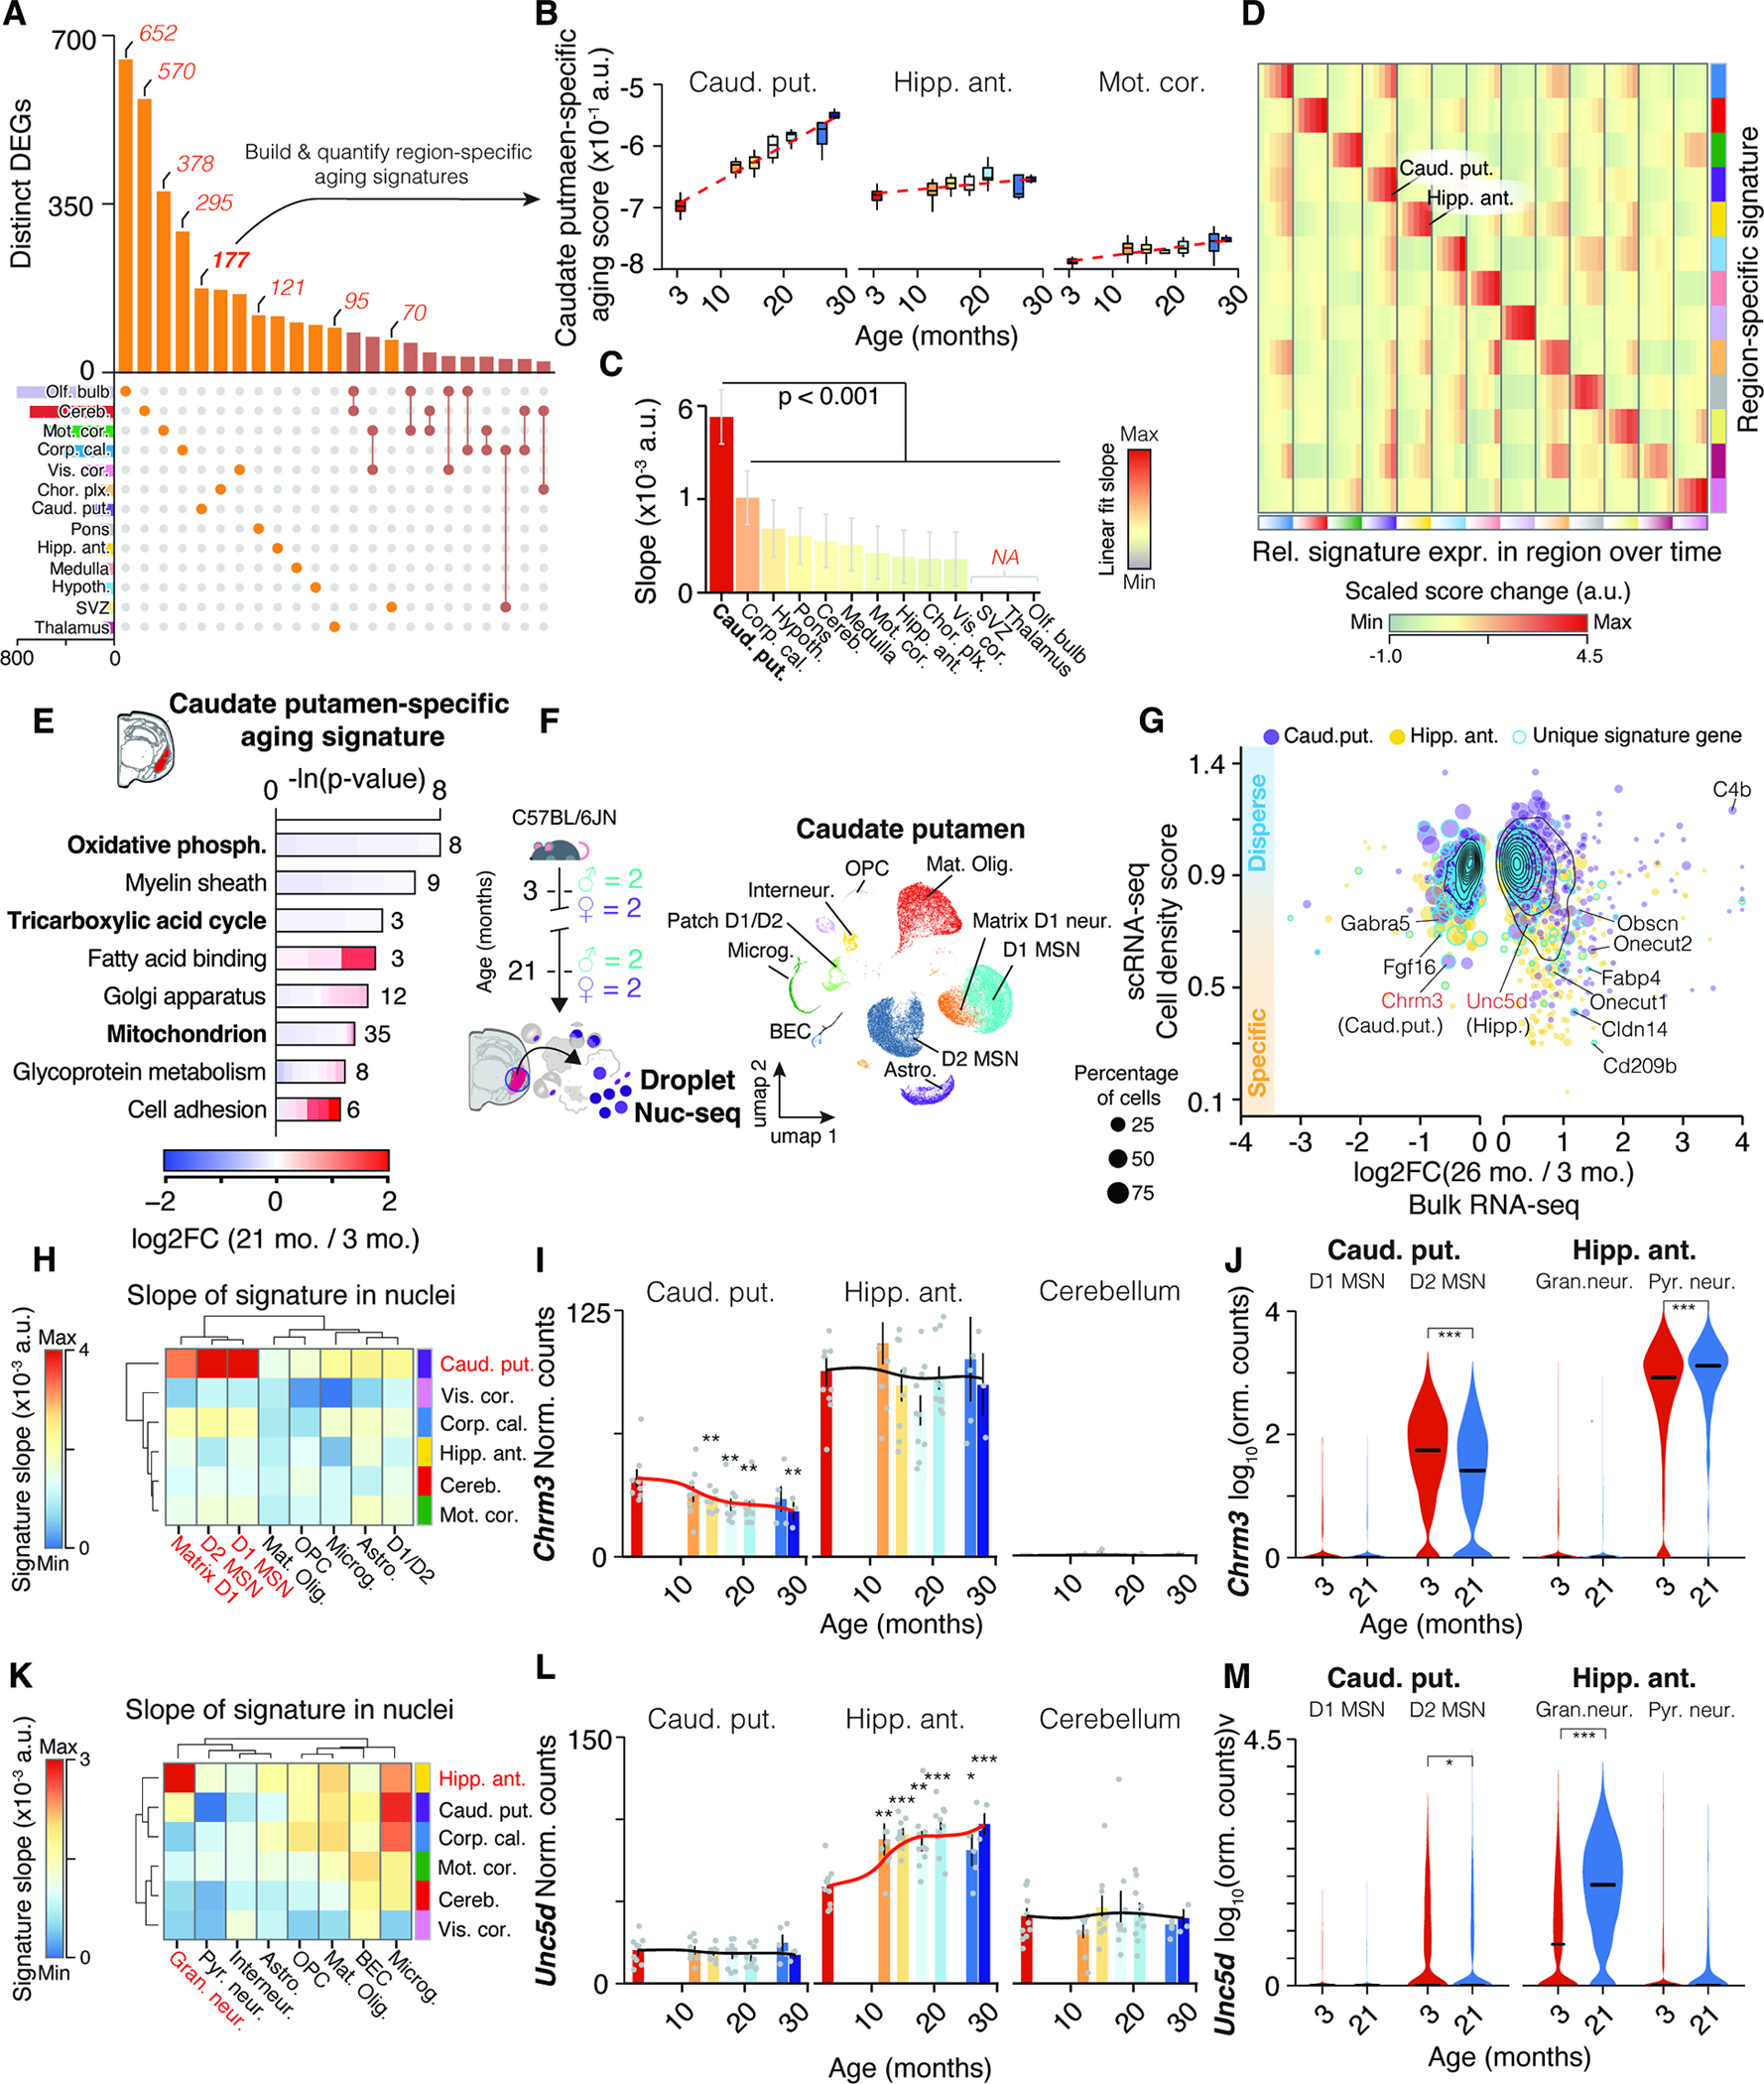
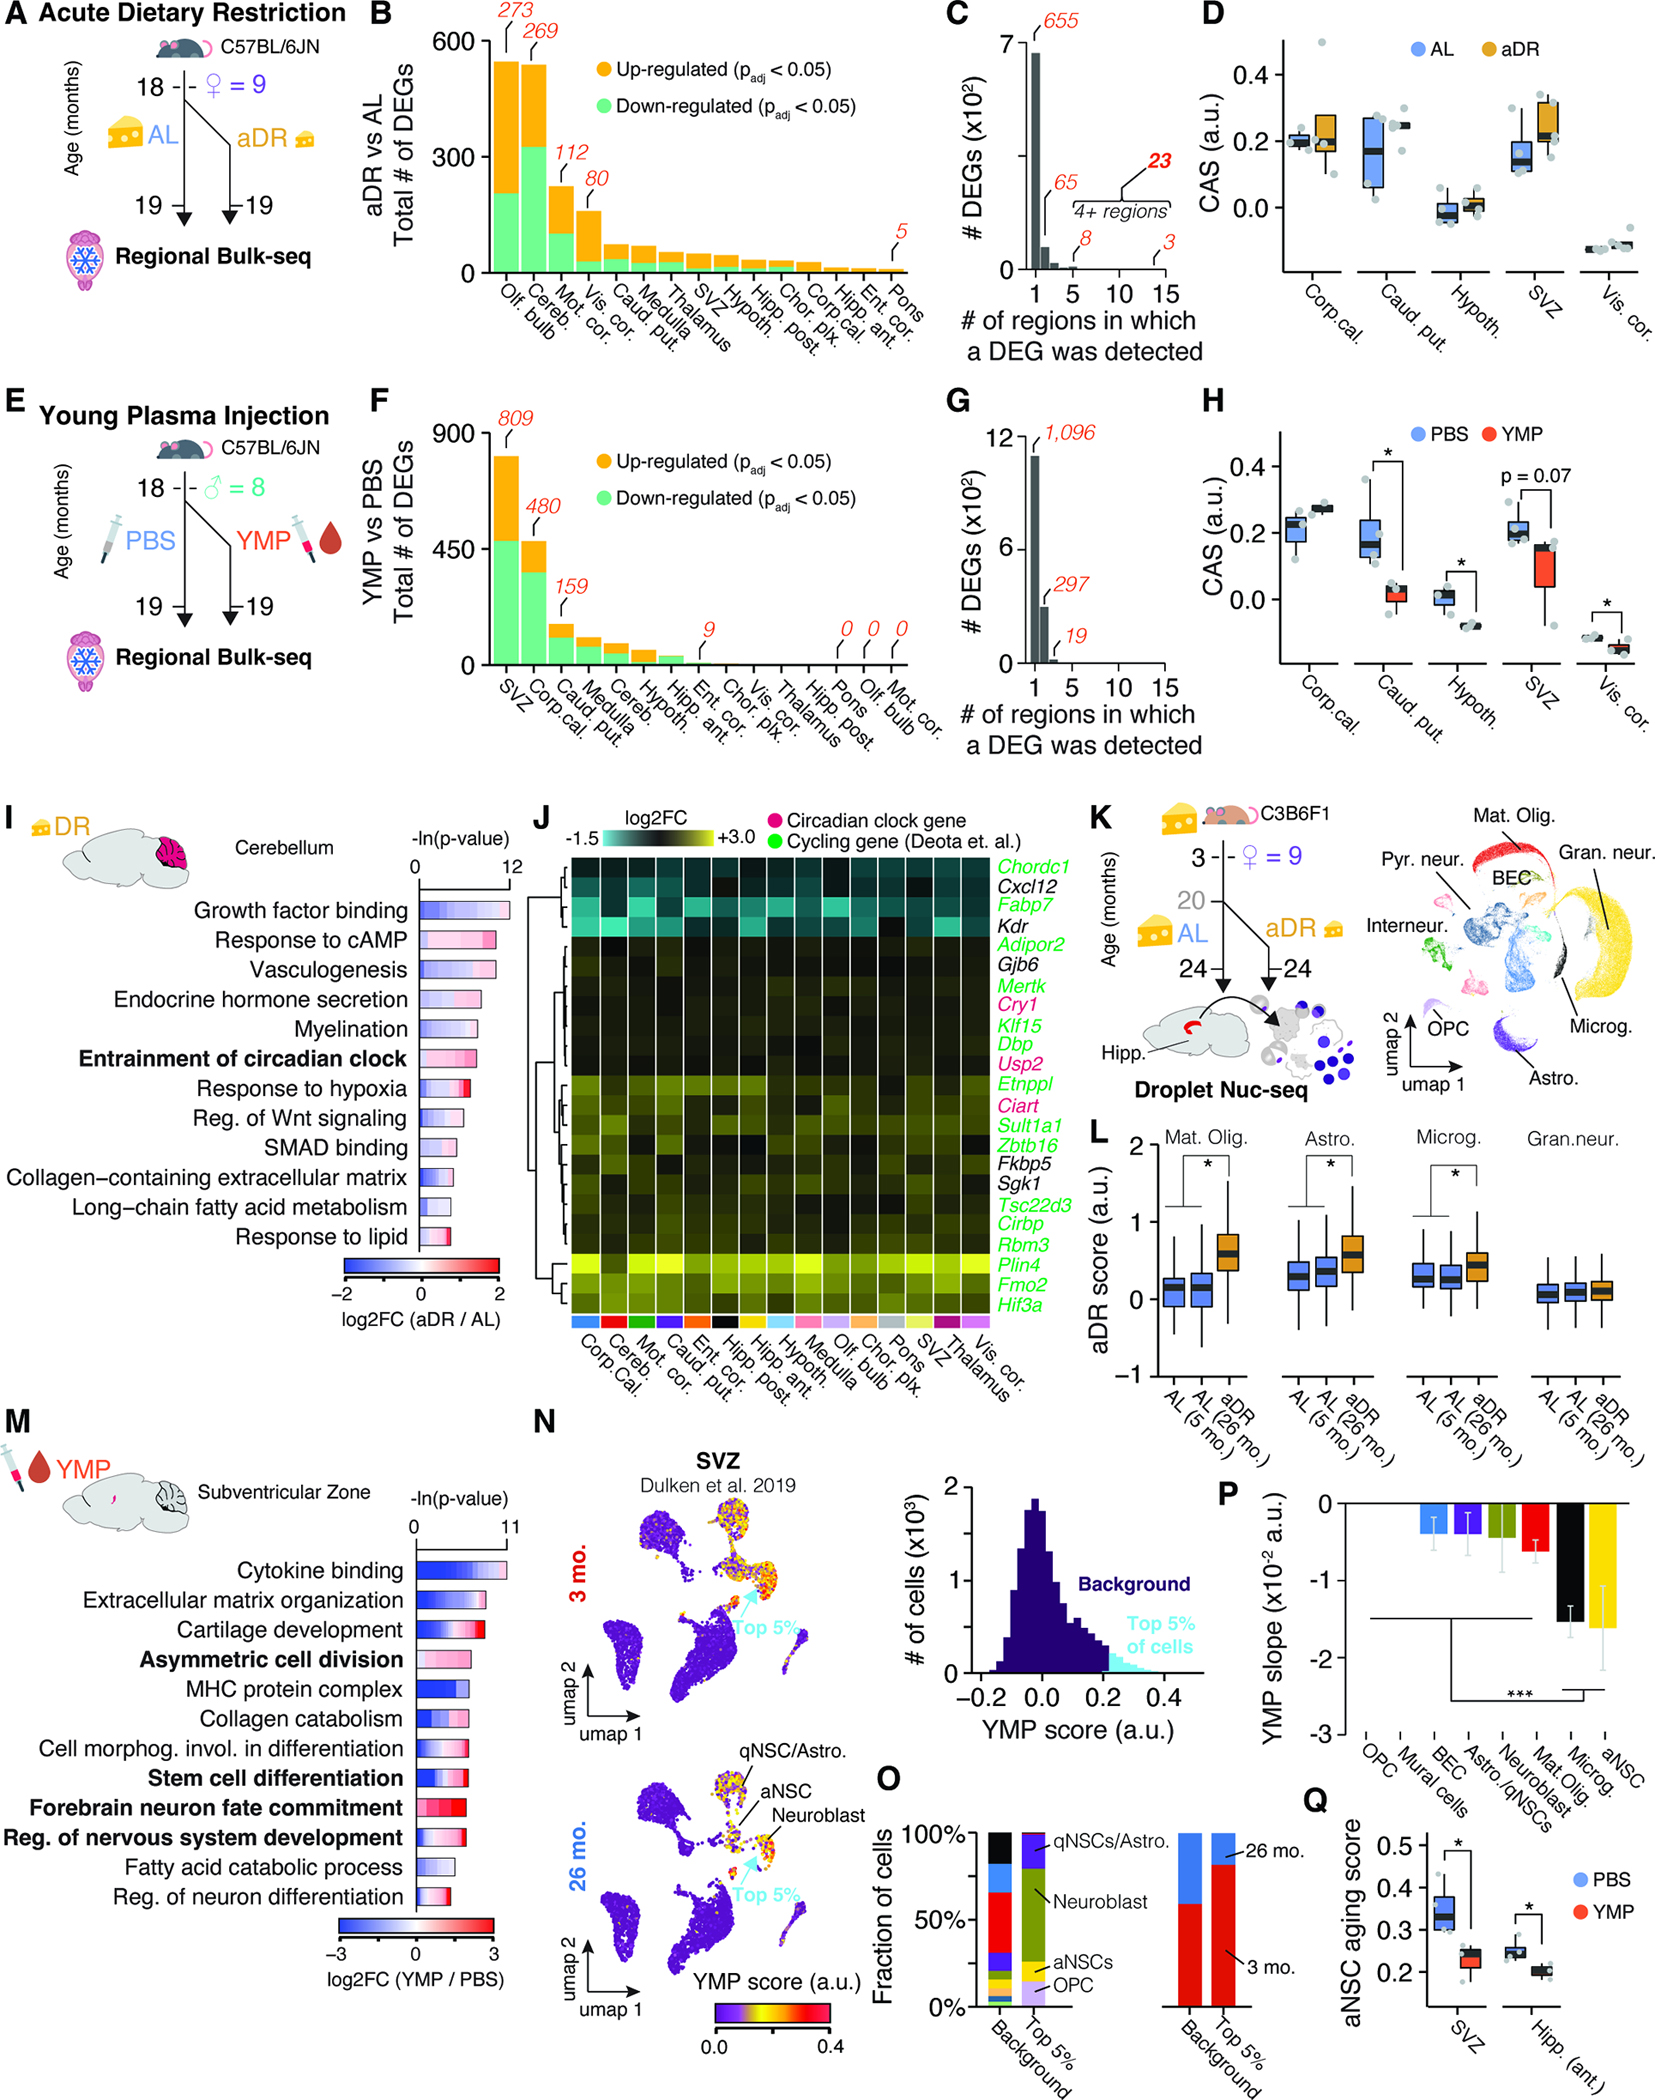
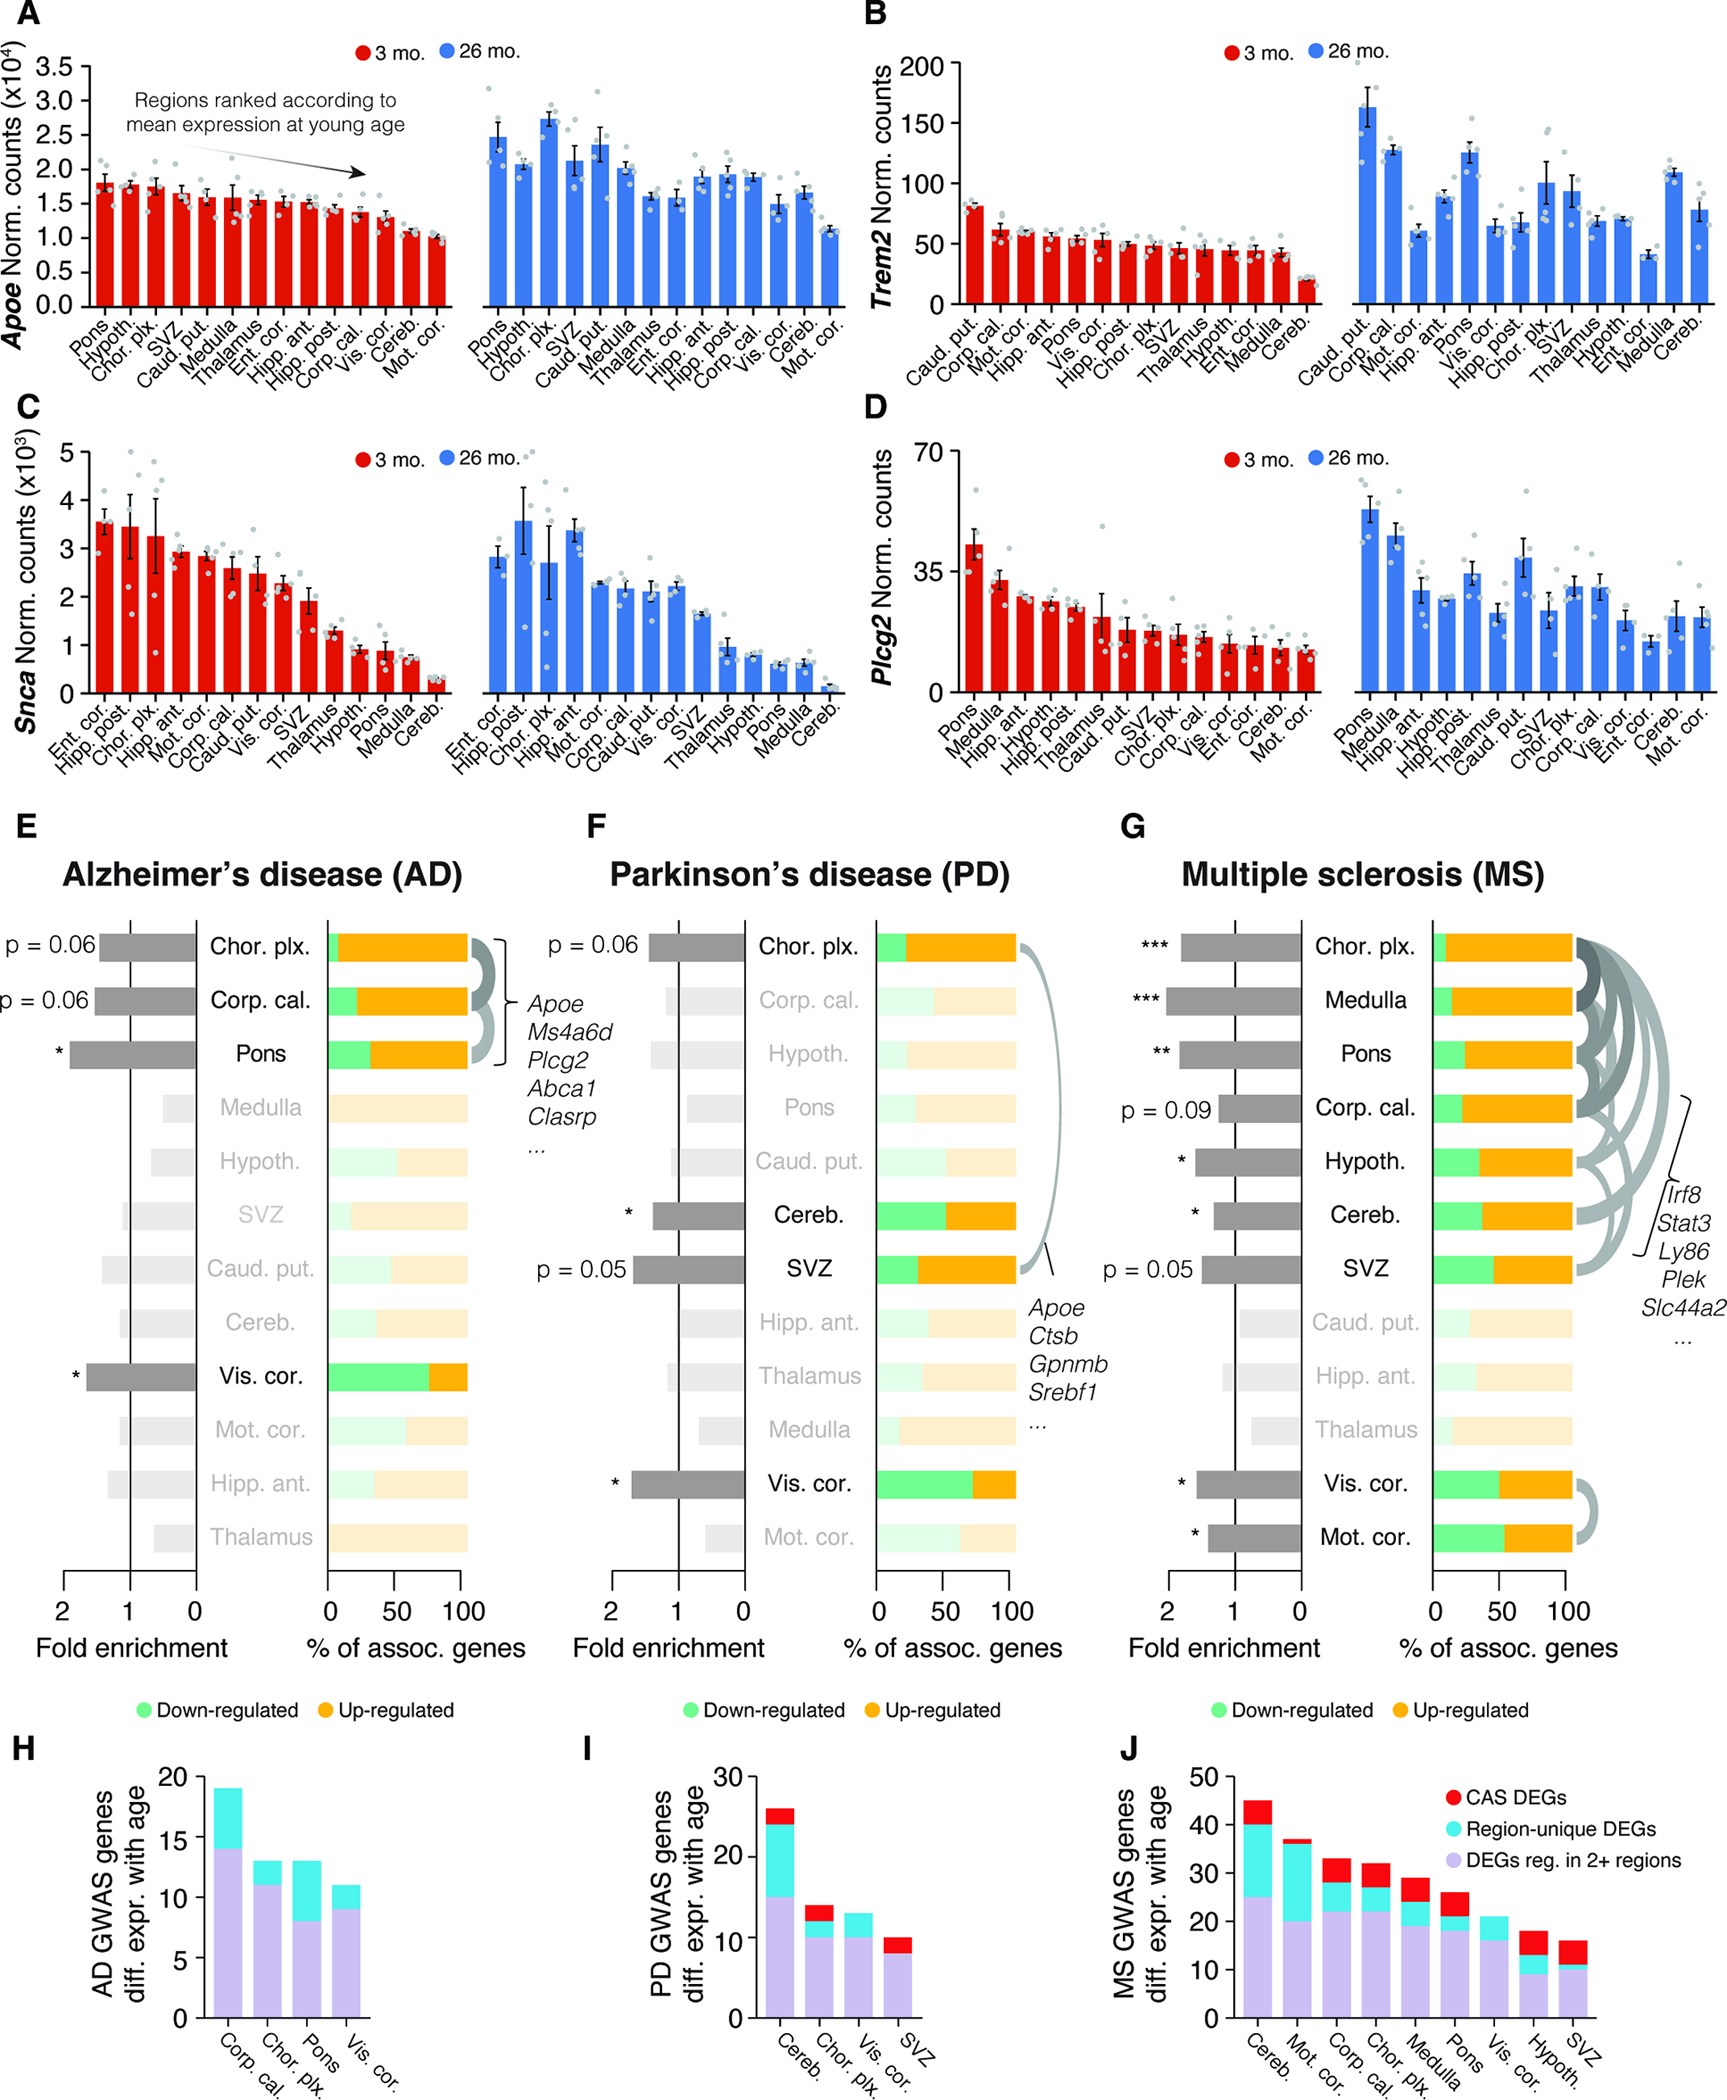
Aging is the key risk factor for cognitive decline, yet the molecular changes underlying brain aging remain poorly understood. Here, we conducted spatiotemporal RNA sequencing of the mouse brain, profiling 1,076 samples from 15 regions across 7 ages and 2 rejuvenation interventions. Our analysis identified a brain-wide gene signature of aging in glial cells, which exhibited spatially defined changes in magnitude. By integrating spatial and single-nucleus transcriptomics, we found that glial aging was particularly accelerated in white matter compared with cortical regions, whereas specialized neuronal populations showed region-specific expression changes. Rejuvenation interventions, including young plasma injection and dietary restriction, exhibited distinct effects on gene expression in specific brain regions. Furthermore, we discovered differential gene expression patterns associated with three human neurodegenerative diseases, highlighting the importance of regional aging as a potential modulator of disease. Our findings identify molecular foci of brain aging, providing a foundation to target age-related cognitive decline.

Keywords: aging; dietary restriction; neurodegeneration; neurogenomics; neuroscience; single-cell biology.


Conflict of interest statement

Declaration of interests The authors declare no competing interests.

Figures

Figure 1
Figure 1. Brain regions exhibit distinct transcriptional patterns of aging.
(A) Cohort overview. Whole brains were collected from male (n = 3–5, 3–28 months) and female (n = 5, 3–21 months) C57BL/6JN mice. (B) Study outline. 15 brain regions were isolated and analyzed using Bulk-seq. (C) UMAP representation of brain region transcriptomes. (D) Diffusion maps of region transcriptomes from selected areas. (E) C4b expression in selected regions. Black lines indicate smoothed gene expression. Differential expression compared to 3 months group is indicated. Mean ± s.e.m. Two-sided Wald test. (F) Smoothed line plot displaying DEGs for pairwise comparisons. Positive (negative) values represent up-regulated (down-regulated) genes. DEGs that reached significance in ≥ 2 pairwise comparisons were included. (G) Heat map of data in (F). (H) Number of age-correlated genes, colored by regulation. (I) Networks of the most connected genes (‘eigengenes’) in selected regions. (J) Chord diagram of genes shared in age-associated modules across regions. Modules and associated genes are listed in Table S1.
Figure 2
Figure 2. Common gene signature identifies regions with accelerated aging.
(A) Bar graph indicating the number of regions in which a DEG was detected (Table S1). (B) Region-wise expression changes for genes with shifts in 10 of 15 collected regions.(C) Representative GO analysis of 82 genes forming the CAS. Lengths of bars represent negative ln-transformed Padj using Fisher’s exact test. Colors indicate gene-wise log2 fold-changes in the corpus callosum. Table S1 contains full results list. (D) CAS trajectories selected regions. Insert indicates trajectories for male and females in the hypothalamus. (E) CAS trajectories of all regions approximated via LOESS and linear regression (F) Offset and slope comparison for linear models. (G) Slope of linear regressions in (D), colored by slope. Mean ± 95% confidence intervals. Two-sided Tukey’s HSD test. Bolded regions are highlighted in the following panel. (H) Mouse brain cross-section, with regions colored by CAS linear slopes.. (I) Slope of linear regression across all brain regions, colored by sex. Mean ± 95% confidence intervals. Two-sided Tukey’s HSD test. The highest (least significant) Pval is indicated. (J) Correlation of the abundance of major glia cell types (as measured in ) with the regions’ respective CAS slopes. Significance tested through spearman correlation and linear regression.
Figure 3
Figure 3. Spatially-resolved CAS detects accelerated aging in white matter tracts.
(A) 10X Visium experiment overview. Brain tissue was collected from an independent male C57BL/6J mouse cohort (n = 2 mice; 6, 18 and 21 months). (B) Spatial transcriptome data, colored by cluster-based annotation. Labels represent region-level annotation. Labels represent region-level annotation according to Figure S4. Complete data description and abbreviations are in Figure S4. (C) Comparison of Bulk-seq and Visium differential expression results in selected regions. DEGs found in both datasets are shown, with CAS genes highlighted.The number of overlapping DEGs in each quadrant is indicated in blue. (D) Spatially-resolved expression of Trem2 across age. Violin plots represent expression in white matter- and cortex-associated spots, split by replicates. (E) Spatial representation of CAS. Spots with values ≥ 0 are shown. (F) CAS across spatial clusters of selected regions. Red line indicates linear regression fit. (G) Comparison of CAS slopes for linear models in Bulk-seq and Visium data, colored by region. Corpus callosum, caudate putamen and motor cortex regions were chosen to represent white matter, striatum and cortex, respectively.
Figure 4
Figure 4. Aging in glia and endothelial cells is the major contributor to CAS increase.
(A) Nuc-seq experiment overview. Nuc-seq of anterior hippocampus from same mice used for bulk RNA-seq (n = 4; 3, 21 months). UMAP of nuclei populations (n = 36,339). (B) CAS across hippocampal cell types. P values from two-tailed t-test on per-replicate median of CAS. (C) CAS slope of linear regressions in (B). Two-sided Tukey’s HSD test. The highest (least significant) Pval is indicated. (D) Expression of CAS genes Gfap, C4b, Gpr17, H2-Q7. Additional details in Methods S2, section 2 and 3. (E) Meta-analysis of scRNA-seq data from of microglia from different brain regions. UMAP of all cell populations (n = 6,373). (F,G) CAS and Trem2 expression across microglia from different brain regions. (MAST, Benjamini–Hochberg correction; false discovery rate (FDR).<.0.05 and logFC.>.0.2).
Figure 5
Figure 5. Neuronal transcripts encode region-specific expression shifts. (A) UpSet plot showing regional specificity of DEGs.
Unique gene sets were used to construct region-specific aging signatures. (B) Trajectories of caudate putamen-specific aging score in selected regions. (C) Slope of linear regressions in (B), colored by slope. Mean ± 95% confidence intervals. (D) Score changes for region-specific signatures relative to 3 months. Statistical analysis in Methods S3, section 2. (E) Representative GO enrichment for 177 DEGs unique to caudate putamen. Table S1 contains full results list. (F) Nuc-seq experiment overview of left-hemisphere regions from same mice used for bulk RNA-seq (n = 4; 3, 21 months). (G) Single-nuclei dispersion scores vs. log2-transformed expression ratios for different regions. Region-specific score genes are highlighted. (H) Slope of cell type-wise changes with age for caudate putamen-specific signature. D1 and D2 Medium spiny neuron populations (MSN) are highlighted. (I,J) Bulk and cell type-wise and expression changes for Chrm3. (K) Slope of cell type-wise changes with age for hippocampus-specific signature. (L-M) Bulk and cell type-wise and expression changes for Unc5d. Additional details in Methods S3, section 2.
Figure 6
Figure 6. Young plasma injection and acute dietary restriction trigger distinct spatial gene expression changes in the aged brain.
(A) Experiment overview. Aged female mice (n = 4–5) either underwent acute dietary restriction (aDR) for five weeks or continued with ad libitum (AL) feeding before brain collection and bulk-seq analysis on 15 regions. (B) The number of DEGs, split by region and regulation. (C) Bar graph showing the regions where a particular DEG was detected. Refer to Table S1 for the list of DEGs (D) CAS shifts in response to aDR across selected regions. One-tailed t-test. (E) Experiment overview. Aged male mice (n – 3–4) were injected with either young mouse plasma (YMP) or PBS over four weeks. (F-H) Similar to (B-D) for YMP experiments. (I) Representative GO analysis of DEGs with shifts in cerebellum due to aDR. Table S1 contains full results list. (J) Region-wise expression changes in aDR for 24 genes with shifts in at least four of the collected regions. (K) Experiment overview. Nuc-seq of whole hippocampus from female C3B6F1 mice undergoing AL-to-aDR dietary switch at 20 months. UMAP representation of all nuclei is depicted (n=69,253) (L) Boxplot representation of common aDR scores in four cell types. two-tailed t-test on per-replicate median. (M) Similar to (I) but for YMP-induced DEGs in SVZ. (N) UMAP representation of single-cell SVZ data with scores for YMP signature. Cells are colored with scores for YMP signature (representing DEGs up-regulated in response to YMP). Histogram of score distribution is depicted on the right-hand side. Signature genes can be found in Table S1. (O) Composition of cell types and age groups in cells showing the highest YMP scores. (P) YMP score slope of linear regressions against age, colored by cell type. Mean ± 95% confidence intervals. (Q) Boxplot representation of scores for aNSC aging in SVZ and hippocampus in YMP- or PBS-injected mice. Two-tailed t-test on per-replicate median of score
Figure 7
Figure 7. Interplay of region and age determines expression of disease variant homologues.
(A-D) Bulk expression for (A) Apoe, (B) Trem2, (C) Scna (α-synuclein) and (D) Plcg2 at 3 and 26 months of age, represented with only male samples. Regions are arranged by descending order of mean expression at young age. Mean ± s.e.m. (E-G) Enrichment analysis of region-resolved DEGs for human GWAS variants for AD, PD, and MS, with associated genes listed in Table S1. Fold enrichment and relative composition of disease-associated DEGs with respect to their regulation are indicated. One-sided Fisher’s exact test with hypergeometric distribution. Order of regions results from hierarchical clustering on a pairwise Jacquard Distance matrix. Overlaps with a Jaccard index ≥ 0.25 are indicated with an arc. One-sided Fisher’s exact test. (H-J) Number of DEGs per region that are homologues of human GWAS variant for AD, PD, and MS. Colors group the genes into CAS DEGs, region-specific DEGs, or other (DEG in 2 or more but fewer than 10 regions).

References

    1. Kalache A, and Gatti A (2003). Active ageing: a policy framework. Adv. Gerontol. 11, 7–18. - PubMed
    1. Partridge L, Deelen J, and Slagboom PE (2018). Facing up to the global challenges of ageing. Nature 561, 45–56. - PubMed
    1. López-Otín C, Blasco MA, Partridge L, Serrano M, and Kroemer G (2013). The hallmarks of aging. Cell 153, 1194–1217. - PMC - PubMed
    1. Hou Y, Dan X, Babbar M, Wei Y, Hasselbalch SG, Croteau DL, and Bohr VA (2019). Ageing as a risk factor for neurodegenerative disease. Nat. Rev. Neurol. 15, 565–581. - PubMed
    1. Niccoli T, Partridge L, and Isaacs AM (2017). Ageing as a risk factor for ALS/FTD. Hum. Mol. Genet. 26, R105–R113. - PubMed

Publication types

LinkOut - more resources