. 2023 Oct 23;58(20):2140-2162.e5.
doi: 10.1016/j.devcel.2023.07.015. Epub 2023 Aug 16.

Molecular and spatial landmarks of early mouse skin development

Affiliations

Molecular and spatial landmarks of early mouse skin development

Tina Jacob et al. Dev Cell. .

Abstract

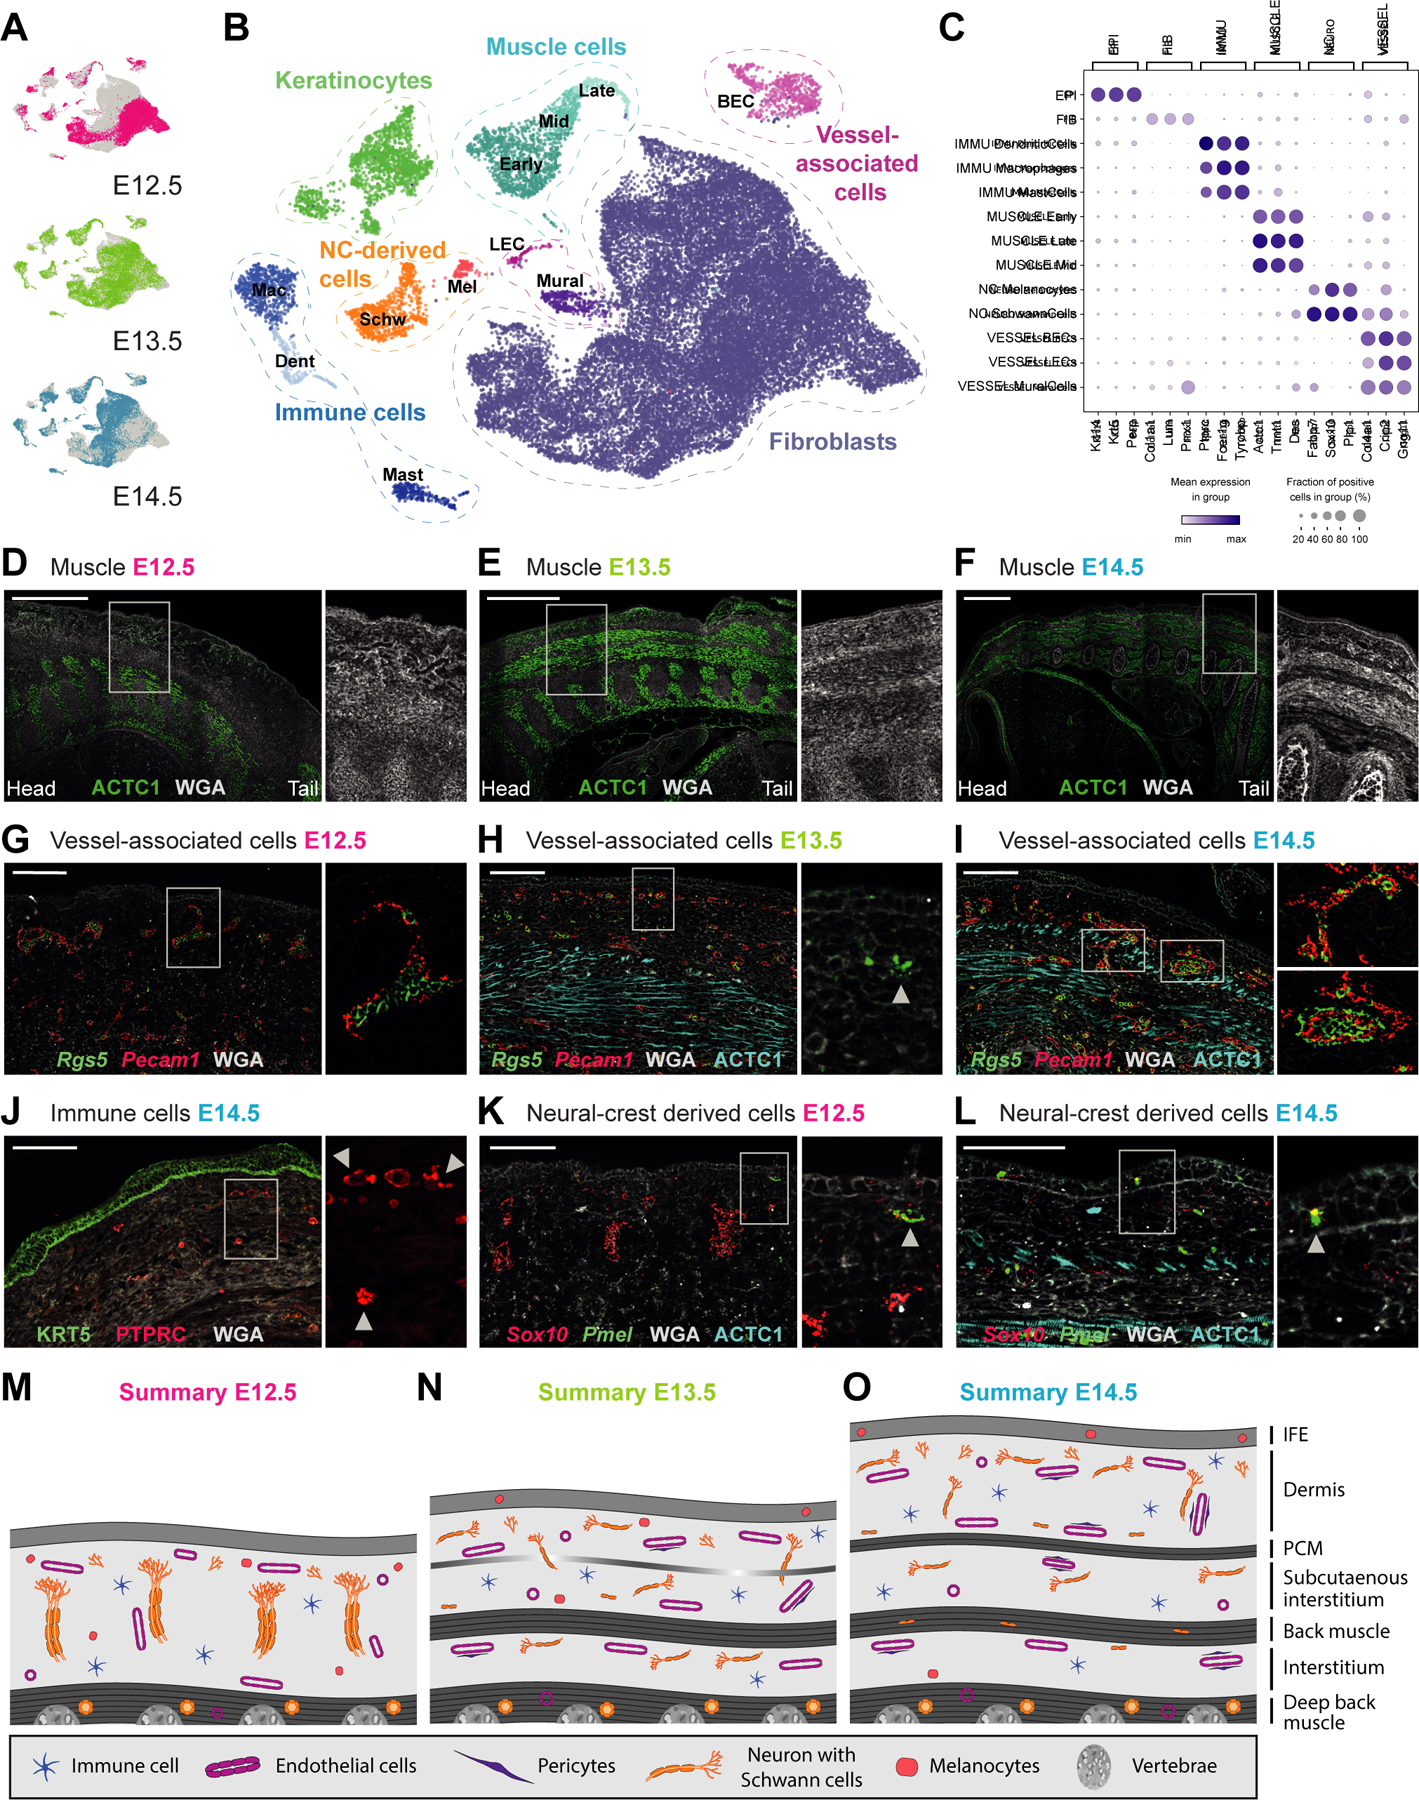
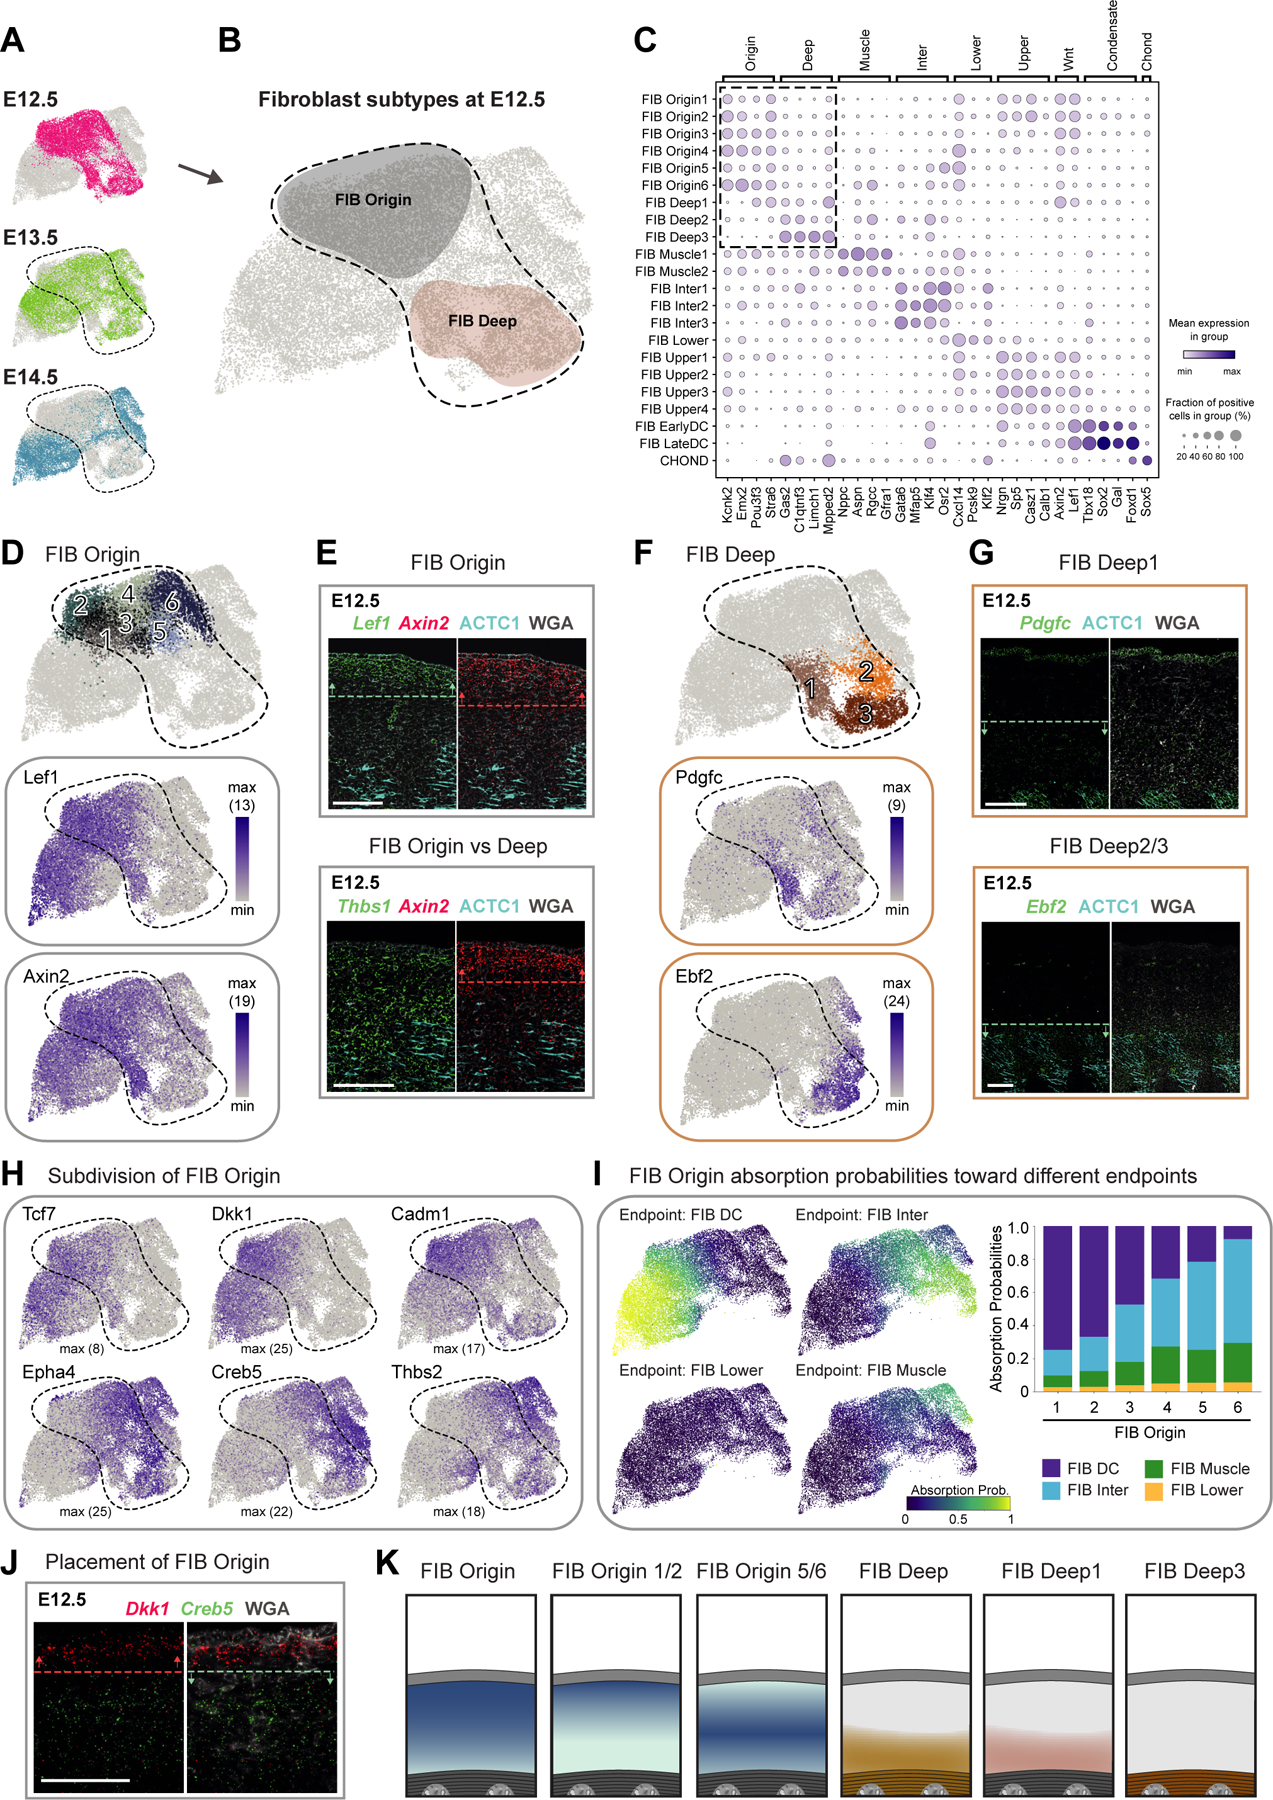
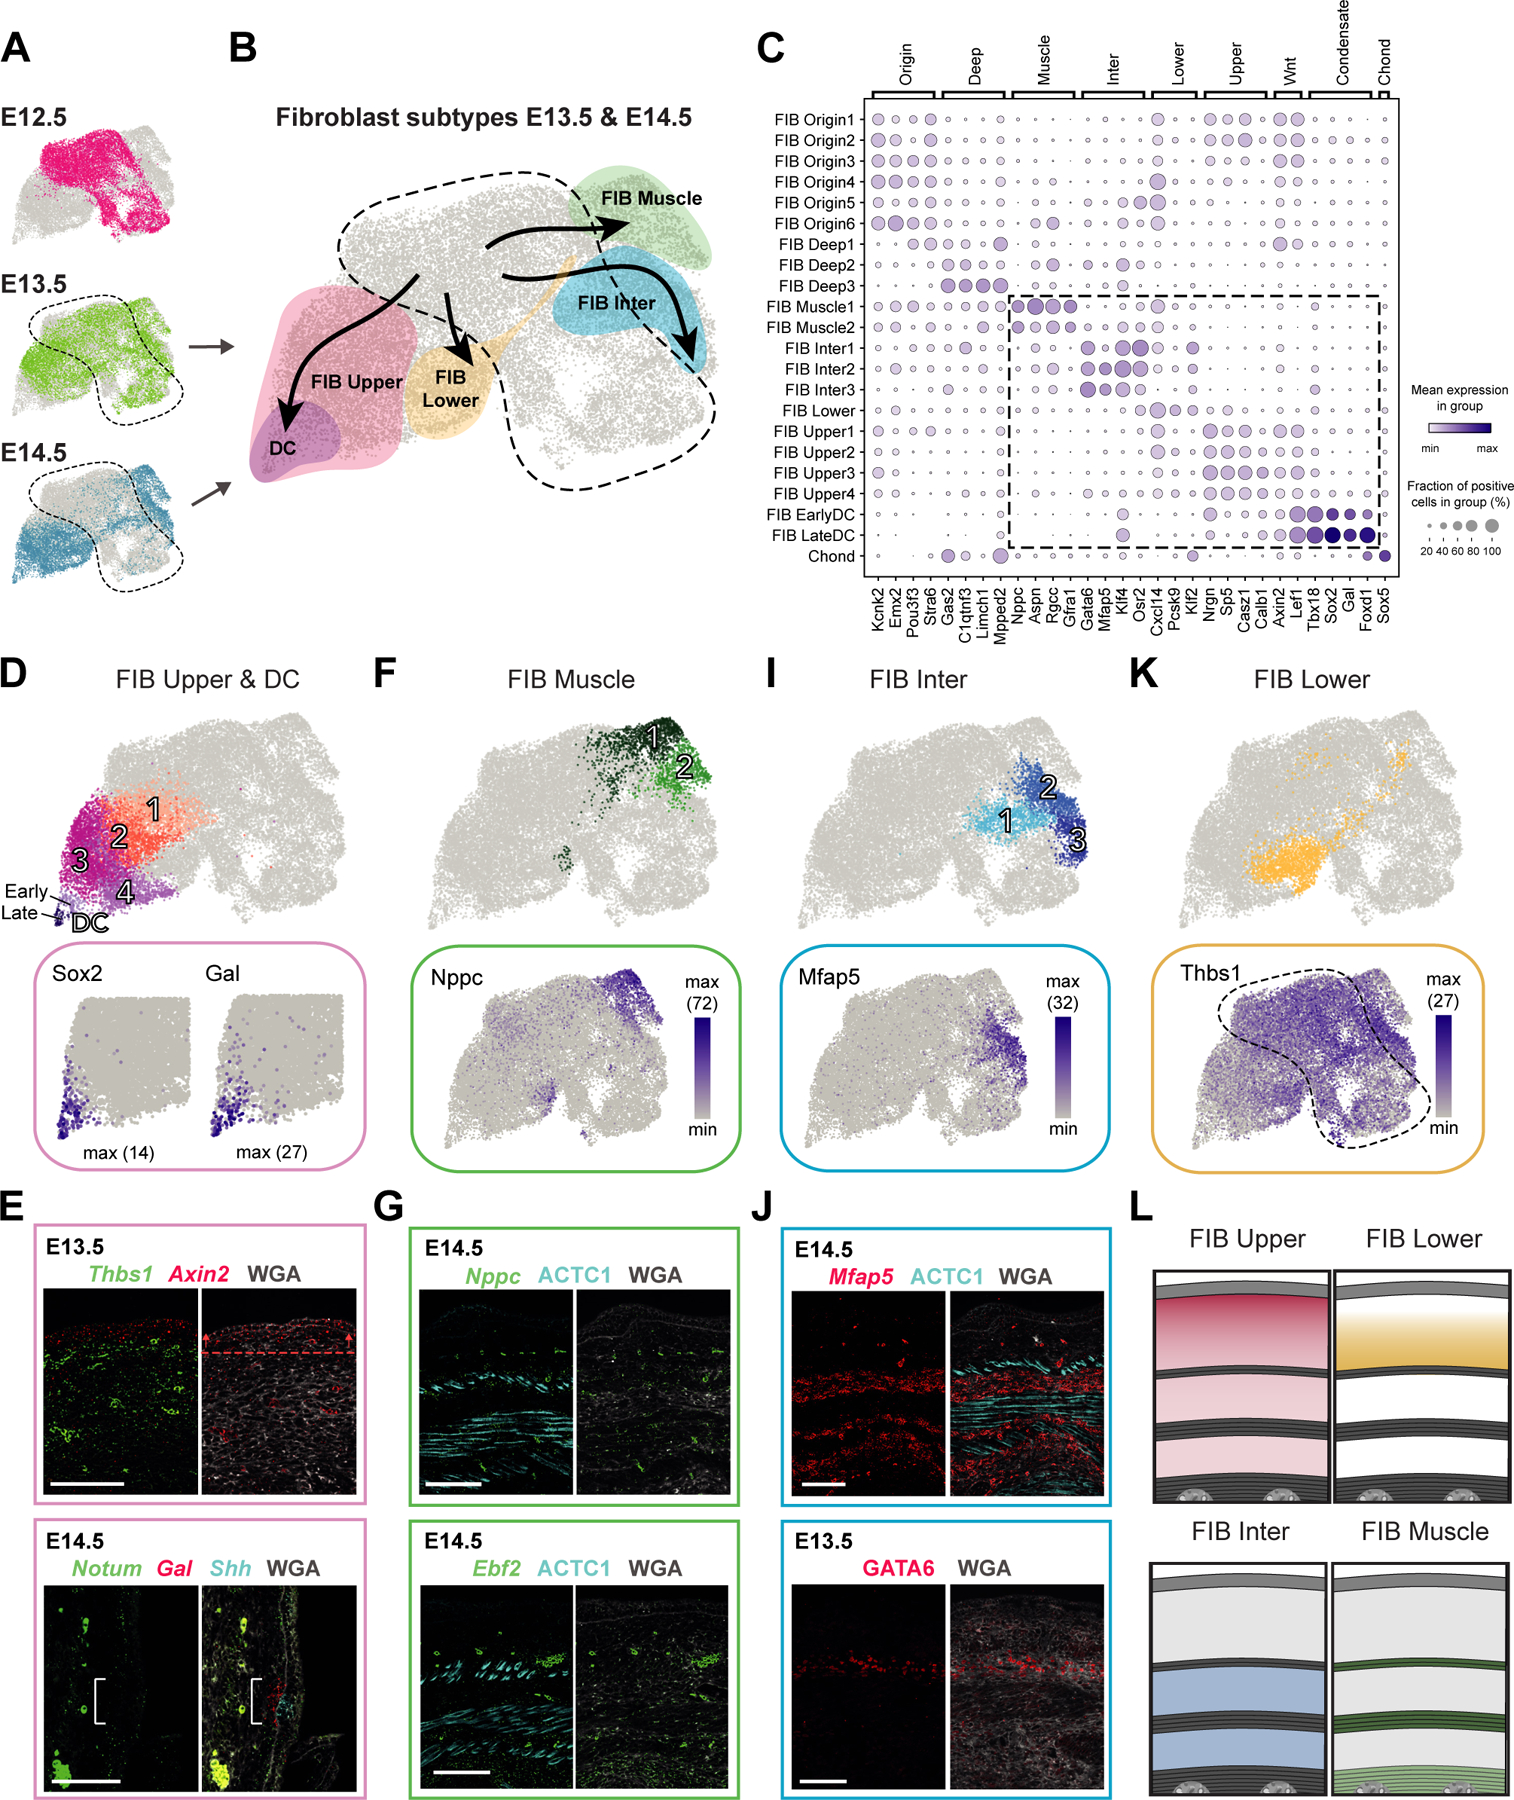
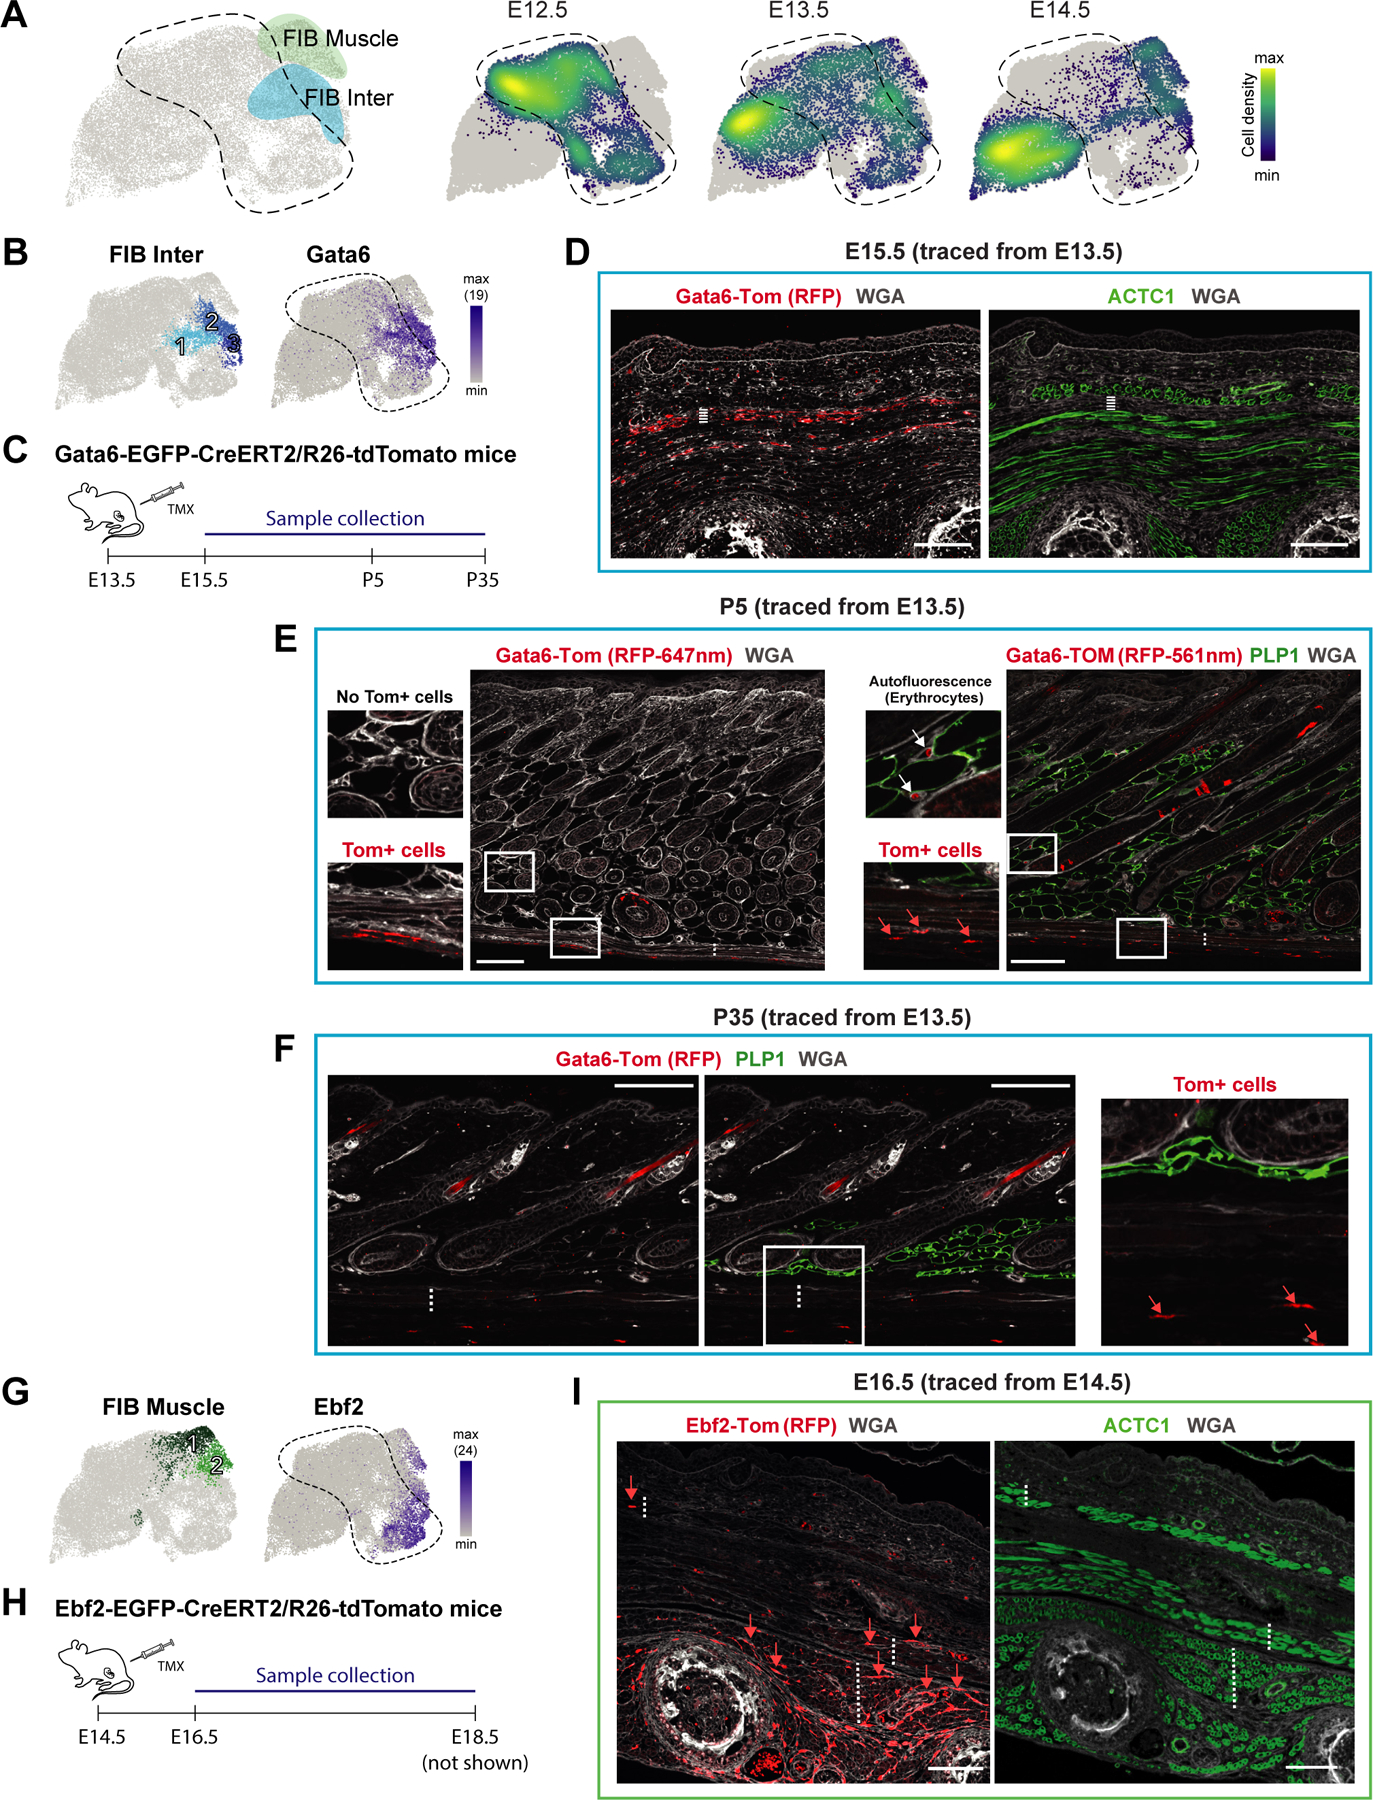
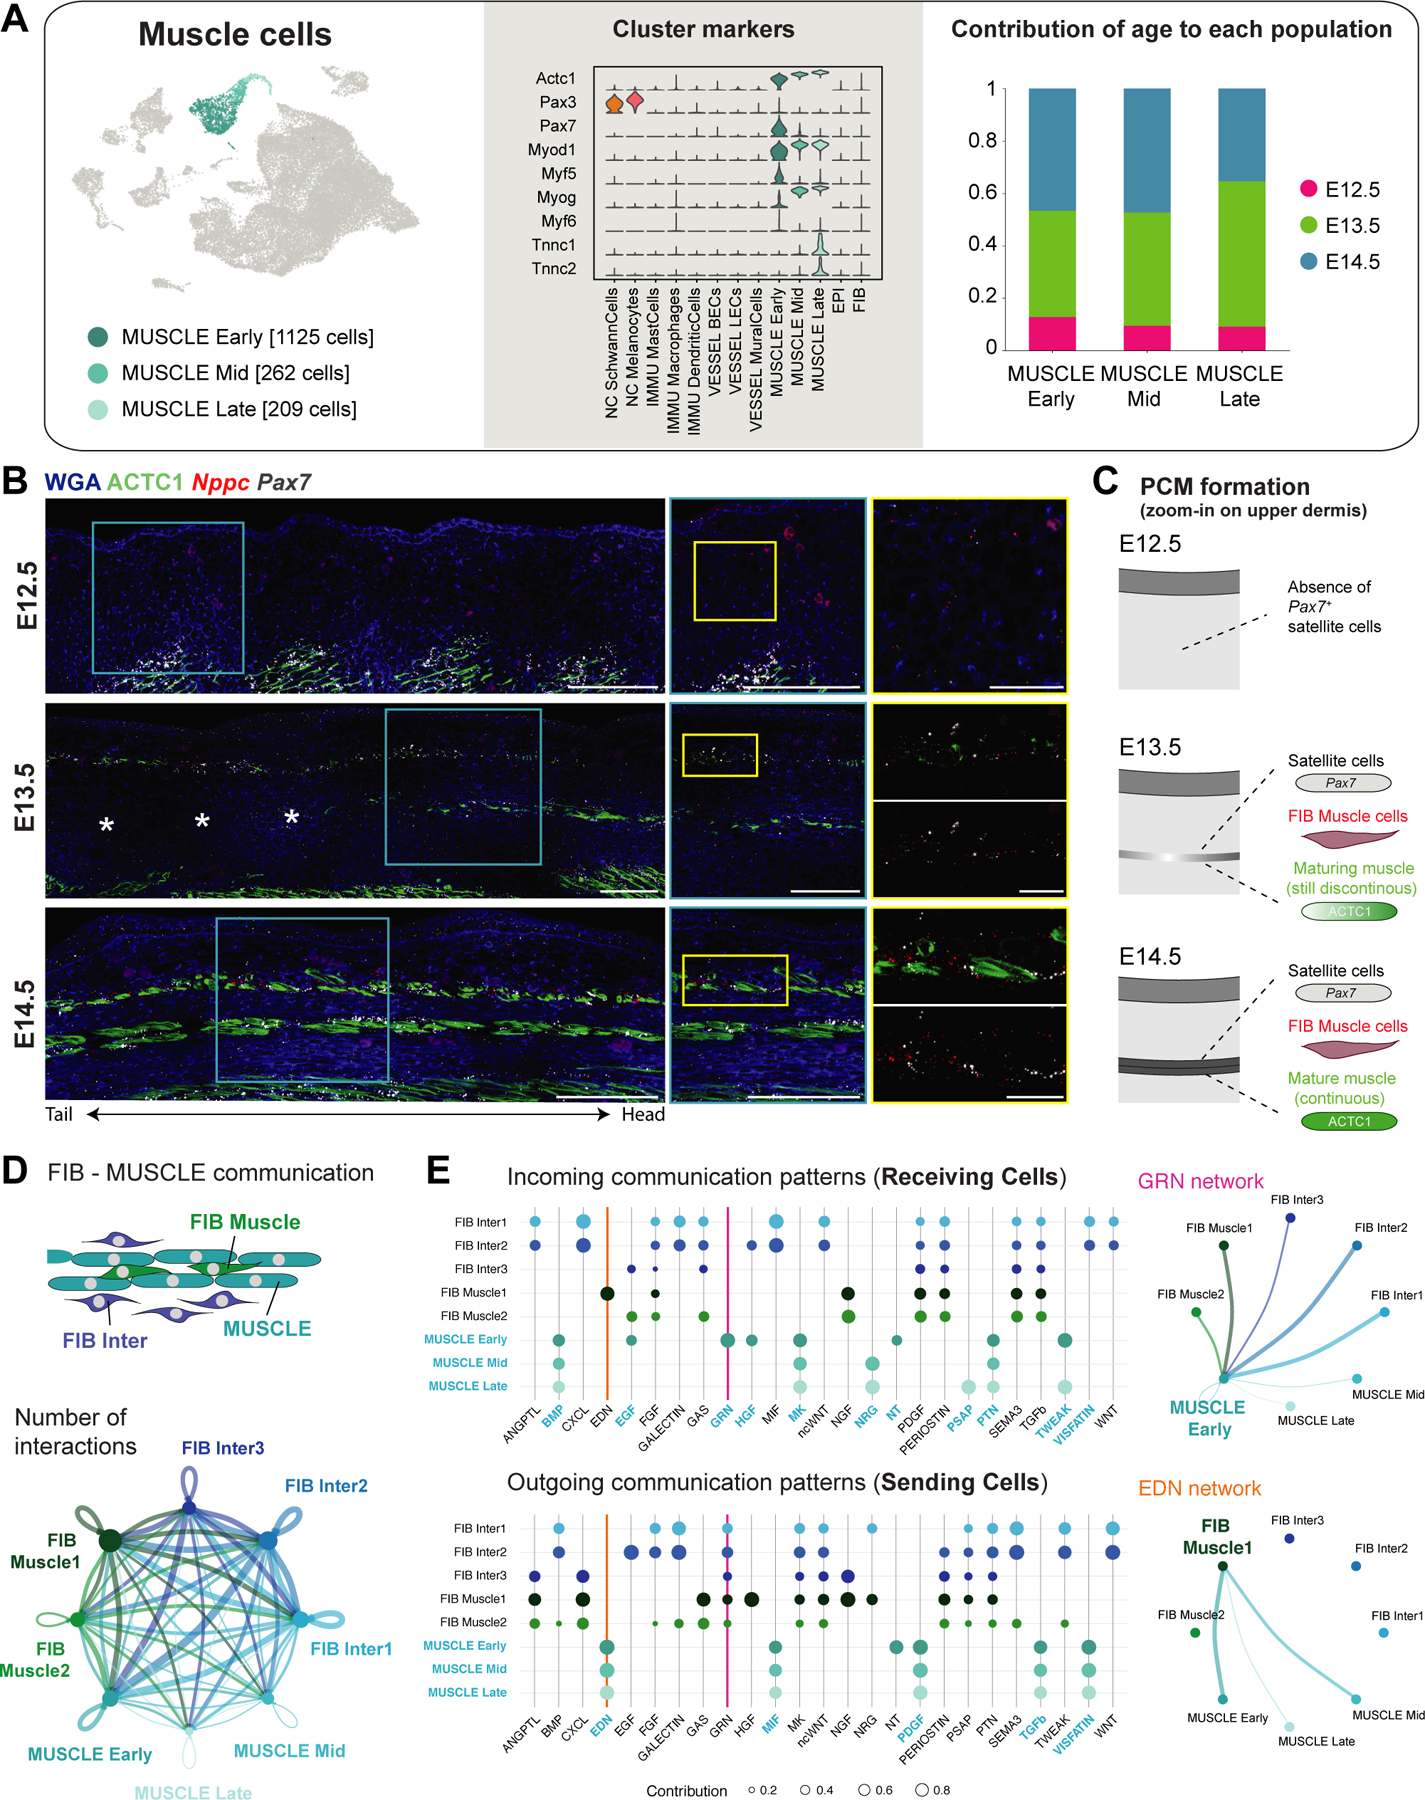
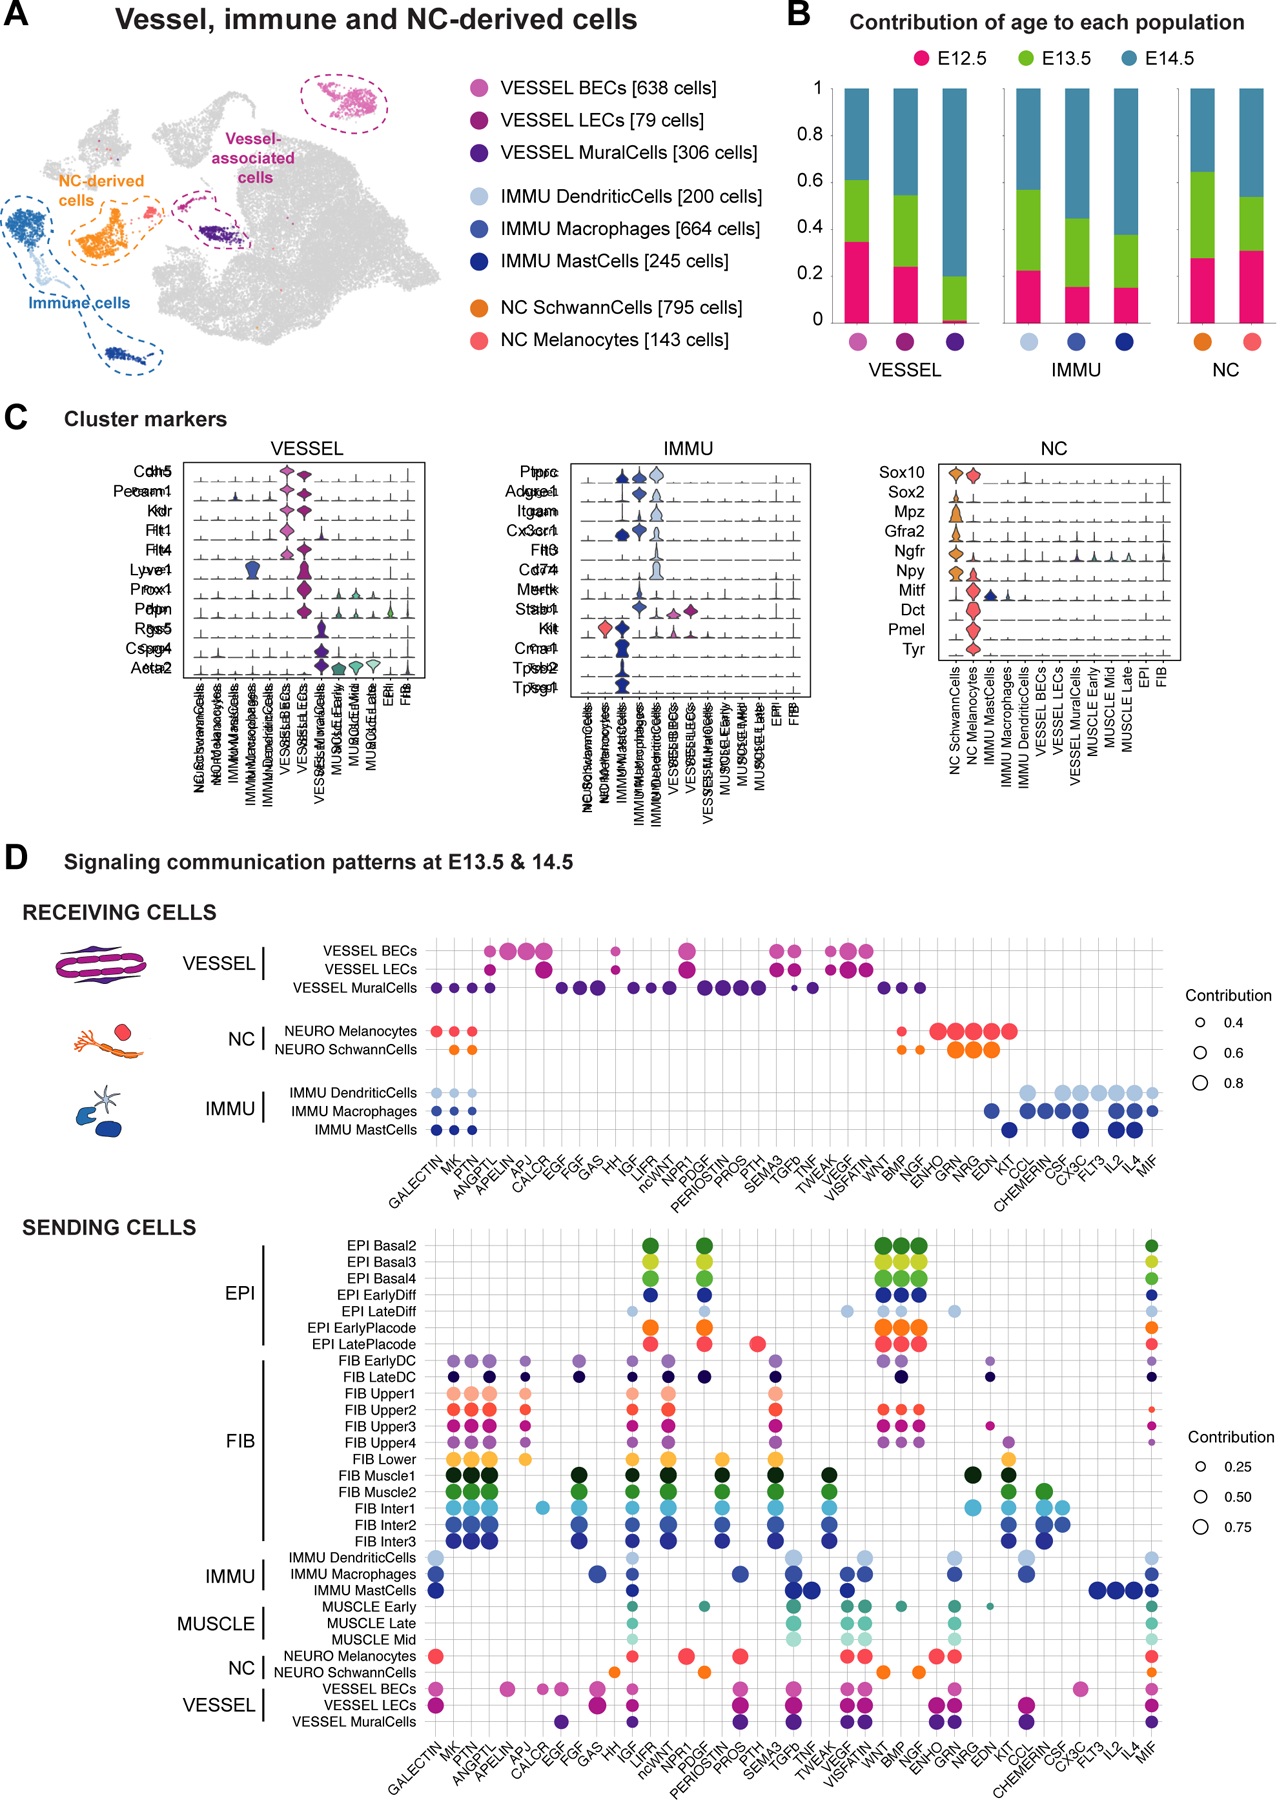
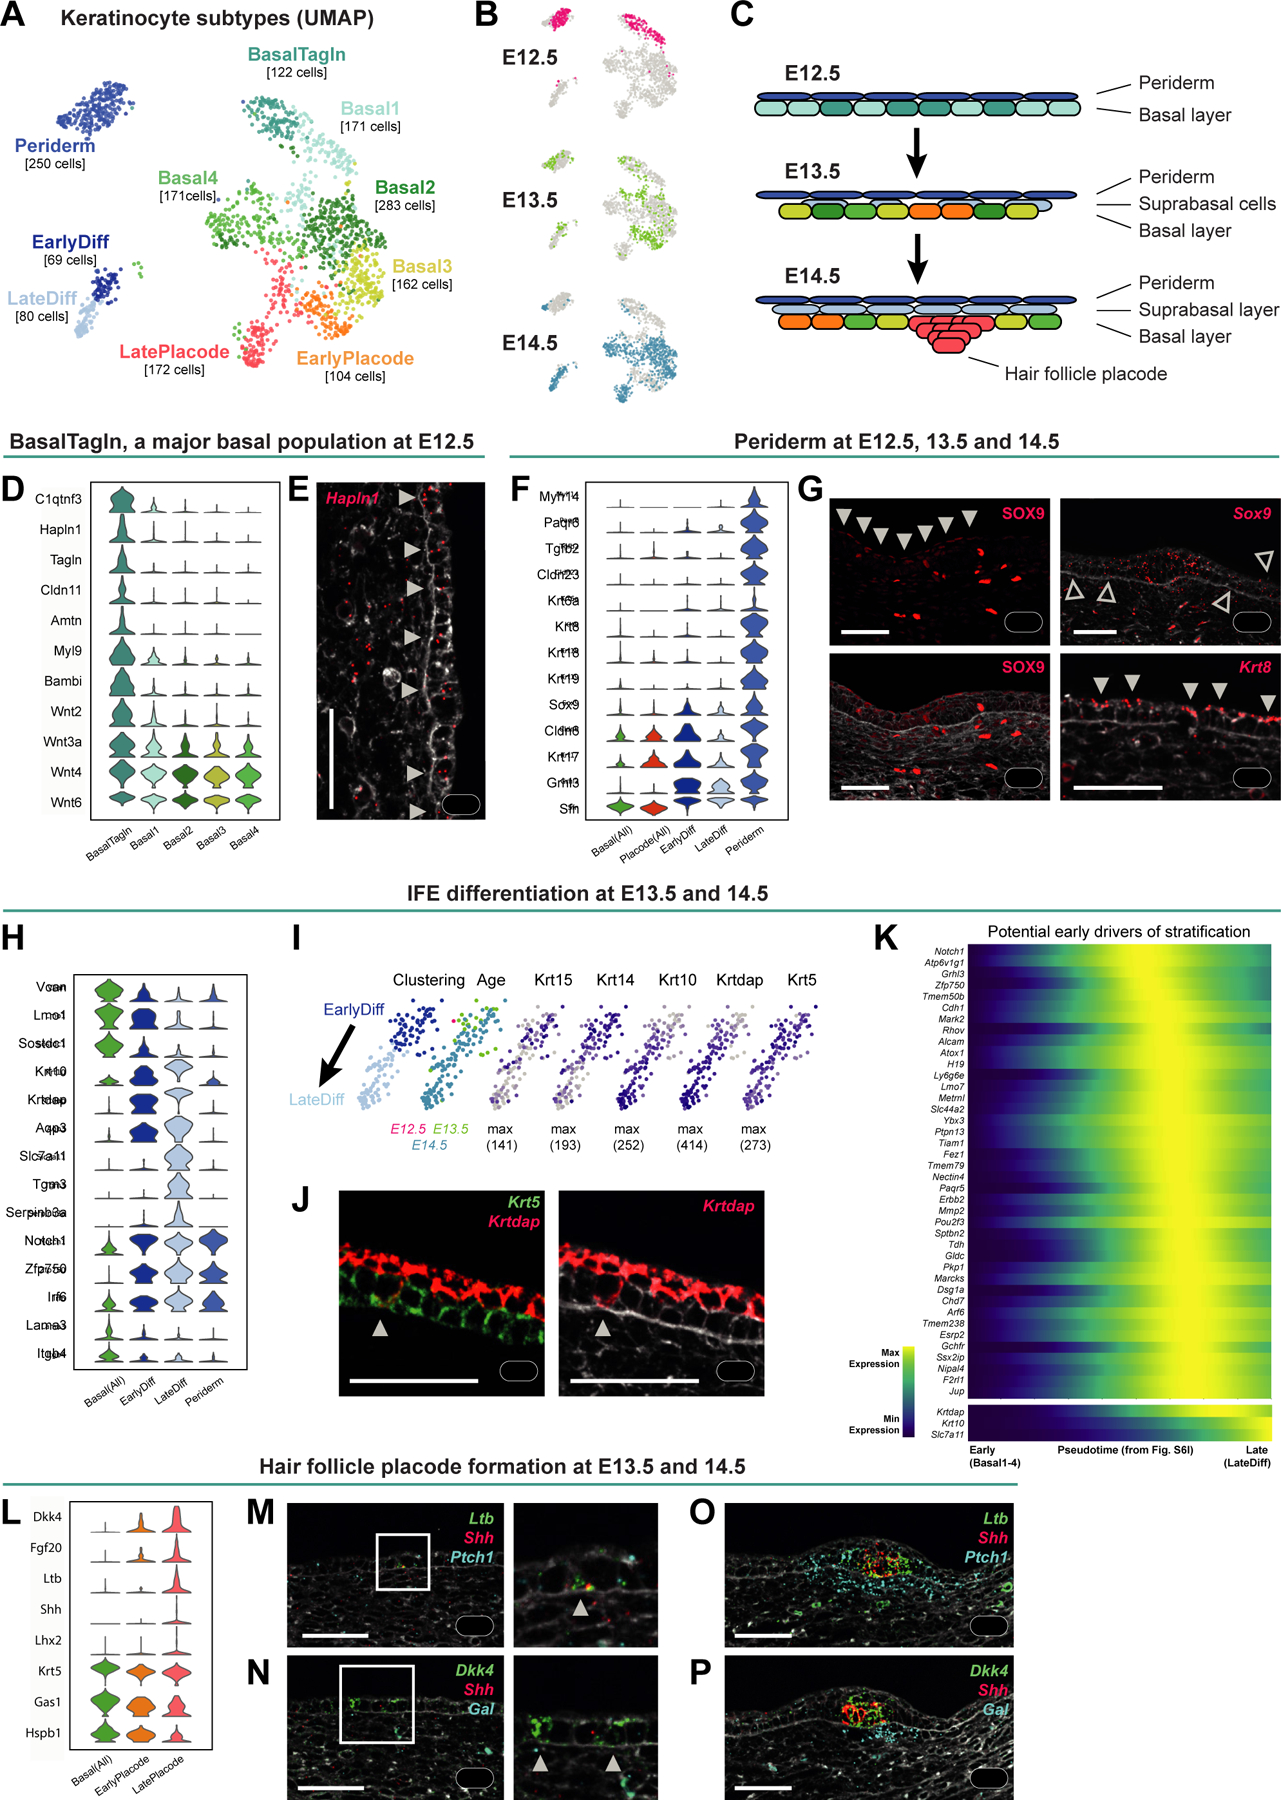
A wealth of specialized cell populations within the skin facilitates its hair-producing, protective, sensory, and thermoregulatory functions. How the vast cell-type diversity and tissue architecture develops is largely unexplored. Here, with single-cell transcriptomics, spatial cell-type assignment, and cell-lineage tracing, we deconstruct early embryonic mouse skin during the key transitions from seemingly uniform developmental precursor states to a multilayered, multilineage epithelium, and complex dermal identity. We identify the spatiotemporal emergence of hair-follicle-inducing, muscle-supportive, and fascia-forming fibroblasts. We also demonstrate the formation of the panniculus carnosus muscle (PCM), sprouting blood vessels without pericyte coverage, and the earliest residence of mast and dendritic immune cells in skin. Finally, we identify an unexpected epithelial heterogeneity within the early single-layered epidermis and a signaling-rich periderm layer. Overall, this cellular and molecular blueprint of early skin development-which can be explored at https://kasperlab.org/tools-establishes histological landmarks and highlights unprecedented dynamic interactions among skin cells.

Keywords: embryonic development; fibroblast lineage divergence; hair follicle; lineage tracing; molecular and anatomical landmarks; mouse skin; panniculus carnosus muscle; periderm; single-cell RNA sequencing; spatial analysis.


Conflict of interest statement

Declaration of interests The authors declare no competing interests.

Figures

Figure 1.
Figure 1.. Anatomy of embryonic skin from E12.5, E13.5, and E14.5
(A) UMAP visualization of all cells from the different embryonic ages (n = 11 280 cells of E12.5, 9 964 of E13.5, and 10 950 of E14.5). (B) UMAP visualization of first-level clustering of all cells (n = 32 194 cells). (C) Marker gene expression dot plot for main cell classes. (D-L) mRNA (italics) and protein (capital letters) stainings revealing the major anatomical landmarks of dorsal embryonic skin (sagital sections). Microscope images originate from larger tile scans (n = 3 mice). Scale bars, 500μm (D-F) and 100μm (G-L). * denotes erythrocyte autofluoresence (D-F) Muscle layers (ACTC1) with zoom ins to visualize anatomical layers using membraneous counterstain with WGA. M marks developing muscle layers. (G-I) Endothelial (Pecam1) and mural (Rgs5) cells. Arrowhead in (H) marks earliest evidence of mural cells at E13.5. Upper zoom in in (I) shows smaller vessel with discontinuous mural cell lining while lower zoom in in (I) shows larger vessel with continuous mural cell lining. (J) Immune cells (PTPRC) and epidermis (KRT5). Arrowheads highlight immune cells with dendritic phenotype. (K-L) Melanocytes (Sox10 + Pmel) and Schwann cells (Sox10). Arrowhead shows the arrival of melanocytes in the epidermis. (M-O) Schemes summarizing anatomical landmarks at E12.5, E13.5 and E14.5. See also Figure S1.
Figure 2.
Figure 2.. Deconstruction of fibroblast heterogeneity at E12.5 (expression and location)
(A) UMAP visualization of fibroblasts from the different embryonic ages (n = 10 008 cells of E12.5, 8 016 of E13.5, and 7 920 of E14.5). (B) Major fibroblast subtypes at E12.5 highlighted on UMAP. (C) Marker gene expression dot plot for major fibroblast groups. Highlighted are the clusters mostly present at E12.5. (D,F) Subclustering of early fibroblast groups (upper panels). Expression pattern of characteristic marker genes (lower panels). Number in brackets shows max number of RNA copies detected per cell (absolute abundance). (E,G,J) mRNA (italics) and protein (capitalized) stainings of fibroblast subpopulations. Dashed lines and arrows highlight the region with highest expression. Microscope images originate from larger tile scans (n = 3 mice). Scale bars, 100μm. (H) Marker gene expression of FIB Origin subpopulations on UMAP. (I) Absorption probabilities towards the differentiation endpoints projected onto UMAP (left panels) and quantified for each FIB Origin subpopulation (right panel). (K) Schemes summarizing major fibroblast groups at E12.5 and their location. See also Figure S2 and Tables S1 and S2.
Figure 3.
Figure 3.. Deconstruction of fibroblast heterogeneity at E13.5 and E14.5 (expression and location)
(A) UMAP with fibroblasts from different embryonic ages (as shown in Fig 2A). (B) UMAP showing major fibroblast subtypes at E13.5 and E14.5 together with their differentiation trajectories (velocity trends). (C) Marker gene expression dot plot for major fibroblast groups. Highlighted are clusters mostly present at E13.5 and E14.5. (D,F,I,K) Subclustering of major fibroblast groups (upper panels). Expression pattern of characteristic marker genes (lower panels). (E,G,J) mRNA (italics) and protein (capitalized) stainings highlighting fibroblast subpopulations. Dashed line with arrows highlights the region of highest expression. Bracket shows reduced Notum expression. M marks developing muscle layers. Microscope images originate from larger tile scans (n = 3 mice). Scale bars, 100μm. (L) Schemes summarizing major fibroblast groups at E14.5 and their location. Similar at E13.5, but PCM is not fully developed yet. See also Figure S3 and Tables S1 and S2.
Figure 4.
Figure 4.. Tracing the fate of Ebf2+ and Gata6+ fibroblasts
(A) FIB Muscle and FIB Inter fibroblasts highlighted on UMAP (left panel). Density plot showing the distribution of fibroblasts from the different embryonic ages on the UMAP (right panel). (B) UMAPs with FIB Inter subpopulations (left panel) and Gata6 expression (right panel). (C) Experimental setup for lineage tracing of Gata6+ cells. (D) Initial 2-day-tracing pattern of Gata6+ cells (left panel) and staining of the developing muscle layers (right panel). Dashed line marks Fascia/SWAT layer on the two consecutive sections. M marks developing muscle layers. Scale bars, 100μm. (E, F) Tracing pattern of Gata6+ cells at postnatal day 5 (P5; E) or P35 (F) and PLP1 protein staining of lipid droplets. Note the strong erythrocyte autofluorescence within DWAT at 561nm (E). Dotted lines indicate the PCM. Scale bars, 100μm. (G) UMAPs with FIB Muscle subpopulations (left panel) and Ebf2 expression (right panel). (H) Experimental setup for lineage tracing of Ebf2+ cells. (I) 2-day-tracing pattern of Ebf2+ cells (left panel) and staining of the developing muscle layers (right panel). Dotted lines indicate the PCM, underlying back muscle layers (M), as well as deep-tissue interstitial space on the two consecutive sections. Scale bars, 100μm. (D-F, I) Microscope images originate from larger tile scans (n = 3 mice).
Figure 5.
Figure 5.. Developing muscle layers in embryonic skin
(A) UMAP (from Figure 1B) with subpopulations of muscle cells (left panel), violin plot of marker gene expression (center panel), and contribution of each embryonic time point to subpopulations (right panel). (B) mRNA (italics) and protein (capitalized) stainings highlighting developing muscle layers. Microscope images originate from larger tile scans (n = 3 mice). Scale bars, 100μm (panorama, blue zoom-in) and 25μm (yellow zoom-in). Asterisks: indicate a discontiunous upper back muscle layer (dependent on histological cut and distance to dorsal midline). (C) Scheme of panniculus carnosus muscle (PCM) formation. (D) Circle plot visualizing number of interactions between FIB Inter, FIB Muscle, and MUSCLE subpopulations. Edge width proportional to the number of interactions. Edges colored according to sending cell population. (E) Dot plot showing outgoing and incoming signaling patterns between FIB Inter, FIB Muscle, and MUSCLE subpopulations (left panels). Dot size proportional to enrichment of signaling pathway in the cell population. Circle plots for selected signaling pathways with significant interactions (right panels). See also Figure S4 and Tables S1, S2 and S3.
Figure 6.
Figure 6.. Vessel, immune and neural-crest (NC)-derived subtypes and signaling interactions for their respective establishment in embryonic skin
(A) UMAP (from Figure 1B) with subpopulations of vessel-associated cells, immune cells, and neural crestderived cells. (B) Contribution of each embryonic time point to subpopulations. (C) Violin plots of marker gene expression. (D) Dot plot showing enrichment of signaling pathways received by vessel-associated, immune, and/or NC-derived cells. See also Figures S4 and S5 and Tables S1, S2 and S3.
Figure 7.
Figure 7.. Epidermal development from a single basal layer towards a HF-inducing and stratified epithelium
(A-B) UMAP visualization of all keratinocyte subclusters (A) and their embryonic ages (B; n = 360 cells of E12.5, 347 of E13.5, and 877 of E14.5). (C) Scheme summarizing epidermis development in the analyzed time window, with cell colored according to the cluster colors in (A). (D) Violin plot of EPI BasalTagln marker gene expression. (E) Hapln1 mRNA staining revealing expression in basal IFE (arrowheads). (F) Violin plots of periderm marker gene expression. (G) SOX9 protein staining (left panels); expression in periderm (filled arrowheads) and hair placode cells (asterisks). Sox9 mRNA staining (upper right); expression in cells within and outside of hair placode (asterisk and empty arrowheads, respectively). Krt8 mRNA staining; expression in periderm cells (filled arrowheads). (H) Violin plot of differentiation marker gene expression. (I) UMAPs of differentiating keratinocytes (EPI EarlyDiff and EPI LateDiff from A) colored according to subclustering and embryonic age (left two panels) or expression of basal and suprabasal marker genes (right panels). (J) Krt5 and Krtdap mRNA staining reveals a representative basal cell with a differentiation signature (arrowhead). (K) Heatmap of potential early drivers of stratification along the pseudotime from EPI Basal1–4 to EPI EarlyDiff and EPI LateDiff cells from E14.5 (Figure S6I). Krtdap, Krt10, and Slc7a11 are plotted for comparison. (L) Violin plot of hair placode marker gene expression. (M-P) Ltb, Shh and Ptch1 (M, O) or Dkk4, Shh, and Gal (N, P) mRNA staining at E13.5 (M, N) and E14.5 (O, P), showing early placode cells (M-N; arrowheads) and mature hair placodes (marked by Ltb, Shh, and Dkk4) as well as dermal condensates (marked by Ptch1 and Gal). (E, G, J, M-P) Images originate from larger tile scans (n = 3 mice). Scale bars: 50μm. See also Figures S6 and S7 and Tables S1 and S2.

References

    1. De Falco M, Pisano MM, and De Luca A (2014). Embryology and Anatomy of the Skin. In Current Clinical Pathology. Skin cancer, Baldi A, ed. (Springer Science+Business Media; ), pp. 1–15. 10.1007/978-1-4614-7357-2. - DOI
    1. Biggs LC, and Mikkola ML (2014). Early inductive events in ectodermal appendage morphogenesis. Semin. Cell Dev. Biol 25–26, 11–21. 10.1016/j.semcdb.2014.01.007. - DOI - PubMed
    1. Sennett R, and Rendl M (2012). Mesenchymal-epithelial interactions during hair follicle morphogenesis and cycling. Semin. Cell Dev. Biol 23, 917–927. 10.1016/j.semcdb.2012.08.011. - DOI - PMC - PubMed
    1. Saxena N, Mok KW, and Rendl M (2019). An updated classification of hair follicle morphogenesis. Exp. Dermatol 28, 332–344. 10.1111/exd.13913. - DOI - PMC - PubMed
    1. Schmidt-Ullrich R, and Paus R (2005). Molecular principles of hair follicle induction and morphogenesis. BioEssays 27, 247–261. 10.1002/bies.20184. - DOI - PubMed

Publication types

LinkOut - more resources