. 2023 Aug 17;6(11):e202302058.
doi: 10.26508/lsa.202302058. Print 2023 Nov.

A novel antifolate suppresses growth of FPGS-deficient cells and overcomes methotrexate resistance

Affiliations

A novel antifolate suppresses growth of FPGS-deficient cells and overcomes methotrexate resistance

Felix van der Krift et al. Life Sci Alliance. .

Abstract

Cancer cells make extensive use of the folate cycle to sustain increased anabolic metabolism. Multiple chemotherapeutic drugs interfere with the folate cycle, including methotrexate and 5-fluorouracil that are commonly applied for the treatment of leukemia and colorectal cancer (CRC), respectively. Despite high success rates, therapy-induced resistance causes relapse at later disease stages. Depletion of folylpolyglutamate synthetase (FPGS), which normally promotes intracellular accumulation and activity of natural folates and methotrexate, is linked to methotrexate and 5-fluorouracil resistance and its association with relapse illustrates the need for improved intervention strategies. Here, we describe a novel antifolate (C1) that, like methotrexate, potently inhibits dihydrofolate reductase and downstream one-carbon metabolism. Contrary to methotrexate, C1 displays optimal efficacy in FPGS-deficient contexts, due to decreased competition with intracellular folates for interaction with dihydrofolate reductase. We show that FPGS-deficient patient-derived CRC organoids display enhanced sensitivity to C1, whereas FPGS-high CRC organoids are more sensitive to methotrexate. Our results argue that polyglutamylation-independent antifolates can be applied to exert selective pressure on FPGS-deficient cells during chemotherapy, using a vulnerability created by polyglutamylation deficiency.


Conflict of interest statement

MM Maurice is an inventor on patents related to membrane protein degradation; she is co-founder and shareholder of Laigo Bio.

Figures
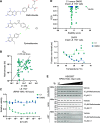
Figure 1.
Figure 1.. Identification of compound C1 as a novel DHFR ligand.
(A) Structures of methotrexate, pyrimethamine, and C1, a novel 2,4-diaminopyrimidine antifolate. (B) Comparison of C1 and methotrexate IC50 values for a panel of cancer cell lines. Methotrexate IC50 values were retrieved from the Genomics of Drug Sensitivity in Cancer database and determined using a Syto60 viability assay after 72 h treatment. C1 IC50 values were determined using a sulforhodamine B viability assay after 72 h treatment. (C) CellTiter-Glo viability assay on C1- or vehicle-treated LS 174T cells after 48 h treatment. Data were collected for n = 2 biological replicates. (D) Top panel: thermal proteome profile of intact LS 174T cells treated with 10 μM C1 for 1 h, including stability score and false discovery rate of all hits and candidates. Negative stability scores represent proteins that are destabilized by C1 treatment, and positive stability scores represent proteins that are stabilized by C1 treatment. Bottom panel: melting curve for DHFR in 10 μM C1- or DMSO-treated intact LS 174T cells. (E) Western blot analysis of a representative cellular thermal shift assay on intact HEK293T cells overexpressing HA–DHFR treated with 10 μM methotrexate or C1 for 1 h.
Figure S1.
Figure S1.. C1 is a poor kinase inhibitor at 100 nM, related to Fig 1.
Kinome-wide screening for in vitro kinase inhibition by 100 nM C1 treatment, using Adapta, Z'LYTE, and LanthaScreen binding assays (see the Materials and Methods section). Data are mean and s.d., collected at 484 datapoints with n = 2 technical replicates. Data were visualized with Coral (Metz et al, 2018).
Figure 2.
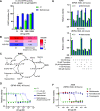
Figure 2.. C1 and methotrexate inhibit DHFR and folate-mediated one-carbon metabolism.
(A) In vitro inhibition of hDHFR activity by C1 and methotrexate, at 50 μM dihydrofolate and 60 μM NADPH. Data are shown as mean ± s.d. and were collected in n = 2 technical replicates. Results are representative of three independent experiments. (B) Thermal proteome profiling analysis of one-carbon metabolism–related proteins in cells treated with C1 or methotrexate, including Z-score transformed stability scores. Positive Z-scores represent stabilized proteins, negative Z-scores represent destabilized proteins. The thermal proteome profile for C1 was determined at 10 μM in LS 174T cells (Fig 1D). The thermal proteome profile for methotrexate was retrieved from Huber et al (2015) and determined at 10 μM in K562 cells. (C) Simplified schematic representation of tetrahydrofolate (THF)-mediated one-carbon transfer reactions involved in purine and thymidine synthesis. Rescue interventions are indicated with dashed lines. Abbreviations: 5,10-methylene-tetrahydrofolate (5,10-CH2-THF), formate (CHO), 10-formyl-tetrahydrofolate (10-CHO-THF), 5-formyl-tetrahydrofolate (5-CHO-THF), glycine cleavage system (GCS). (D) CellTiter-Glo viability analysis of C1- or methotrexate-treated A549 cells after 48 h treatment, in the absence or presence of 25 μM 5-formyl-tetrahydrofolate. Data were collected in n = 2 biological replicates. (E) CellTiter-Glo viability analysis of C1- or methotrexate-treated A549 or HCT-116 cells after 24 h treatment, including rescue treatments with one-carbon cycle metabolites. Data were collected in n = 2 biological replicates. (F) CellTiter-Glo viability analysis of C1-, methotrexate-, pyrimethamine-, or trimethoprim-treated A549 cells after 48 h treatment. Data were collected in n = 2 biological replicates.
Figure S2.
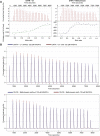
Figure S2.. Thermograms of isothermal titration calorimetry experiments, related to Table 1.
(A) Representative thermograms demonstrating binding of DHFR to C1 and methotrexate. (B) Representative thermograms demonstrating that binding of DHFR to C1 and methotrexate is not altered in the presence of 125 μM NADPH.
Figure S3.
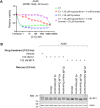
Figure S3.. C1 inhibits the folate cycle and modulates purine sensing by mTORC1, similar to methotrexate, related to Fig 2.
(A) Viability measurement of C1-treated A549 cells after 48 h treatment, including effects of treatments with indicated products of folate-mediated one-carbon metabolism. Data were collected in n = 2 biological replicates. (B) Western blot analysis of the mTORC1 substrate 4E-BP1 in A549 cells after 15.5 h 100 nM C1- or 100 nM methotrexate (MTX) treatment, including 2.5 h rescue treatments with purines. Rescue treatments consisted of 40 μM adenosine, 40 μM guanosine, or a combination of 20 μM adenosine and 20 μM guanosine. Reduced mTORC1 activity leads to reduced 4E-BP1 phosphorylation, which is visualized as a mobility shift to a faster-migrating form.
Figure 3.
Figure 3.. DHFR-binding modes of C1 and methotrexate are predicted to be partially overlapping.
(A, B, C, D, E, F) Surface representation of (A) crystal structure of hDHFR in complex with NADPH, (B) crystal structure of hDHFR in complex with NADP+ and folic acid (FOL), (C) crystal structure of hDHFR in complex NADP+ and 5,10-dideaza-THF (5,10THF), (D) crystal structure of hDHFR in complex with NADPH and methotrexate (MTX), (E) docking pose of C1 on hDHFR (PDB accession 4M6J), and (F) docking pose of C1 on hDHFR (PDB accession 5HPB). Residues involved in opening and closing of the active site are highlighted in green and were adopted from Bhabha et al (2013). (G, H, I, J) Active site crystal structures of the (G, H) hDHFR–NADPH (cyan), hDHFR–NADPH–folic acid (yellow), hDHFR–NADP+–5,10-dideaza–THF (magenta), and (I, J) hDHFR–NADPH–methotrexate complexes. (K, L) Docking poses of the hDHFR–NADPH–C1 complexes (orange is PDB accession 4KBN, purple is PDB accession 5HPB).
Figure S4.
Figure S4.. C1 is lipophilic at pH 2.5–7.4, related to Fig 1.
Partition coefficient (Log D) for C1, determined in octanol and water at various aqueous phase pH values. Data are mean ± s.d. and were collected in n = 4 or n = 2 technical replicates.
Figure S5.
Figure S5.. High FPGS expression correlates with resistance to C1, but sensitivity to methotrexate, related to Fig 4.
(A) Spearman correlation coefficient and P-value between expression of genes involved in folate polyglutamylation and sensitivity to methotrexate or C1 in a panel of cancer cell lines. Generation of C1 and methotrexate IC50 values is described in Fig 1B. (B) Spearman correlation coefficient and P-value between the expression of a selection of genes involved in folate polyglutamylation and sensitivity to pyrimethamine or methotrexate for all entries in the Genomics of Drug Sensitivity in Cancer database. Gene expression data were retrieved from the Cancer Cell Line Encyclopedia (Ghandi et al, 2019).
Figure 4.
Figure 4.. C1 potently forms a complex with DHFR in cells.
Drug-induced HA–DHFR stabilization in cellular thermal shift assays on intact HEK293T cells overexpressing HA–DHFR and mTurquoise2 (negative control) or FPGS–FLAG. Cells were incubated with a drug concentration range for 4 h followed by a cellular thermal shift assay at 52°C. Data are average Z-scores and were collected in n = 2 biological replicates. Original Western blots are shown in Fig S6C.
Figure S6.
Figure S6.. Sensitivity of HEK293T cells to antifolates is not affected by FPGS overexpression, related to Fig 4.
(A) Normalized FPGS protein abundance in U2OS, HEK293T, HCT-116, and RPE-1 cells, analyzed by mass spectrometry (adapted from Li et al [2021]). (B) Representative Western blot analysis of overexpressed HA–DHFR and FPGS–FLAG in HEK293T cells used for cellular thermal shift assays in Fig 4. (C) Western blot analyses of cellular thermal shift assays on intact HEK293T cells overexpressing HA–DHFR and mTurquoise2 (negative control) or FPGS–FLAG. Cells were incubated with a drug concentration range for 4 h followed by a cellular thermal shift assay at 52.0°C. HA–DHFR intensity was quantified using actin as loading control and normalized by Z-score transformation, indicated below each panel. Original data of Fig 4.
Figure S7.
Figure S7.. Patient 6–derived colorectal cancer (P6T) organoids are FPGS-deficient, related to Fig 5.
(A) Original FPGS mRNA expression in the patient-derived colon organoid biobank containing P6T, P26T, and P26N organoids used in this study (adapted from Van de Wetering et al [2015]). Data are Z-score transformed mean mRNA expression. Cells with missing values are colored gray. (B) RT-qPCR analysis of FPGS and GGH gene expression in P26N normal colon organoids and P6T colorectal cancer organoids. Data were collected in n = 2 biological replicates.
Figure S8.
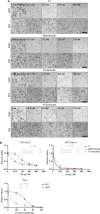
Figure S8.. P6T organoids display increased sensitivity to C1, but not trimetrexate, related to Fig 5.
(A) Brightfield images of P6T and P26T organoids after 7 d of drug treatment. Scalebar represents 250 μm. (B) CellTiter-Glo viability analysis of drug-treated P6T and P26T cells after 7 d treatment. Data were collected in n = 2 biological replicates.
Figure S9.
Figure S9.. Doxycycline-induced overexpression of FPGS and GGH in P6T organoids, related to Fig 5.
(A) Representative confocal (immuno)fluorescence images of P6T organoids overexpressing FPGS–FLAG IRES–mNeonGreen or GGH–FLAG IRES–mCherry in a doxycycline-dependent manner. Organoids were treated with 1 μg/ml doxycycline and stained with anti-FLAG to detect overexpressed proteins, anti-TOM20 to stain mitochondria, anti-LAMP1 to stain lysosomes and DAPI to stain nuclei. Scalebar represents 25 μm. (B) Western blot analysis of FPGS expression in P6T organoids overexpressing EV (negative control), FPGS–FLAG, or GGH–FLAG. Organoids were treated with 1 μg/ml doxycycline to induce expression.
Figure 5.
Figure 5.. FPGS deficiency causes methotrexate resistance, but creates a vulnerability to C1.
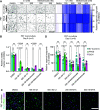
(A) Representative widefield fluorescence images of P6T organoids overexpressing doxycycline-inducible constructs with a fluorescent reporter after 8 d of drug treatment. Overexpression of empty vector IRES–TagBFP (EV), FPGS–FLAG IRES–mNeonGreen (FPGS), or GGH–FLAG IRES–mCherry (GGH) was combined with various drug treatments for 8 d. Organoids were treated with DMSO (vehicle control), 100 or 500 nM C1 and 200 or 500 nM methotrexate. Relative organoid outgrowth is measured as % surface area of DMSO. Images are Z-stack projections of deconvoluted widefield images. Scalebar represents 500 μm. Data were collected in n = 2 independent experiments with biological duplicates. (B) CellTiter-Glo viability analysis of P6T organoids overexpressing empty vector, FPGS, or GGH after 8 d of drug treatment. Data were collected in n = 2 independent experiments with biological duplicates. Viability of FPGS- and GGH-overexpressing organoids was compared with empty vector–overexpressing organoids using two-way ANOVA with Dunnett’s multiple comparisons test. (C) Representative widefield fluorescence images of co-cultured P6T organoids overexpressing EV (cyan), FPGS (green), or GGH (magenta) after 8 d of C1 or methotrexate (MTX) treatment. Overexpression was combined with various drug treatments for 8 d. Images are Z-stack projections of deconvoluted widefield images. Scalebar represents 500 μm. Data were collected in n = 2 independent experiments with biological quadruplicates. (D) Quantification of fluorescence surface area in widefield images of co-cultured P6T organoids overexpressing EV (cyan), FPGS (green), or GGH (magenta) after 8 d of drug treatment. Analysis was performed on Z-stack projections of deconvoluted widefield images. Relative surface area of FPGS- and GGH-overexpressing organoids was compared with empty vector-overexpressing organoids using two-way ANOVA with Dunnett’s multiple comparisons test. Data were collected in n = 2 independent experiments with biological quadruplicates.

References

    1. Algul O, Paulsen JL, Anderson AC (2011) 2, 4-Diamino-5-(2′-arylpropargyl) pyrimidine derivatives as new nonclassical antifolates for human dihydrofolate reductase inhibition. J Mol graphics Model 29: 608–613. 10.1016/j.jmgm.2010.11.004 - DOI - PMC - PubMed
    1. Andrés A, Rosés M, Ràfols C, Bosch E, Espinosa S, Segarra V, Huerta JM (2015) Setup and validation of shake-flask procedures for the determination of partition coefficients (log D) from low drug amounts. Eur J Pharm Sci official J Eur Fed Pharm Sci 76: 181–191. 10.1016/j.ejps.2015.05.008 - DOI - PubMed
    1. Bailey LB, Stover PJ, McNulty H, Fenech MF, Gregory JF III, Mills JL, Pfeiffer CM, Fazili Z, Zhang M, Ueland PM, et al. (2015) Biomarkers of nutrition for development—folate review. J Nutr 145: 1636S–1680S. 10.3945/jn.114.206599 - DOI - PMC - PubMed
    1. Becher I, Werner T, Doce C, Zaal EA, Tögel I, Khan CA, Rueger A, Muelbaier M, Salzer E, Berkers CR, et al. (2016) Thermal profiling reveals phenylalanine hydroxylase as an off-target of panobinostat. Nat Chem Biol 12: 908–910. 10.1038/nchembio.2185 - DOI - PubMed
    1. Becher I, Andrés-Pons A, Romanov N, Stein F, Schramm M, Baudin F, Helm D, Kurzawa N, Mateus A, Mackmull MT, et al. (2018) Pervasive protein thermal stability variation during the cell cycle. Cell 173: 1495–1507.e18. 10.1016/j.cell.2018.03.053 - DOI - PMC - PubMed

Publication types

MeSH terms

LinkOut - more resources