. 2023 Sep 6;43(36):6280-6296.
doi: 10.1523/JNEUROSCI.0704-23.2023. Epub 2023 Aug 17.

Paraventricular Thalamic MC3R Circuits Link Energy Homeostasis with Anxiety-Related Behavior

Affiliations

Paraventricular Thalamic MC3R Circuits Link Energy Homeostasis with Anxiety-Related Behavior

Dajin Cho et al. J Neurosci. .

Abstract

The hypothalamic melanocortin system is critically involved in sensing stored energy and communicating this information throughout the brain, including to brain regions controlling motivation and emotion. This system consists of first-order agouti-related peptide (AgRP) and pro-opiomelanocortin (POMC) neurons located in the hypothalamic arcuate nucleus and downstream neurons containing the melanocortin-3 (MC3R) and melanocortin-4 receptor (MC4R). Although extensive work has characterized the function of downstream MC4R neurons, the identity and function of MC3R-containing neurons are poorly understood. Here, we used neuroanatomical and circuit manipulation approaches in mice to identify a novel pathway linking hypothalamic melanocortin neurons to melanocortin-3 receptor neurons located in the paraventricular thalamus (PVT) in male and female mice. MC3R neurons in PVT are innervated by hypothalamic AgRP and POMC neurons and are activated by anorexigenic and aversive stimuli. Consistently, chemogenetic activation of PVT MC3R neurons increases anxiety-related behavior and reduces feeding in hungry mice, whereas inhibition of PVT MC3R neurons reduces anxiety-related behavior. These studies position PVT MC3R neurons as important cellular substrates linking energy status with neural circuitry regulating anxiety-related behavior and represent a promising potential target for diseases at the intersection of metabolism and anxiety-related behavior such as anorexia nervosa.SIGNIFICANCE STATEMENT Animals must constantly adapt their behavior to changing internal and external challenges, and impairments in appropriately responding to these challenges are a hallmark of many neuropsychiatric disorders. Here, we demonstrate that paraventricular thalamic neurons containing the melanocortin-3 receptor respond to energy-state-related information and external challenges to regulate anxiety-related behavior in mice. Thus, these neurons represent a potential target for understanding the neurobiology of disorders at the intersection of metabolism and psychiatry such as anorexia nervosa.

Keywords: MC3R; anxiety; feeding behavior; melanocortins; paraventricular thalamus.


Figures

Figure 1.
Figure 1.
PVT MC3R neurons are functionally downstream of arcuate AgRP and POMC neurons. A–C, Representative images from transgenic MC3R-cre x tdtomato mouse displaying MC3R distribution along the anterior to posterior axis of the PVT. D, Image of the medial basal hypothalamus (MBH) from the same MC3R-tdotmato mouse. EG, Representative images from MC4R-cre x tdtomato mice showing lack of MC4R-expressing cells along the anterior to posterior axis of PVT. H, Image of the MBH from the same MC4R-tdtomato mouse verifying the validity of this mouse line for labeling MC4R-containing cells. I, Immunohistochemistry for AgRP in MC3R-Cre x tdtomato transgenic mice. J, Immunohistochemistry for POMC in MC3R-Cre x tdtomato mice. Immunopositive fibers for AgRP and POMC overlap extensively with MC3R cells in PVT. Scale bars: A–H, C (left), 100 um; I, J (left), 100 um; I, J (right), 10 um.
Figure 2.
Figure 2.
PVT MC3R neurons are glutamatergic and project to NAc, BST, and AMG. A, Representative images of MC3R (green) and vGLUT2 (red) mRNA using RNA in situ hybridization in PVT. B, Representative images of MC3R (green) and vGAT (red) mRNA using RNA in situ hybridization in PVT. C, Viral expression of Cre-dependent virus expressing mCherry in PVT MC3R neurons. D–F, Representative images showing projections from PVT MC3R neurons to downstream regions including NAc (D), BST (E), and AMG (F). Scale bars: A, B (left), 100 um, (right) 10 um; C–F, 100 um. PVT images in A and B taken from mid-/posterior PVT (bregma, −1.2). Bottom row indicates a schematic of the neuroanatomical location shown in C–F. NAc (nucleus accumbens), BST (bed nucleus of the stria terminalis), AMG (amygdala).
Figure 3.
Figure 3.
PVT MC3R neurons are activated by refeeding and melanocortin agonist treatment. A, B, Colocalization of c-fos protein in PVT MC3R neurons (MC3R-Cre x tdtomato transgenic mice) in the fed ad libitum state (A) or following 1 h of refeeding after an 18 h fast (B). C, Quantification of the percentage of total PVT MC3R cells colabeled with the c-fos protein in the fed (n = 4 mice) and refed (n = 5 mice) state. Significantly more PVT MC3R cells colocalized for c-fos in the refed versus the fed state (Student's unpaired t test, t(7) = 4.12, p = 0.004). D, E, Percentage of PVT MC3R cells containing c-fos in the anterior PVT (D; t(6) = 1.884, p = 0.108) and posterior PVT (E; t(6) = 6.740, p = 0.0005) in ad libitum fed mice and mice refed for 1 h following fasting. F, Total number of c-fos-positive cells in the anterior portions of PVT (bregma −0.3 to −1.0) in mice fed ad libitum and mice refed for 1 h following fasting (t(6) = 1.009, p = 0.35). G, Total number of c-fos-positive cells in the posterior portions of PVT (bregma −1.1 to −2.0) in mice fed ad libitum and mice refed for 1 h following fasting (t(7) = 2.17, p = 0.067). H, I, Representative images showing the colocalization of c-fos in PVT MC3R neurons following intraperitoneal injections of saline or setmelanotide. J, Quantification of the number of MC3R cells colabeled with c-fos protein in PVT following injections of saline (n = 4) or the melanocortin agonist setmelantoide (n = 4 mice, 5 mg/kg, i.p.). Significantly more MC3R cells were colabeled with c-fos protein following setmleanotide injections relative to control saline injections (Student's unpaired t test, t(6) = 3.01, p = 0.02). Arrows in A, B, H, and I indicate colabeled cells. All data analyzed with unpaired Student's t test). ns, Not significant; *p < 0.05, **p < 0.01, ***p < 0.001. Individual data points in C–G and J indicate individual mice. Scale bars: 100 um.
Figure 4.
Figure 4.
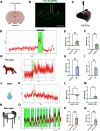
PVT MC3R neurons are activated by anxiogenic and aversive stimuli. A, Viral injection strategy for expressing the genetically encoded calcium indicator GCAMP8 in PVT MC3R neurons. B, Representative image of GCAMP8s expression in PVT MC3R neurons with a fiber optic cannula inserted into the PVT. Cannula trace marked in white. C, Schematic depicting in vivo fiber photometry calcium imaging of PVT MC3R neuronal activity in awake, behaving mice. D, Schematic of approach used for restraint stress experiments and representative trace of calcium activity (Z-scored) during restraint stress. Restraint period highlighted in green. E, F, Mean change in calcium activity during restraint versus before restraint (E; t(9) = 4.3, p = 0.002, n = 10 mice), and maximum calcium activity (F; t(9) = 4.03, p = 0.003, n = 10 mice) during restraint versus before restraint. G, Schematic of approach used for TMT imaging experiments and representative trace of calcium activity in PVT MC3R neurons on introduction of the predator odor TMT. H, I, Mean change in calcium activity (H; t(5) = 5.13, p = 0.004, n = 6 mice) and maximum calcium activity (I; t(5) = 4.77, p = 0.005, n = 6 mice) before and after TMT exposure. J, K, Representative trace of calcium activity following the presentation of water, presented in an identical manner as TMT exposure experiments. L, M, Mean change in calcium activity (L; t(5) = 0.76, p = 0.48, n = 6 mice) and maximum calcium activity (M; t(5) = 1.16, p = 0.30, n = 6 mice) after water exposure (relative to before water exposure). N, O, Representative trace of calcium activity during elevated zero maze test. Time in the open arms is highlighted in green. P, Q, Mean change in calcium activity in the open arms versus closed arms (P; t(7) = 6.82, p = 0.0002, n = 8 mice) and maximum calcium activity in the open arms versus the closed arms (Q; t(7) = 5.46, p = 0.0009, n = 8 mice). Data analyzed by paired Student's t test; **p < 0.01, ***p < 0.001). ns, Not significant). Data points represent individual mice. Introduction of the stimulus is highlighted in green for G and J. Scale bar, B, 200 um.
Figure 5.
Figure 5.
Activation of PVT MC3R neurons reduces feeding. A, Representative image showing the DREADD activator hM3Dq-mCherry expression in PVT MC3R neurons. B, C, Images showing colabeling of c-fos immunohistochemistry with hM3Dq-mCherry virus in saline-injected mice (B) or mice injected with CNO (C). D, Quantification of the percentage of MC3R-mCherry cells expressing c-fos in PVT following intraperitoneal injections of saline or CNO (n = 4 mice for saline group and n = 3 mice for CNO group; unpaired Student's t test, t(4) = 2.95, p = 0.04). E, Dark period food intake (2 h food intake) of male (n = 9) and female (n = 5) hM3Dq mice that were injected with saline or CNO (0.3 mg/kg, i.p.). There was no interaction between sex and food intake (2-way ANOVA, F(1,24) = 1.787, p value = 0.1939) but a significant main effect of chemogenetic activation (2-way ANOVA, F(1,24) = 18.40, p value = 0.0003) on food intake. F, Two-hour food intake following intraperitoneal injection of CNO (0.3 mg/kg; n = 6 mice) or saline (n = 6 mice) in mice targeted with the DREADD activator hM3Dq in PVT MC3R neurons (Student's unpaired t test, t(10) = 3.12, p = 0.01) following an overnight fast. G, Two-hour food intake in MC3R-cre mice containing DIO-mCherry in PVT that were injected with saline or CNO (n = 10 male mice). No difference was detected between saline- and CNO-injected mice (t(9) = 0.38, p = 0.72); *p < 0.05, ***p < 0.001. Individual data points indicate individual mice. Scale bars: 200 um.
Figure 6.
Figure 6.
Activation of PVT MC3R neurons increases anxiety-related behavior. A, Latency to feed during novelty-suppressed feeding tests in control mCherry (n = 28 mice) and hM3D mice (n = 20 mice) injected with CNO (0.3 mg/kg; Mann–Whitney test, two-tailed p value, 0.0115, Mann–Whitney U = 160); this figure includes mCherry and hM3D mice from cohorts 1 and 2 combined. B, C, Distance traveled in the open arms (B; Mann–Whitney test, two-tailed p value = 0.0040, Mann–Whitney U = 48) and time in the open arms (C; Student's unpaired t test, t(29) = 3.03, p = 0.005) during the elevated zero maze test. Activation of PVT MC3R neurons decreased both distance traveled in the open arms (B) and time in the open arms (C) relative to control mCherry-injected mice (n = 17 mice in mCherry group and n = 14 mice in hM3Dq group). D, Total distance traveled (in meters) for mCherry (n = 17 mice) and hM3Dq (n = 14 mice) mice. No statistically significant difference was observed in the total distance traveled between mCherry and hM3Dq mice following CNO administration (unpaired Students t test, t(29) = 1.75, p = 0.09). E, Time spent in the open arms during the elevated zero maze in mCherry male (n = 9 mice), mCherry female (n = 8), hM3Dq male (n = 9), and hM3Dq female (n = 5) mice. There is an interaction between sex and time in the open arms, with male mice, and not females, exhibiting a significant reduction in time in the open arms following activation of PVT MC3R neurons (2-way ANOVA, F(1,27) = 6.566, p value = 0.0163). F, Percentage of distance traveled in the open arms in mCherry male (n = 9 mice), mCherry female (n = 8), hM3Dq male (n = 9), and hM3Dq female (n = 5) mice (no significant interaction between sex and distance in open arms, 2-way ANOVA, F(1,27) = 2.537, p value = 0.1228; main effect of hM3Dq activation, F(1,27) = 9.4, p value = 0.0049). Activation of PVT MC3R neurons reduced distance traveled in the open arms in male, but not female, mice; *p < 0.05, **p < 0.01. Individual data points indicate individual mice.
Figure 7.
Figure 7.
Inhibition of PVT MC3R neurons decreases anxiety-related behavior. A, Representative image showing the DREADD inhibitor hM4Di-mCherry expression in PVT MC3R neurons. B, C, Representative image showing colabeling of c-fos immunohistochemistry with hm4di-mCherry viral expression in saline-injected mice (B) or CNO-injected mice (C). D, Quantification of the percentage of PVT MC3R neurons activated by c-fos in hM4Di-mCherry-expressing mice following injections of saline or CNO (n = 5 mice for both saline- and CNO-injected groups, Student's unpaired t test, t(8) = 3.34, p = 0.01). E, Two-hour food intake following intraperitoneal injection of CNO (0.3 mg/kg) or saline in mice targeted with the DREADD inhibitor hM4Di in PVT MC3R neurons (n = 7 mice; Student's unpaired t test, t(6) = 0.02, p = 0.78). F, Two-hour dark period food intake in control mCherry-expressing mice following injections of saline or CNO (0.3 mg/kg, i.p.). No difference in food intake was detected between saline- and CNO-injected mice (n = 7 mice, Student's paired t test, t(6) = 1.14, p = 0.30). G, H, Number of entries to the open arms (G) and time in the open arms (H) during the elevated zero maze. Inhibition of PVT MC3R neurons in hM4Di-injected mice increased the number of entries compared with mCherry mice (n = 12 mice in mCherry group and n = 7 mice in hM4Di group, Students unpaired t test, t(16) = 2.59, p = 0.019) and trended toward increasing the time spent in the open arms (n = 12 mice in mCherry group and n = 7 mice in hM4Di group, Student's unpaired t test, t(17) = 2.02, p = 0.059). I, Distance traveled in the center of the open field arena in mCherry- or hM4Di targeted mice during open field tests. Inhibition of PVT MC3R neurons increased the distance traveled in the center of the open field arena compared with mCherry control injected mice (n = 10 mice in hM4Di group and n = 14 mice in mCherry group, Student's unpaired t test, t(22) = 2.16, p = 0.04). J, Total distance traveled in the center (in meters) of the OFT arena between mCherry male (n = 5), mCherry female (n = 9), hM4Di male (n = 6), and hM4Di female (n = 4) mice. There is no interaction between sex and distance traveled in the center (2-way ANOVA, F(1,20) = 6.566, p value = 0.7503) but a significant main effect of hM4Di-mediated inhibition on distance traveled in the center (2-way ANOVA, F(1,20) = 4.307, p value = 0.05; *p < 0.05. ns, Not significant. Individual data points represent individual mice. Scale bar: A, 100 um; B, C, 250 um.
Figure 8.
Figure 8.
Chronic inhibition of PVT MC3R neurons reduces anxiety-related behavior. A, Representative image of the viral expression of Kir2.1-mCherry in PVT MC3R neurons. B, C, Image of colabeling of c-fos immunohistochemistry with mCherry viral expression in control mCherry-expressing mice (B), or mice with Kir2.1-mCherry in PVT MC3R neurons. D, Quantification of the percentage of PVT MC3R neurons containing c-fos in mCherry (n = 4) and Kir2.1-mCherry-expressing mice (n = 4 mice in mCherry group and n = 6 mice in Kir2.1 group, Student's unpaired t test, t(8) = 5.667, p value = 0.0005). E, Food intake of mCherry and Kir2.1 mice during the dark period in ad libitum fed conditions. No difference in food intake was detected between control mCherry- and Kir2.1-expressing mice (n = 8 mice for mCherry condition and n = 5 mice for Kir2.1 condition, 2-way ANOVA, main effect of viral injection condition, F(1,33) = 3.12, p = 0.09). F. Twenty-four-hour food intake of mCherry and Kir2.1 targeted mice during ad libitum access to regular chow (n = 8 mice in mCherry group and n = 5 mice in Kir 2.1 group, Student's unpaired t test, t(11) = 1.57, p = 0.145). G, Body weight curve of mCherry- and Kir2.1-injected mice over the course of the experiments. H, Image of open field test apparatus used for open field tests. I, Total distance traveled during the open field tests for both mCherry and Kir2.1 targeted mice (n = 14 mice in mCherry group and 11 mice in Kir2.1 groups, Mann–Whitney test, two-tailed p value = 0.8508, Mann–Whitney U = 73). J, Percentage of time in the center of the open field test in mCherry-injected mice and Kir2.1-injected mice. Chronic inhibition significantly increased the percentage of time the mice spent in the center (n = 14 mice in mCherry group and n = 11 mice in Kir2.1 group; Mann–Whitney test, p value = 0.038, Mann–Whitney U = 39). K, Percentage of distance traveled in the center of the open field test in mCherry-injected mice and Kir2.1-injected mice. Chronic inhibition significantly increased the percentage of distance traveled in the center of the open field test (n = 14 mice in mCherry group and n = 11 mice in Kir2.1 group; Student's unpaired t test, t(23) = 2.694, p = 0.01); *p < 0.05, ***p < 0.001. ns, Not significant. Individual data points indicate individual mice. Scale bars: A, 100 um; B and C, 50 um.
Figure 9.
Figure 9.
Inhibition of PVT MC3R neurons does not affect acute anorexic response to social isolation stress. A, One-hour food intake in WT or hM4Di targeted mice on the day of social isolation and on the day following social isolation. Acute social isolation reduced food intake in both WT and hM4Di mice (n = 12 mice in hM4Di group, n = 14 mice in WT group; 2-way ANOVA, no significant interaction between social isolation and hM4Di-mediated inhibition, F(1,48) = 0.42, p = 0.52). B, One-hour food intake in WT and Kir2.1 targeted mice on the day of social isolation and the day following social isolation. Social isolation reduced food intake in both groups of mice, with no significant interaction between viral injection condition and social isolation (n = 8 mice in WT group and n = 5 mice in Kir2.1 group; 2-way ANOVA, F(1,22) = 0.22, p = 0.64); *p < 0.05, ****p < 0.0001. Data points indicate individual mice.
Figure 10.
Figure 10.
MC3R in PVT does not regulate feeding behavior on a standard chow diet. A, Representative image showing viral expression of Cre-GFP in the PVT in MC3R lox/lox mice. B, Quantification of MC3R mRNA levels in PVT in WT (n = 4 mice) and flox/flox (n = 4 mice) mice injected with AAV-Cre-GFP into PVT using RNA in situ hybridization. PVT MC3R KO mice showed a significant reduction in MC3R mRNA compared with WT mice (Student's unpaired t test, t(6) = 10.27, p < 0.0001). C, Ad libitum 24 h food intake for WT (n = 27) and flox/flox (n = 25) mice. No statistical difference in 24 h food intake was observed (Student's unpaired t test, t(50) = 0.085, p = 0.93). D, Acute food intake following an overnight fast in WT (n = 15 mice) and flox/flox mice (n = 12 mice). No statistical difference in food intake following an overnight fast was observed (2-way ANOVA, F(2,50) = 0.7980, p value = 0.4559). E, Weekly body weights of WT and flox/flox mice over the course of the experiments. F, Twenty-four-hour food intake in WT male (n = 14), WT female (n = 13), flox/flox male (n = 15), and flox/flox female mice (n = 10). There is no effect of sex in this context (2-way ANOVA of interaction between sex and food intake, F(1,48) = 0.4467, p value = 0.5071); ****p < 0.0001. ns, Not significant. Individual data points indicate individual mice. Scale bar, A, 50 um.
Figure 11.
Figure 11.
MC3R in PVT regulates anxiety-related behavior. A, Image of elevated zero maze apparatus B, Total number of entries to the open arms during the EZM test in WT (n = 20 mice) and flox/flox (n = 19 mice) mice. Deletion of MC3R from PVT significantly reduced the total number of entries to the open arms during the EZM test (Mann–Whitney test, two-tailed p value = 0.0223, Mann–Whitney U = 109.5). C, Distance traveled in the open arms of the EZM in WT (n = 20) and flox/flox (n = 19) mice as a percentage of the total distance traveled. Deletion of MC3R from PVT significantly decreased the percentage of the distance traveled in the open arms of the EZM test (Mann–Whitney test, two-tailed p value = 0.0208, Mann–Whitney U = 108). D, Time spent in the open arms of the EZM in WT (n = 20) and flox/flox (n = 19) mice. Deletion of MC3R from PVT did not significantly reduce the percentage of time spent in the open arms, although a trend was observed (Mann–Whitney test, two-tailed p value = 0.0826, Mann–Whitney U = 128). E, Distance traveled in the open arms of the EZM as a percentage of the total distance traveled in WT male (n = 8), WT female (n = 12), flox/flox male (n = 12), and flox/flox female (n = 7) mice. There is no effect of sex in this context (2-way ANOVA of interaction between sex and percentage of distance in the open arms, F(1,35) = 0.7593, p value = 0.7593) but a main overall effect of MC3R deletion (2-way ANOVA, main effect of genotype, F(1,35) = 8.7, p = 0.005). F, Distance traveled (in meters) during EZM experiment in WT (n = 20) and flox/flox (n = 19) mice. No statistical difference was observed between WT and flox/flox mice in total distance traveled (Student's unpaired t test, t(37) = 0.91, p = 0.37). G, One-hour food intake on the day of social isolation and the day following social isolation. Deletion of MC3R in PVT did not alter the acute anorexic response to social isolation (2-way ANOVA, interaction between genotype and social isolation, F(1,50) = 1.1, p = 0.29); *p < 0.05, **p < 0.01, ***p < 0.001. ns, Not significant. Individual data points indicate individual mice.

Similar articles

Cited by

References

    1. Aponte Y, Atasoy D, Sternson SM (2011) AGRP neurons are sufficient to orchestrate feeding behavior rapidly and without training. Nat Neurosci 14:351–355. 10.1038/nn.2739 - DOI - PMC - PubMed
    1. Barson JR, Leibowitz SF (2015) GABA-induced inactivation of dorsal midline thalamic subregions has distinct effects on emotional behaviors. Neurosci Lett 609:92–96. 10.1016/j.neulet.2015.10.029 - DOI - PMC - PubMed
    1. Barson JR, Mack NR, Gao WJ (2020) The paraventricular nucleus of the thalamus is an important node in the emotional processing network. Front Behav Neurosci 14:598469. 10.3389/fnbeh.2020.598469 - DOI - PMC - PubMed
    1. Bedenbaugh MN, Brener SC, Maldonado J, Lippert RN, Sweeney P, Cone RD, Simerly RB (2022) Organization of neural systems expressing melanocortin-3 receptors in the mouse brain: evidence for sexual dimorphism. J Comp Neurol 530:2835–2851. 10.1002/cne.25379 - DOI - PMC - PubMed
    1. Betley JN, Cao ZFH, Ritola KD, Sternson SM (2013) Parallel, redundant circuit organization for homeostatic control of feeding behavior. Cell 155:1337–1350. 10.1016/j.cell.2013.11.002 - DOI - PMC - PubMed

Publication types