. 2023 Aug 17;14(1):4972.
doi: 10.1038/s41467-023-40622-1.

RORγt-Raftlin1 complex regulates the pathogenicity of Th17 cells and colonic inflammation

Affiliations

RORγt-Raftlin1 complex regulates the pathogenicity of Th17 cells and colonic inflammation

Amir Kumar Singh et al. Nat Commun. .

Abstract

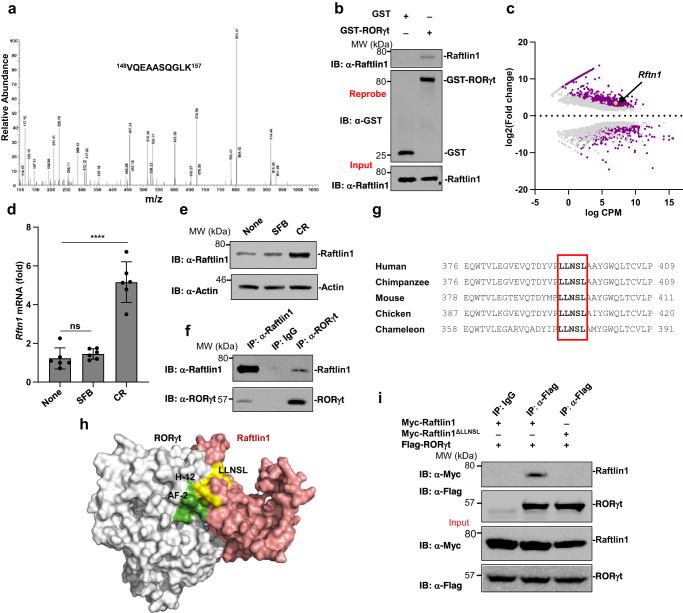
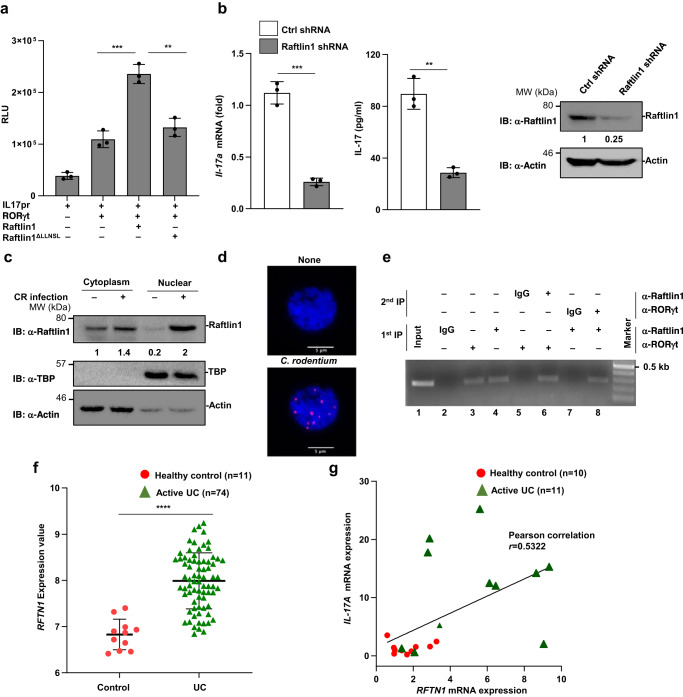
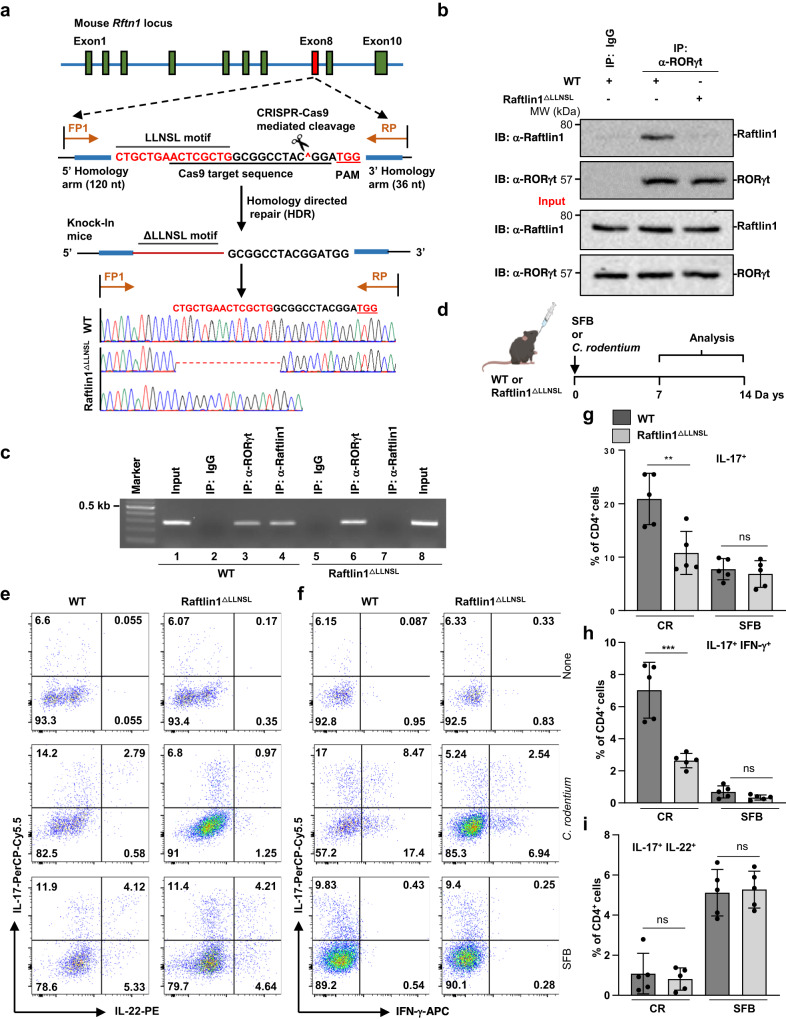
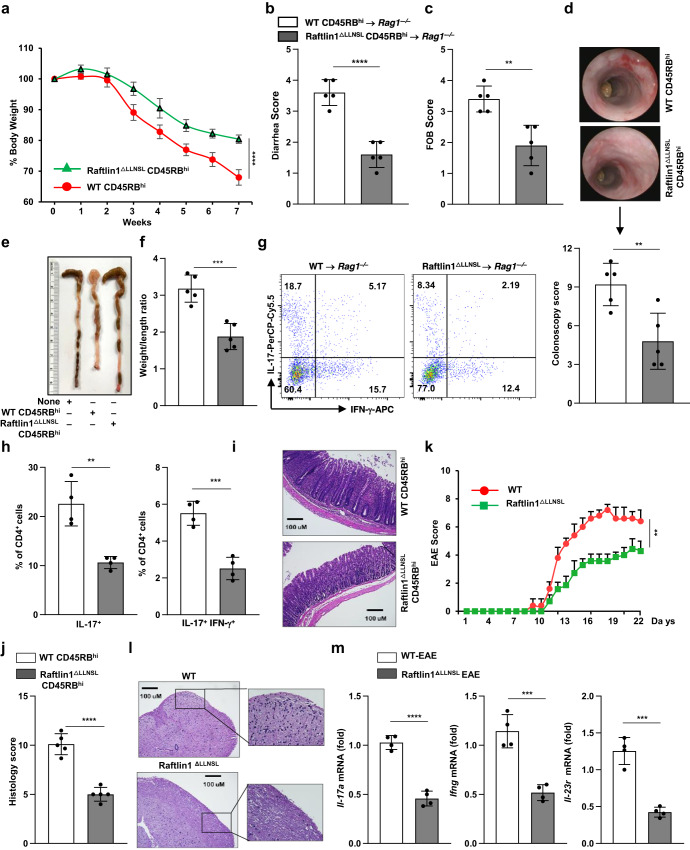
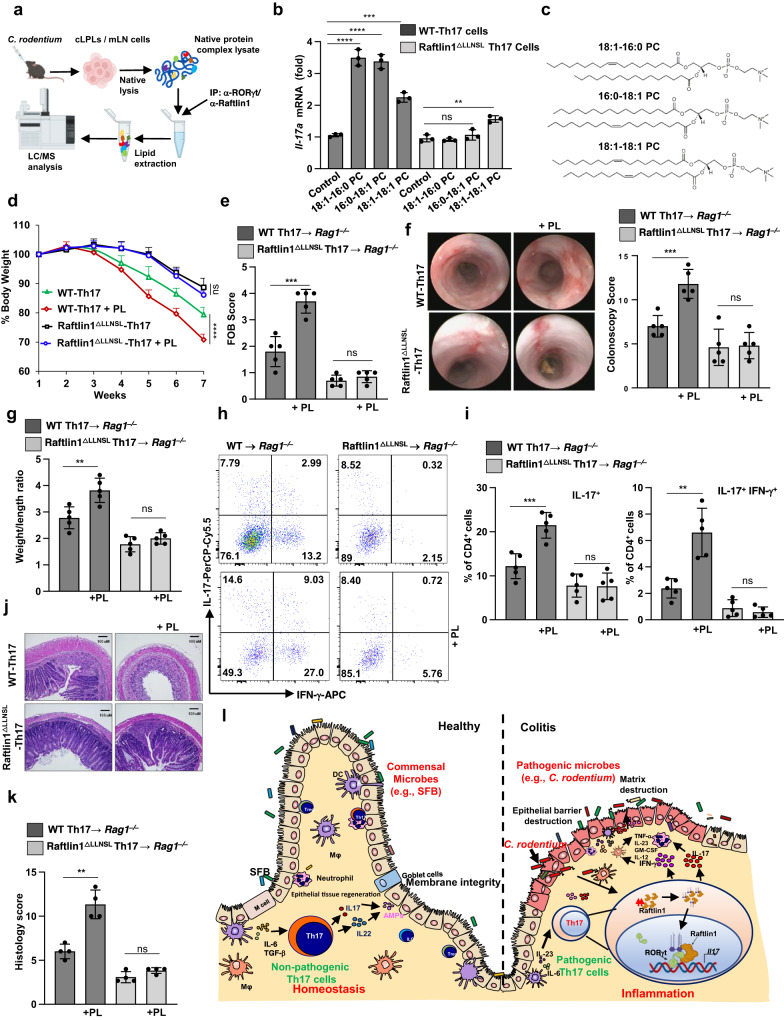
Th17 cells that produce Interleukin IL-17 are pathogenic in many human diseases, including inflammatory bowel disease, but are, paradoxically, essential for maintaining the integrity of the intestinal barrier in a non-inflammatory state. However, the intracellular mechanisms that regulate distinct transcriptional profiles and functional diversity of Th17 cells remain unclear. Here we show Raftlin1, a lipid raft protein, specifically upregulates and forms a complex with RORγt in pathogenic Th17 cells. Disruption of the RORγt-Raftlin1 complex results in the reduction of pathogenic Th17 cells in response to Citrobacter rodentium; however, there is no effect on nonpathogenic Th17 cells in response to commensal segmented filamentous bacteria. Mechanistically, we show that Raftlin1 recruits distinct phospholipids to RORγt and promotes the pathogenicity of Th17 cells. Thus, we have identified a mechanism that drives the pathogenic function of Th17 cells, which could provide a platform for advanced therapeutic strategies to dampen Th17-mediated inflammatory diseases.


Conflict of interest statement

The authors declare no competing interests.

Figures

Fig. 1
Fig. 1. Raftlin1 is upregulated in pathogenic Th17 cells and binds to RORγt.
a MS spectrum of peptide 148VQEAASQGLK157 corresponding to Raftlin1 (UniProt accession No: Q6A0D4). Observed b- and y-ions are indicated. b The lysates from CD4+ T cells isolated from colonic lamina propria of C. rodentium infected WT mice were pulled-down with purified recombinant GST or GST-RORγt followed by Immunoassays with anti-Raftlin1 and anti-GST antibody. c GEO dataset (GSE130302) was analyzed (n = 2 C. rodentium-infected and n = 3 SFB-colonized colon) and presented as the MA plot showing the change in expression (log2 fold change) and counts per million (log CPM values); p < 0.05, FDR < 0.05. d Rftn1 mRNA expression was analyzed by real-time PCR using CD4+ T cells isolated from colonic lamina propria; n = 6 mice per group. Data are presented as mean value ± SD, p = 0.00010 (CR), p = 0.37 (SFB). e Immunoassays of Raftlin1 protein in the lysates of CD4+ T cells. f the lysates of CD4+ T cells isolated from colonic lamina propria of C. rodentium infected mice were subjected to immunoprecipitation with anti-Raftlin1 or anti-RORγt antibody and immunoblot analysis with anti-RORγt or anti-Raftlin1 antibody. g Sequence alignment of Raftlin1; box indicates the conserved LLNSL motif. h Putative protein-protein interface from the docking model is shown in color gray for RORγt and Salmon for Raftlin1. Helix 12 (labeled) and AF2 (green) domains of RORγt are involved in non-covalent interaction in the modeled RORγt-Raftlin1 complex. LLNSL region of Raftlin1 is shown in color yellow. i Lysates from HEK293T cells transfected with various combinations of plasmids encoding Flag-RORγt and either Myc-Raftlin1 or Myc-Raftlin1ΔLLNSL, followed by immunoprecipitation with anti-Flag antibody and immunoblot analysis with anti-Myc or anti-Flag antibody. Immunoblots in (b, e, f, i) are from one experiment representative of three independent experiments with similar results. Statistical significance was determined by unpaired Student’s t test (two-tailed) in (c, d) with p  <  0.05 considered statistically significant. ****p  <  0.0001; ns- not significant. Source data are provided as a Source data file.
Fig. 2
Fig. 2. Raftlin1 regulates IL-17 expression, and the level of Raftlin1 expression correlates with IL-17 expression in UC patients.
a Luciferase assay of lysates of Jurkat T cells transfected with various plasmid combinations (below plot) of the IL-17 promoter-driven luciferase plasmid (pGL4-IL17pr) and the plasmid encoding Flag-RORγt along with wild-type Myc-Raftlin1 or Myc-Raftlin1ΔLLNSL; results are presented in relative luciferase unit (RLU); n = 3 biological replicates, p = 0.0009, p = 0.002. b Real-time PCR and ELISA were performed to check the expression of IL-17 in Raftlin1 knockdown lysates of CD4+ T cells isolated from colonic lamina propria of C. rodentium infected WT mice; n = 3 biological replicates, p = 0.0002 (Il-17a), p = 0.001 (IL-17a). Immunoblot showing knockdown of Raftlin1. c Immunoblot analysis for Raftlin1 in the cytoplasmic and nuclear fraction of CD4+ T cells isolated from colonic lamina propria. d Representative images from proximity ligation assay (PLA) showing the interaction between RORγt and Raftlin1. The image is representative of three independent experiments. Scale bars, 5 μm. e Binding of RORγt-Raftlin1 to the IL-17 promoter sites was assessed by ChIP, and re-ChIP analysis using a DNA-protein complex using a specific antibody. f GEO dataset (GSE59071) was analyzed (n = 11 healthy control and n = 74 active UC patients samples), and the normalized expression value of RFTN1 is as shown above, p = 2 × 10−9. g Expression of IL-17A mRNA and RFTN1 mRNA was analyzed by real-time PCR in active UC and control samples (n = 10 healthy control and n = 11 active UC patients samples). Relative IL-17A mRNA was plotted against relative RFTN1 mRNA; p = 0.0130, Pearson correlation coefficient r = 0.5322. Data in (a–c, e) are from one experiment representing three independent experiments with similar results. Statistical significance was determined by unpaired Student’s t test (two-tailed) in (a, b, f, g) with p  <  0.05 considered statistically significant. **p  <  0.01; ***p  <  0.001; ****p  <  0.0001, error bars are mean ± SD. The statistics (g) were measured by the Pearson correlation coefficient. Source data are provided as a Source data file.
Fig. 3
Fig. 3. Disruption of RORγt-Raftlin1 interaction attenuates pathogenic but not nonpathogenic Th17 responses.
a Generation of Raftlin1 knock-in (Raftlin1∆LLNSL) mice using the CRISPR-Cas9 approach. Schematic illustration of the Rftn1 gene structures, sequences around the target locus, and donor oligos template (in the “Methods” sections). The sequence around the target locus indicates the PAM and the sequence recognized by the Cas9-gRNA complex. The Raftlin1 knock-in mice were confirmed by genotyping using PCR and Sanger sequencing. b Lysates from CD4+ T cells isolated from colonic lamina propria of C. rodentium infected WT and Raftlin1∆LLNSL mice followed by immunoprecipitation with anti-RORγt antibody and immunoblot analysis with anti-Raftlin1 antibody. c Binding of RORγt-Raftlin1 complex to the IL-17 promoter sites was assessed by ChIP analysis using a DNA-protein complex from CD4+ T cells isolated from colonic lamina propria of C. rodentium infected WT and Raftlin1∆LLNSL mice. d Schematic diagram of the experimental procedure for C. rodentium and SFB-induced generation of Th17 cells. e, f Representative image of colonic lamina propria cells stained with antibodies against CD4, and intracellularly for IL-17, IFN-γ and IL-22, and analyzed by flow cytometry; n = 5 mice per group. g–i Corresponding quantification of total IL17+, IL-17+ IFN-γ+ and IL-17+ IL-22+ cells in CD4+ cells from colonic lamina propria cells of WT and Raftlin1∆LLNSL mice infected with C. rodentium or colonized with SFB; n = 5 mice per group, IL17+: p = 0.007 (WT and Raftlin1∆LLNSL mice with CR), p = 0.544 (WT and Raftlin1∆LLNSL mice with SFB); IL-17+IFN-γ+: p = 0.0006 (WT and Raftlin1∆LLNSL mice with CR), p = 0.089 (WT and Raftlin1∆LLNSL mice with SFB); IL-17+IL-22+: p = 0.616 (WT and Raftlin1∆LLNSL mice with CR), p = 0.815 (WT and Raftlin1∆LLNSL mice with SFB). b, c Data are from one experiment which is representative of three independent experiments with similar results. Statistical significance was determined by unpaired Student’s t test (two-tailed) in (g–i) with p  <  0.05 considered statistically significant. **p  <  0.01; ***p  <  0.001; ns- not significant, error bars are mean ± SD. Source data are provided as a Source data file. The figure (d) was created using BioRender (https://biorender.com/).
Fig. 4
Fig. 4. Deletion of the LLNSL motif of Raftlin1 attenuates the pathogenicity of Th17 cells.
CD4+CD25CD45RBhi cells were FACS sorted from WT and Raftlin1∆LLNSL mice and were adoptively transferred to Rag1–/– mice. a Percent change in body weight; n = 5 mice per group, p = 0.00010. b, c Diarrhea score and fecal occult blood (FOB) score; n = 5 mice per group, p = 0.00006 (diarrhea score), p = 0.0025 (FOB). d Colonoscopy images and scores; n = 5 mice per group, p = 0.0068. e Representative image of colon length. f Colon weight/length ratio; n = 5 mice per group, p = 0.0005. g Representative image of colonic lamina propria cells stained with antibodies against CD4, and intracellularly for IL-17 and IFN-γ, and analyzed by flow cytometry; n = 4 mice per group. h Corresponding quantification of total IL17+ and IL-17+ IFN-γ+ in CD4+ cells from colonic lamina propria cells of Rag1–/– mice; n = 4 mice per group, p = 0.0022 (IL17+), p = 0.0005 (IL-17+ IFN-γ+). i Microscopic images of H&E-stained colonic sections. The image is representative of five independent experiments. Scale bars, 100 μm. j Histology scores; n = 5 mice per group, p = 0.00002. k WT, and Raftlin1ΔLLNSL mice were immunized with MOG35-55 peptide in complete Freund’s adjuvant. Clinical EAE scores (0–10 severity scale); n = 5 WT and 7 Raftlin1∆LLNSL mice, p = 0.0013. l H&E-stained sections of the spinal cord. Image is representative of four independent experiments. Scale bars, 100 μm. m Expression of Il-17a, Ifng, and Il-23r were analyzed by real-time PCR in those spinal cords; n = 4 mice per group, p = 0.00003 (Il-17a), p = 0.0005 (Ifng), and p = 0.0001 (Il-23r). Data are from one experiment representative of three independent experiments with similar results. Statistical significance was determined by unpaired Student’s t test (two-tailed) in (a–d, f, h, j, k, m) with p  <  0.05 considered statistically significant. **p  <  0.01; ***p  <  0.001; ****p  <  0.0001, error bars are mean ± SD. Source data are provided as a Source data file.
Fig. 5
Fig. 5. Raftlin1 recruits phospholipids to RORγt and promotes the pathogenicity of Th17 cells.
a Schematic representation of the lipidomics by LC/MS. b Naive CD4+ T cells were isolated from WT or Raftlin1∆LLNSL mice and differentiated under Th17 polarizing conditions in the presence or absence of phospholipids (PL). Il-17a expression was measured by qPCR; n = 3 mice per group, p = 0.00008 (WT-Th17 cells with 18:1–16:0-PC), p = 0.00006 (WT-Th17 cells 16:0–18:1-PC), p = 0.0002 (WT-Th17 cells 18:1–18:1-PC), p = 0.389 (Raftlin1∆LLNSL Th17 with 16:0–18:1-PC), p = 0.0022 (Raftlin1∆LLNSL Th17 with 18:1–18:1-PC). c Structure of phospholipids. d Th17 cells were generated in the presence of PL. The cells were then adoptively transferred to Rag1–/– mice. Percent change in body weight is shown. p = 0.00001 (WT and WT-PL), p = 0.056 (Raftlin1∆LLNSL and Raftlin1∆LLNSL with PL). e Fecal occult blood score. p = 0.0004 (WT and WT-PL), p = 0.305 (Raftlin1∆LLNSL and Raftlin1∆LLNSL with PL). f Colonoscopy images, and scores. p = 0.0008 (WT and WT-PL), p = 0.865 (Raftlin1∆LLNSL and Raftlin1∆LLNSL with PL). g Colon weight/length ratio. p = 0.0056 (WT and WT-PL), p = 0.20 (Raftlin1∆LLNSL and Raftlin1∆LLNSL with PL). h Representative image of colonic lamina propria cells stained with antibodies against CD4, intracellularly for IL-17 and IFN-γ and analyzed by flow cytometry. i Corresponding quantification of total IL-17+ and IL-17+IFN-γ+ cells. IL-17+: p = 0.0009 (WT and WT-PL), p = 0.93 (Raftlin1∆LLNSL and Raftlin1∆LLNSL with PL); IL-17+ IFN-γ+: p = 0.0014 (WT and WT-PL), p = 0.381 (Raftlin1∆LLNSL and Raftlin1∆LLNSL with PL). j Microscopic images of H&E-stained colonic sections. The image is representative of four independent experiments. Scale bars, 100 μm. k Histology score of the sections. p = 0.0011 (WT and WT-PL), p = 0.080 (Raftlin1∆LLNSL and Raftlin1∆LLNSL with PL). l The proposed model of RORγt-Raftlin1 complex in the regulation of pathogenicity of Th17 cells. d–h, i, n = 5 mice per group, (k) n = 4 mice per group. Statistical significance was determined by unpaired Student’s t test (two-tailed) in (b, d–g, i, k) with p  <  0.05 considered statistically significant. **p  <  0.01, ***p  <  0.001; ****p  <  0.0001, ns- not significant, error bars are mean ± SD. Source data are provided as a Source data file. Figures (a, i) were created using BioRender (https://biorender.com/).

References

    1. McGeachy MJ, Cua DJ, Gaffen SL. The IL-17 family of cytokines in health and disease. Immunity. 2019;50:892–906. doi: 10.1016/j.immuni.2019.03.021. - DOI - PMC - PubMed
    1. Li X, Bechara R, Zhao J, McGeachy MJ, Gaffen SL. IL-17 receptor-based signaling and implications for disease. Nat. Immunol. 2019;20:1594–1602. doi: 10.1038/s41590-019-0514-y. - DOI - PMC - PubMed
    1. Kumar, R., Theiss, A. L. & Venuprasad, K. RORgammat protein modifications and IL-17-mediated inflammation. Trends Immunol42, 1037–1050 (2021). - PMC - PubMed
    1. Stockinger B, Omenetti S. The dichotomous nature of T helper 17 cells. Nat. Rev. Immunol. 2017;17:535–544. doi: 10.1038/nri.2017.50. - DOI - PubMed
    1. Hernandez-Santos N, Gaffen SL. Th17 cells in immunity to Candida albicans. Cell Host Microbe. 2012;11:425–435. doi: 10.1016/j.chom.2012.04.008. - DOI - PMC - PubMed

Publication types

Substances

LinkOut - more resources