. 2023 Aug 17;14(1):5011.
doi: 10.1038/s41467-023-40584-4.

Resolving the spatial architecture of myeloma and its microenvironment at the single-cell level

Affiliations

Resolving the spatial architecture of myeloma and its microenvironment at the single-cell level

Lukas John et al. Nat Commun. .

Abstract

In multiple myeloma spatial differences in the subclonal architecture, molecular signatures and composition of the microenvironment remain poorly characterized. To address this shortcoming, we perform multi-region sequencing on paired random bone marrow and focal lesion samples from 17 newly diagnosed patients. Using single-cell RNA- and ATAC-seq we find a median of 6 tumor subclones per patient and unique subclones in focal lesions. Genetically identical subclones display different levels of spatial transcriptional plasticity, including nearly identical profiles and pronounced heterogeneity at different sites, which can include differential expression of immunotherapy targets, such as CD20 and CD38. Macrophages are significantly depleted in the microenvironment of focal lesions. We observe proportional changes in the T-cell repertoire but no site-specific expansion of T-cell clones in intramedullary lesions. In conclusion, our results demonstrate the relevance of considering spatial heterogeneity in multiple myeloma with potential implications for models of cell-cell interactions and disease progression.


Conflict of interest statement

The authors declare no competing interests.

Figures

Fig. 1
Fig. 1. Sample origin, applied methods and the extent of spatial heterogeneity.
a Random bone marrow (RBM) aspirates from the iliac crest and imaging-guided samples from focal lesions (FL) were processed using CD138-positive selection. b CD138-positive tumor and CD138-negative tumor microenvironment (TME) samples from intra- or paramedullary components were analyzed using bulk and single-cell sequencing. Gray squares: samples not available. For P06, only TME data was available. c Number of copy number aberrations (CNA, >200 kb) and mutational differences between paired RBM and FL samples. Left panel: Red and pink denote major and minor unshared CNAs, respectively. Blue denotes CNAs that dominated in one sample (cancer clonal fraction (CCF)  >  0.6) but were only a minor subclone in the paired sample. Right panel: Number of major (red), and minor (pink) unshared single-nucleotide variants (SNVs). Major SNVs with a threefold enrichment between the paired samples were classified as enriched (blue). d Whole genome sequencing CCF plot for total SNVs in paired RBM/FL specimens from patient P08 as an example for a patient with two site-unique, biallelic TP53-mutations. The color code corresponds to the one in (c). e Imaging, whole genome and single-cell RNA-seq data for patient P02. Left panel: CT- and PET-CT-scans showing the location of the sampled FL (red circle) and RBM (blue circle). Middle panel: CCF-plot for SNVs in paired specimens. The three unique RAS mutations are depicted in red (KRAS p.G13D), blue (NRAS p.G13D) and black (KRAS p.G12D), respectively. Uniform Manifold Approximation and Projection (UMAP) and single-cell calls for these three SNVs are shown in the right panel. Dark gray dots denote cells with a wild type (WT) call, light gray dots indicate cells with no call. Source data are provided as a Source Data file.
Fig. 2
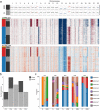
Fig. 2. The spatial subclonal architecture.
a Data for patient P05 is shown as an example for our approach for detection of subclones, which is based on subclonal copy number aberrations (CNAs). In the upper panel the whole genome sequencing chromosomal profiles for each autosomal chromosome in paired focal lesion (FL, gray bar) and RBM (black bar) are depicted. Light red and blue denote subclonal chromosomal gains and losses, respectively. Clonal events are marked with dark red and blue. To identify subclones, the average relative gene expression/accessibility in regions impacted by subclonal events was used for supervised clustering of scRNA-seq (middle panel) and scATAC-seq (lower panel) data of paired FL (gray bar) and RBM (black bar) samples. In the heatmaps red and blue signals correspond to higher and lower gene expression/accessibility, respectively. The four detected subclones are depicted on the left side of the two heatmaps in blue, red, green and orange, respectively. b Number of detectable CNA-defined subclones for each patient. For 3 patients (P01, P02 and P04), unique subclones, which were only detectable at one bone marrow site, are shown in dark color. c Proportion of CNA-defined subclones in paired FL/RBM scRNA-seq data for each patient. Subclone 6b in P04 corresponds to tumor cells with a deletion of chromosome 14 but no deletion of chromosome 13, which could not be seen in scATAC-seq and WGS (please also see Supplementary Fig. 4d). Source data are provided as a Source Data file.
Fig. 3
Fig. 3. Differentially expressed genes between paired samples.
a Volcano plot for the comparison of paired focal lesion (FL)/random bone marrow (RBM) bulk RNA-seq from 11 patients using the two-sided Wald test. The 47 genes, which showed a ≥1.5-fold difference between focal lesion and RBM, and which were significant (p < 0.05) in Wald-test after Benjamini-Hochberg correction for multiple testing, are depicted in red. The 6 genes, for which differential expression (p < 0.05) could be confirmed using microarray data for 250 focal lesion/RBM pairs from the University of Arkansas for Medical Sciences, are highlighted. b Line plots for the log2-normalized bulk RNA-seq expression values of the differentially expressed genes ADM, CXCL7 (PPBP), CXCL12 and MYLIP are shown. c Ki-67 index of myeloma cells. Slides were co-stained for CD138 (DAB) and Ki-67 (FastRed). Scale bar indicates 20 µm. The RBM and the FL of patient P13 are shown in the left panel. In the right panel a line plot is shown for the proportion of Ki67-positive plasma cells in paired samples from 8 patients. d Proportion of CXCL12-positive myeloma cells. In the left panel paired tissue slides from patient P13, which were stained for CXCL12, are depicted as examples. Since MUM1/CXCL12 double stainings were not feasible, plasma cells were identified based on their morphology and location in consecutive sections stained with MUM1. Scale bar indicates 20 µm.The line plot in the right panel shows the proportion of CXCL12-positive myeloma cells in paired samples from 8 patients. The p values in (c, d) were calculated using the two-sided Wilcoxon signed-rank-test. Due to limited patient material, there are no independent replicates for immunhistochemistry. Source data are provided as a Source Data file. Images are representative for all 8 patients.
Fig. 4
Fig. 4. Spatial transcriptional and epigenetic plasticity in tumor subclones.
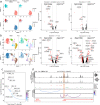
a Single-cell RNA-seq data for patient P05 as an example for very similar expression profiles of genetically identical subclones at different bone marrow sites. Left panel: transcriptional clusters and copy number aberration (CNA)-defined subclones, showing that subclones 1 and 2 were assigned to the same transcriptional clusters at the focal lesion (FL) and the random bone marrow (RBM) site. Right panel: volcano plot for the comparison of gene expression of these subclones in FL vs. RBM. Significant genes are highlighted and depicted in red (two-sided Wilcoxon rank sum test, Benjamini Hochberg adjusted p value < 0.05, ≥1.5-fold enrichment). In (b) the same plots as in (a) are shown for patient P03 as an example for pronounced differences between genetically identical subclones at different bone marrow sites. The two subclones 1 and 6 were assigned to different transcriptional clusters at the FL and the RBM, suggesting differential expression of the same subclone at different bone marrow sites. c Comparison of transcription factor (TF) motif deviation scores between paired samples of patient P03. The top TFs of the FL are marked. Marker peaks were identified based on two-sided Wilcoxon rank sum test. d Chromatin accessibility at the CD38 promoter plus 50000 bps upstream and downstream in paired samples of patient P03. The CD38 promoter peak is highlighted in light orange. Top panel: aggregated pseudo-bulk scATAC-seq tracks for the RBM (dark gray) and the FL (light gray). Right panel: violin plots showing normalized CD38 expression from scRNA-seq data per spatial site (RBM: 824 cells, FL: 193 cells). The boxplots show the median and the interquartile range, while the upper and lower whiskers show the highest and lowest value. Middle panel: peaks are colored based on the location of the peak in either promoter (orange), distal (red), exonic (blue) or intronic (green) regions. IRF4 ChIP-seq peaks from the multiple myeloma cell line KMS12BM are shown in purple; Bottom panel: peak co-accessibility in the CD38 region at both bone marrow sites colored by Pearson correlation coefficient.
Fig. 5
Fig. 5. Transcriptional plasticity of immunotherapy targets and MHC-components between coexisting/competing subclones.
a Heatmap showing the top significantly differentially expressed genes per subclone of patient P01. Overexpression of HLA-genes in subclone 1, upregulation of MS4A1 (CD20) in the focal lesion-unique subclone 4, and increased expression of CD74 in subclones 3 and 4 are highlighted in red. b Violin plots for the immunotherapy targets CD38 and TNFRSF17 (BCMA) expression in subclones of patient P03 at the random bone marrow (RBM, light color) and focal lesion (FL, dark color) site (subclone 1: 1520 RBM|629 FL cells, 2: 157|114 cells, 3: 97|34 cells, 4: 153|54 cells, 5: 69|125 cells, 6: 695|183 cells). P values were calculated using two-sided Wilcoxon rank sum tests with Benjamini Hochberg adjustment. *Significant overexpression (p < 0.05) at the focal lesion site. **The highest levels of TNFRSF17 (BCMA) expression were seen in subclone 5 at both the focal lesion and random bone marrow site. The boxplots show the median and the interquartile range, while the upper and lower whiskers show the highest and lowest value.
Fig. 6
Fig. 6. Spatial heterogeneity of the tumor microenvironment.
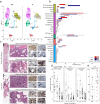
a Uniform Manifold Approximation and Projection (UMAP) of scRNA-seq for paired focal lesion (FL) and random bone marrow (RBM) CD138-negative mononuclear cell fractions from 6 patients (P01-P06). The exact cell numbers per boxplot are shown in the Source Data. b Boxplots for the proportion of individual cell types in FL (red) and RBM (blue) specimens from the 6 patients. Dark colors indicate significant (p < 0.05) differences between FL and RBM, which were assessed using two-sided Wilcoxon signed-rank tests. The boxplots show the median and the interquartile range, while the upper and lower whiskers show the highest and lowest value. The colors on the y-axis correspond to the main cell types in (a). Mono/Macro monocytes/macrophages; cDC2 conventional dendritic cells (DC) 2, pDC plasmacytoid DC, Treg Regulatory T-cells, MAIT mucosal-associated-Invariant T-cells, gdT gamma/delta T-cells, Prog progenitor, RBC red blood cells, Macro macrophage, GMP granulocyte monocyte progenitors, LMPP lymphoid-primed-multi-potential progenitor cells. c Evaluation of cellular proportions using immunohistochemistry (IHC). Stainings of FL and RBM specimens from patient P01 are shown. Slides were stained for MUM1 (plasma cells), CD68 (macrophages), CD4 (CD4-positive T-cells), or CD8 (CD8-positive T-cells). Representative regions with low and high plasma cell infiltration are shown. d Boxplots for the proportion of macrophages, CD4- and CD8-positive T-cells according to IHC for 21 patients with paired RBM/FL samples. Regions in stained slides were classified according to the level of plasma cell infiltration: 1–25% (Inf1), 26–50% (Inf2), 51–75% (Inf3) and 76–100% (Inf4). Multiple regions with a different level of plasma cell infiltration were considered for each slide. e Boxplot for the plasma cell infiltration in paired RBM and FL from the same 21 patients according to IHC. The boxplots show the median and the interquartile range, while the upper and lower whiskers show the highest and lowest value (excluding outliers), respectively. Source data are provided as a Source Data file.
Fig. 7
Fig. 7. The spatial architecture of the T-cell repertoire.
a Total number of detectable expanded (proportion: 1–5%, light red) and hyperexpanded (>5%, dark red) T-cell clones per patient in CD138-negative mononuclear cell fractions. b Uniform Manifold Approximation and Projection (UMAP) of the T-cell compartment with 10 different subtypes (left panel), and T-cell receptor (TCR) information mapped into the UMAP space (right panel). Colors indicate the type of T-cell expansion. c Proportion of expanded and hyperexpanded T-cell clones in paired focal lesion (FL)/random bone marrow (RBM) samples, which are shown as red and blue bars, respectively. Since only T-cell clones with at least 10 cells in one of the paired samples were considered for the comparison, data for patient P01 is not depicted. Except for patient P06 (no whole genome sequencing data available), the cancer clonal fraction plot for total single nucleotide variants (SNVs) in paired RBM (x-axis) and FL (y-axis) was added to show the extent of spatial tumor heterogeneity. Unshared and site-enriched SNVs are marked in black and shared SNVs in gray. For the TCR clones marked with a “V”, the CDR3 was associated with recognition of epitopes derived from the viruses CMV, EBV or Influenza A based on the databases VDJdb and McPas-TCR. Source data are provided as a Source Data file.

References

    1. Morgan GJ, Walker BA, Davies FE. The genetic architecture of multiple myeloma. Nat. Rev. Cancer. 2012;12:335–348. - PubMed
    1. Dutta AK, et al. Single-cell profiling of tumour evolution in multiple myeloma - opportunities for precision medicine. Nat. Rev. Clin. Oncol. 2022;19:223–236. - PubMed
    1. Keats JJ, et al. Clonal competition with alternating dominance in multiple myeloma. Blood. 2012;120:1067–1076. - PMC - PubMed
    1. Bolli N, et al. Heterogeneity of genomic evolution and mutational profiles in multiple myeloma. Nat. Commun. 2014;5:2997. - PMC - PubMed
    1. Rasche L, et al. Spatial genomic heterogeneity in multiple myeloma revealed by multi-region sequencing. Nat. Commun. 2017;8:268. - PMC - PubMed

Publication types