. 2023 Aug 17;14(1):4991.
doi: 10.1038/s41467-023-40578-2.

An ATR-PrimPol pathway confers tolerance to oncogenic KRAS-induced and heterochromatin-associated replication stress

Affiliations

An ATR-PrimPol pathway confers tolerance to oncogenic KRAS-induced and heterochromatin-associated replication stress

Taichi Igarashi et al. Nat Commun. .

Abstract

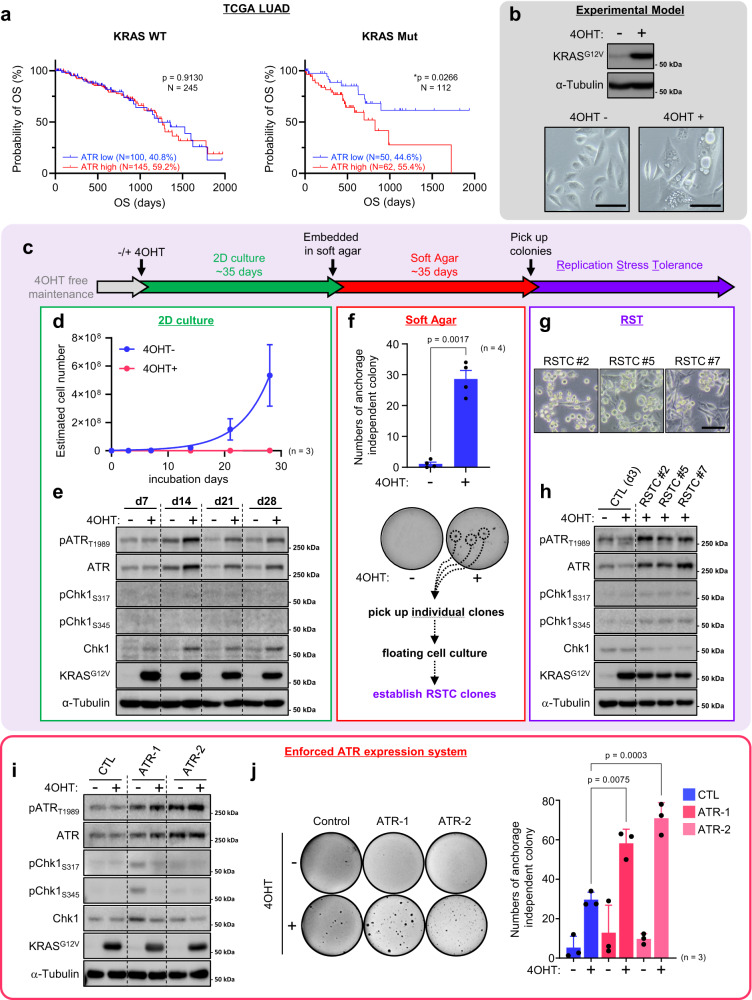
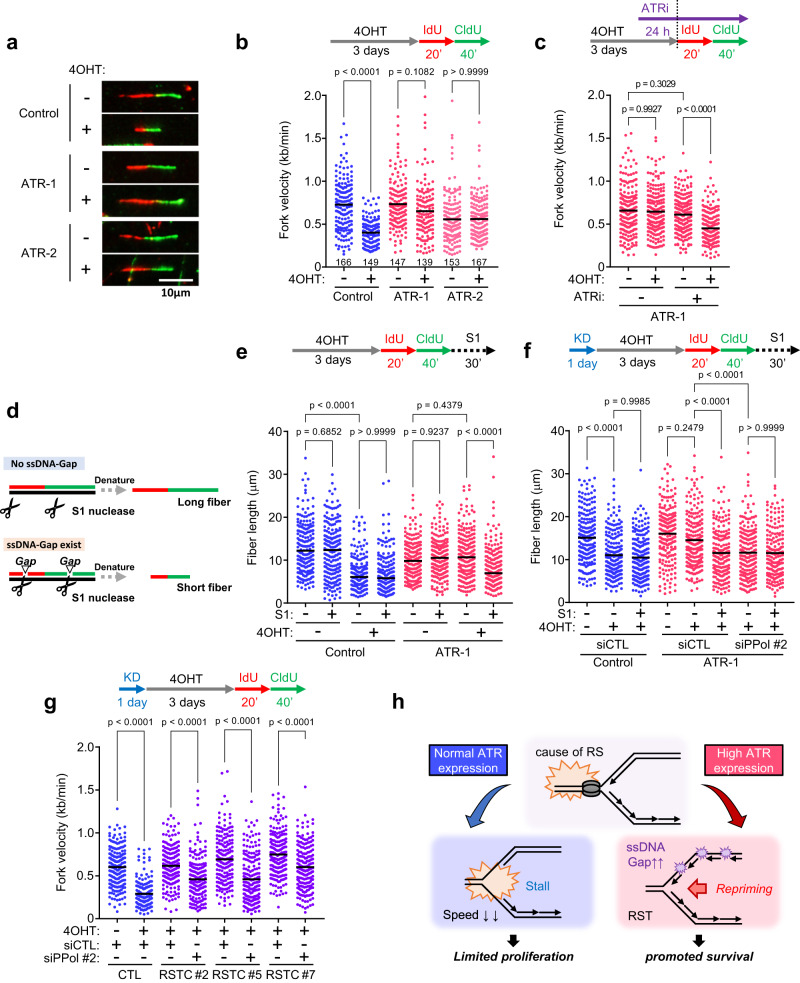
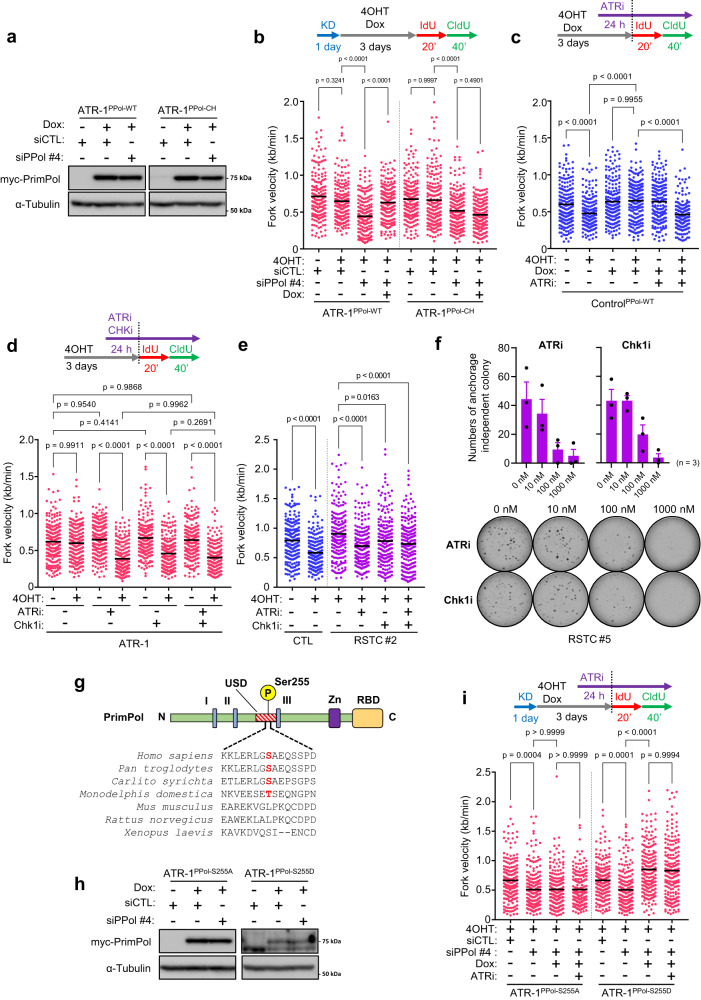
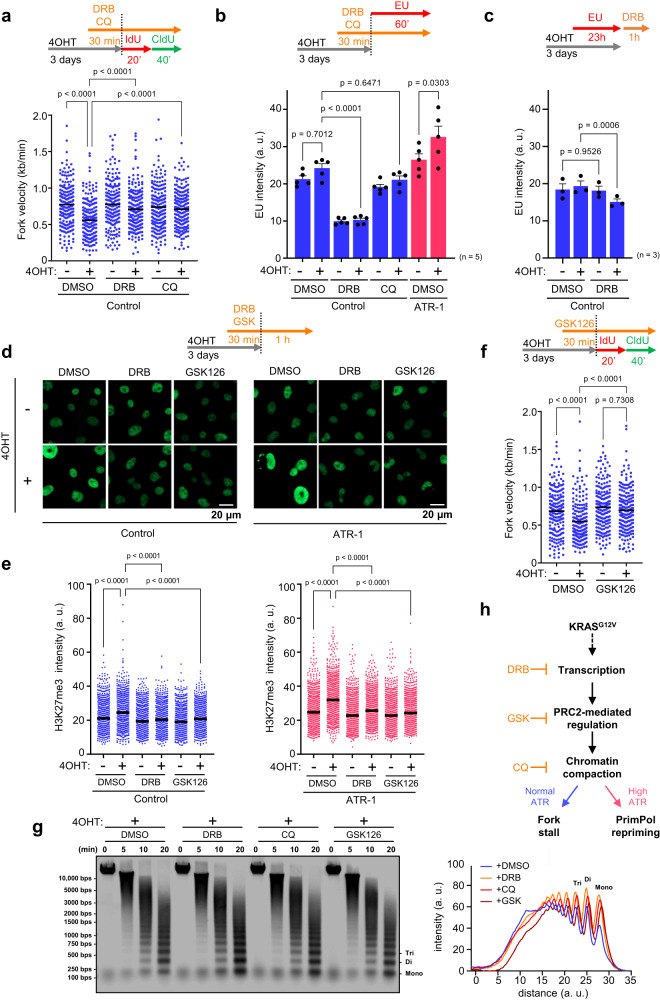
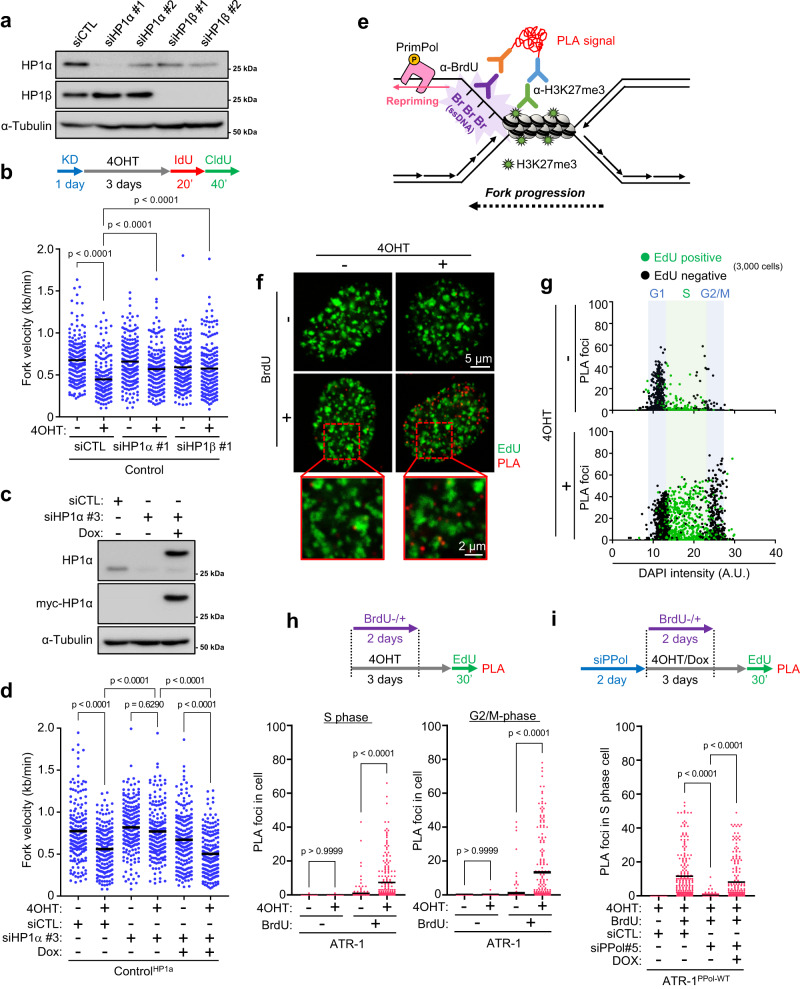
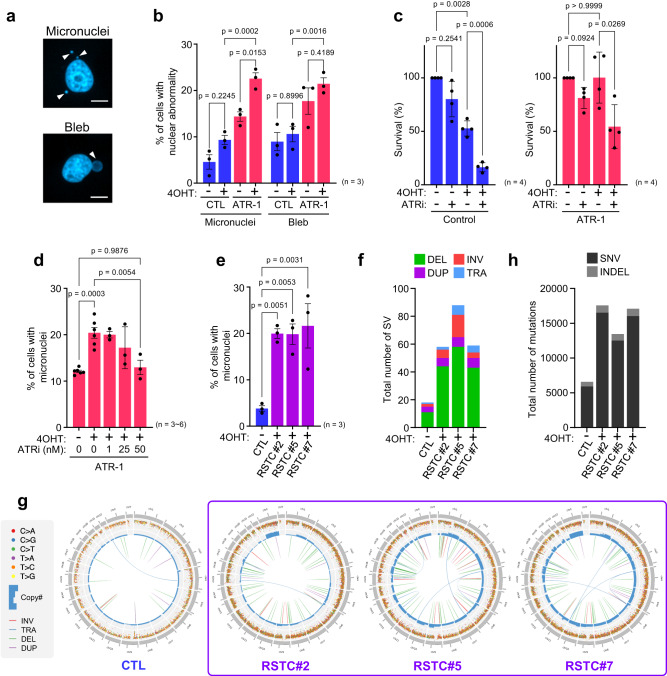
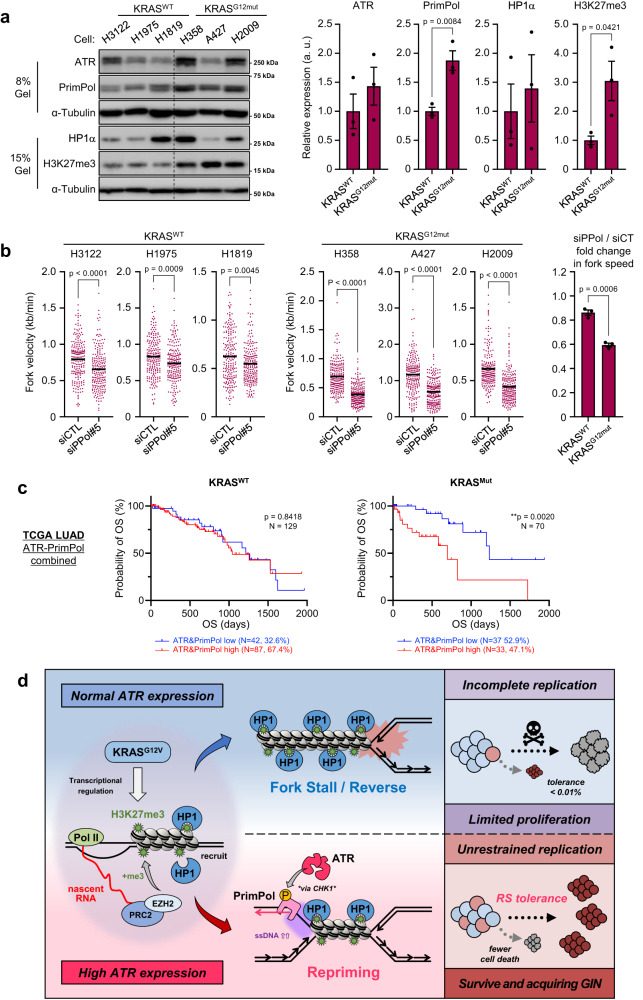
Activation of the KRAS oncogene is a source of replication stress, but how this stress is generated and how it is tolerated by cancer cells remain poorly understood. Here we show that induction of KRASG12V expression in untransformed cells triggers H3K27me3 and HP1-associated chromatin compaction in an RNA transcription dependent manner, resulting in replication fork slowing and cell death. Furthermore, elevated ATR expression is necessary and sufficient for tolerance of KRASG12V-induced replication stress to expand replication stress-tolerant cells (RSTCs). PrimPol is phosphorylated at Ser255, a potential Chk1 substrate site, under KRASG12V-induced replication stress and promotes repriming to maintain fork progression and cell survival in an ATR/Chk1-dependent manner. However, ssDNA gaps are generated at heterochromatin by PrimPol-dependent repriming, leading to genomic instability. These results reveal a role of ATR-PrimPol in enabling precancerous cells to survive KRAS-induced replication stress and expand clonally with accumulation of genomic instability.


Conflict of interest statement

The authors declare no competing interests.

Figures

Fig. 1
Fig. 1. Elevated ATR expression promotes cell survival in the presence of KRASG12V expression.
a High expression of ATR is associated with poor prognosis of lung adenocarcinoma (LUAD) patients. Overall Survival (OS) according to ATR mRNA expression from 357 of LUAD patients harboring KRASWT or KRASMut were analyzed. Log-rank p-values are shown. b Top, Control cells harboring estrogen receptor (ER)-KRASG12V were treated with or without 0.1 μM of 4OHT for 3 days. The expression of 4OHT-inducible ER-KRASG12V and α-Tubulin were analyzed by western blotting. Bottom, representative cell image of Control cells with or without (ER)-KRASG12V expression from three independent reproducible experiments. Scale bar = 100 μm. c Schematic of the long-term culture of KRASG12V-induced cells. After ~35 days, a few clones adapt to anchorage independent growth culture, acquiring replication stress tolerance ability. d, e Long term control cell culture with or without 0.1 μM of 4OHT for 28 days. d Estimated cell number. The results represent the means ± SEM of three independent experiments. e The indicated proteins expression level in control cells maintained with or without 0.1 μM of 4OHT-containing medium for ~28 days were analyzed by western blotting. f Control SAECs were grown in 0.4% of soft agar medium with or without 0.1 μM of 4OHT for totally ~70 days. Top, numbers of colony were shown. The results represent the means ± SEM of four independent experiments. two-tailed paired parametric t-test. Bottom, representative image of anchorage independent growth assay. Colonies were visualized with Crystal Violet staining. g, h The characterization of Replication Stress Tolerant Cell (RSTC) clones #2, #5 and #7 maintained in 0.1 μM of 4OHT-containing medium from three independent reproducible experiments. g Representative image of RSTC clones. Scale bar = 100 μm. h The indicated proteins expression level were analyzed by western blotting. Parental cells treated with or without 0.1 μM of 4OHT for 3 days were shown as control (CTL). i Control, ATR-1 and ATR-2 cells were treated with or without 0.1 μM of 4OHT for 3 days. The indicated proteins expression levels were analyzed by western blot analysis. j Left, representative image of anchorage independent growth assay of Control, ATR-1 and ATR-2 after 0.1 μM of 4OHT treatment for totally ~70 days. Right, numbers of colony were shown. The results represent the means ± SEM of three independent experiments. one-way ANOVA Tukey’s test. All source data are provided as a Source Data file.
Fig. 2
Fig. 2. Elevated ATR expression maintains fork speed by promoting PrimPol-dependent repriming.
a, b Fork speed in Control, ATR-1 and ATR-2 cells treated with 0.1 μM of 4OHT for 3 days. a Representative images of DNA fibers. IdU (red) was treated for 20 min followed by CldU (green) for 40 min, then visualized by denature protocol. Scale bar = 10 μm. b Dot plot and mean of fork speed. Representative result of three independent reproducible experiments are shown. Black lines indicate the mean; n ≥ 139; one-way ANOVA Tukey’s test. c Dot plot and mean of fork speed in ATR-1 cells treated with 0.1 μM of 4OHT for 3 days. 1 nM of ATRi (Berzosertib) was added 24 h prior to IdU/CldU labeling. Representative result of two independent reproducible experiments are shown. d Schematic for detection of ssDNA gap by ssDNA specific S1 nuclease. Before denaturing of DNA fiber, DNA were cleaved by 10 U/ml of S1 nuclease. e Dot plot and mean of fiber lengths in Control and ATR-1 cells treated with 0.1 μM of 4OHT for 3 days with or without 10 U/ml of S1 nuclease for 30 min. Representative result of three independent reproducible experiments are shown. f Dot plot and mean of fiber lengths in Control and ATR-1 cells transfected with 1 nM of siControl or siPrimPol for 24 h and treated with 0.1 μM of 4OHT for 3 days with or without 10 U/ml of S1 nuclease for 30 min. Representative result of two independent reproducible experiments are shown. g Dot plot and mean of fork speed in parental Control cells and RSTC clones #2, #5 and #7 transfected with 1 nM of siControl or siPrimPol for 24 h and treated with 0.1 μM of 4OHT for 3 days. Representative result of two independent reproducible experiments are shown. h Proposed ATR-PrimPol mediated RST model. In response to acute and chronic RS induced by KRASG12V, elevated ATR expression promotes PrimPol-dependent repriming to maintain fork speed but allows cell to generate ssDNA, resulting in high risk of genomic instability. c, e, f, g Black lines indicate the mean; n = 200; one-way ANOVA Tukey’s test. All source data are provided as a Source Data file.
Fig. 3
Fig. 3. PrimPol-dependent repriming requires ATR-CHK1 kinase activity.
a, b ATR-1 cells harboring doxycycline-inducible myc-PrimPolWT or myc-PrimPolCH were transfected with 5 nM of siControl or siUTR-PrimPol (siPPol #4) for 24 h and treated with 1 μg/ml of doxycycline for 24 h. The expression level of myc-tag PrimPol and α-Tubulin were analyzed by western blotting. b Dot plot and mean of fork speed in ATR-1 cells harboring doxycycline-inducible myc-PrimPolWT or myc-PrimPolCH transfected with 5 nM of siControl or siPPol #4 for 24 h and treated with 0.1 μM of 4OHT with or without 1 μg/ml of doxycycline for 3 days. Representative result of two independent reproducible experiments are shown. c Dot plot and mean of fork speed in control cells harboring doxycycline-inducible myc-PrimPolWT treated with 0.1 μM of 4OHT with or without 1 μg/ml of doxycycline for 3 days. 1 nM of ATRi (Berzosertib) was added 24 h prior to IdU/CldU labeling. Representative result of two independent reproducible experiments are shown. d Dot plot and mean of fork speed in ATR-1 cells treated with 0.1 μM of 4OHT for 3 days. Low dose of ATRi (1 nM) and Chk1i (Rabusertib, 1 nM) was added 24 h prior to IdU/CldU labeling. Representative result of two independent reproducible experiments are shown. e Dot plot and mean of fork speed in Control and RSTC #2 cells treated with 0.1 μM of 4OHT for 3 days. Low dose of ATRi (1 nM) and Chk1i (1 nM) was added 24 h prior to IdU/CldU labeling. Representative result of two independent reproducible experiments are shown. f Colony re-formation assay of RSTC #5 with long-term ATR or Chk1 inhibition. Top, the number of colonies treated at indicated concentration of ATR or Chk1 inhibitor for ~14 days. The results represent the means ± SEM of three independent experiments. Bottom, representative image of anchorage independent colonies. g Protein domain structure of PrimPol. The catalytic signature motifs (I, II, and III) of archaeal-eukaryotic primase (AEP) domain; Zinc-finger domain (Zn) and RPA binding domain (RBD) are indicated. Multiple sequence alignment of PrimPol homologs in indicated animals is shown. Phosphorylation sites (S/T) are indicated in red. h ATR-1 cells harboring doxycycline-inducible myc-PrimPolS255A or myc-PrimPolS255D were transfected with 5 nM of siControl or siPPol #4 for 24 h and treated with 1 μg/ml of doxycycline for 24 h. The expression level of myc-tag PrimPol and α-Tubulin were analyzed by western blotting. i Dot plot and mean of fork speed in ATR-1 cells harboring doxycycline-inducible myc-PrimPolS255A or myc-PrimPolS255D transfected with 5 nM of siControl or siPPol #4 for 24 h and treated with 0.1 μM of 4OHT with or without 1 μg/ml of doxycycline for 3 days. 1 nM of ATRi was added 24 h prior to IdU/CldU labeling. Representative result of four independent reproducible experiments are shown. b, c, d, e, i Black lines indicate the mean; n = 200; one-way ANOVA Tukey’s test. All source data are provided as a Source Data file.
Fig. 4
Fig. 4. KRASG12V-induced transcription-dependent chromatin remodeling causes RS.
a Dot plot and mean of fork speed in Control cells treated with 0.1 μM of 4OHT for 3 days. 100 μM of DRB or 40 μM of Chloroquine (CQ) was added 30 min prior to IdU/CldU labeling. Representative result of three independent reproducible experiments are shown. b Quantification of EU intensity of Control and ATR-1 cells treated with 0.1 μM of 4OHT for 3 days. 100 μM of DRB or 40 μM of CQ was added 30 min prior to 1 mM of EU labeling for final 60 min. The results represent the means ± SEM of five independent experiments. one-way ANOVA Tukey’s test. arbitrary units, a. u. c Quantification of total RNA of Control cells treated with 0.1 μM of 4OHT for 3 days. 1 mM of EU was added 23 h prior to 100 μM of DRB treatment for final 60 min. The results represent the means ± SEM of three independent experiments. one-way ANOVA Tukey’s test. arbitrary units, a. u. d, e After 0.1 μM of 4OHT treatment for 3 days, Control and ATR-1 cells were treated with 100 μM of DRB or 2.5 μM of GSK126 for 90 min, followed by staining with anti-H3K27me3 antibody with pre-extraction method. d Representative image of chromatin-bound H3K27me3 staining. Scale bar = 20 μm. e Quantification of the H3K27me3 intensity shown in (d). Representative result of three independent reproducible experiments are shown. Black lines indicate the mean; arbitrary units, a. u.; n = 1000; one-way ANOVA Tukey’s test. f Dot plot and mean of fork speed in Control cells treated with 0.1 μM of 4OHT for 3 days with or without 2.5 μM of GSK126. GSK126 was added 30 min prior to IdU/CldU labeling. Representative result of four independent reproducible experiments are shown. g Left, representative result of MNase sensitivity assay. After 0.1 μM of 4OHT treatment for 3 days, Control cells treated with 100 μM of DRB, 2.5 μM of GSK126 or 40 μM of CQ for 90 min, followed by permeabilization and MNase digestion for 5, 10, 20 min respectively. Right, quantification of digested DNA intensity. Representative result of two independent reproducible experiments are shown. arbitrary units, a. u. h The model of KRASG12V-induced RS and its response. KRASG12V induces the transcription of nascent RNA enriched in polycomb repressive complex 2 (PRC2)-regulated genes leading to PRC2 recruitment and trimethylation of H3K27, generating locally compacted heterochromatin region, resulting in a cause of RS. a, f Black lines indicate the mean; n = 200; one-way ANOVA Tukey’s test. All source data are provided as a Source Data file.
Fig. 5
Fig. 5. PrimPol-dependent repriming occurs at the locally compacted chromatin region.
a Control cells were transfected with 1 nM of two independent siRNAs of HP1α and HP1β for 24 h. The expression level of HP1α and HP1β were analyzed by western blotting. b Dot plot and mean of fork speed in Control cells transfected with 1 nM of siControl, siHP1α or siHP1β for 24 h and treated with 0.1 μM of 4OHT for 3 days. Representative result of two independent reproducible experiments are shown. c Control cells harboring doxycycline-inducible myc-HP1α were transfected with 1 nM of siControl or siUTR-HP1α (siHP1α #3) for 24 h and treated with 1 μg/ml of doxycycline for 24 h. The expression level of myc-tag HP1α and α-Tubulin were analyzed by western blotting. d Dot plot and mean of fork speed in Control cells harboring doxycycline-inducible myc-HP1α transfected with 1 nM of siControl or siHP1α #3 for 24 h and treated with 0.1 μM of 4OHT with or without 1 μg/ml of doxycycline for 3 days. Representative result of two independent reproducible experiments are shown. e Strategy of proximity ligation assay (PLA) to monitor ssDNA exposure near heterochromatin mediated by H3K27me3. After the siRNA transfection, cells were grown in 10 μM of BrdU-containing medium and incubated for 2 days before released into BrdU-free medium for 1 day. Cells were treated with 10 μM of EdU for final 30 min to label the S-phase cells, then PLA was performed using antibody against BrdU and H3K27me3. fh The result of H3K27me3-BrdU PLA from three independent reproducible experiments with ATR-1 cells treated with 0.1 μM of 4OHT for 3 days. f Representative PLA foci image. Scale bar = 5 μm. Expanded images are shown in red square. Scale bar = 2 μm. g Scatterplots showing the number of PLA foci. 3,000 cells from each sample were randomly selected and plotted. EdU negative (black) and EdU positive (green) are indicated respectively. h Number of PLA foci in S phase or G2/M phase cells defined by EdU incorporation level shown in (5g). i Number of PLA foci in S phase cells of ATR-1 cells harboring doxycycline-inducible myc-PrimPolWT transfected with 1 nM of siControl or siUTR-PrimPol (siPPil #5) for 2 days and treated with 0.1 μM of 4OHT with or without 1 μg/ml of doxycycline for 3 days. Representative result of three independent reproducible experiments are shown. b, d, h, i Black lines indicate the mean; n = 200; one-way ANOVA Tukey’s test. All source data are provided as a Source Data file.
Fig. 6
Fig. 6. Genomic instability driven by KRASG12V is tolerated in cells with elevated ATR expression.
a Representative image of micronuclei and bleb (white arrow). Scale bar = 10 μm. b Quantification of micronuclei and bleb positive cells in Control and ATR-1 cells treated with 0.1 μM of 4OHT for 3 days. The results represent the means ± SEM of three independent experiments. two-way ANOVA Tukey’s test. c Quantification of the plate colony- forming efficiency assay with Control and ATR-1 cells treated with 0.1 μM of 4OHT and 25 nM of ATRi for 6 days. The results represent the means ± SEM of four independent experiments. one-way ANOVA Tukey’s test. d Quantification of the micronuclei positive cells in ATR-1 cells treated with 0.1 μM of 4OHT and indicated low-concentration of ATRi for 3 days. The results represent the means ± SEM of six independent experiments in the absence of ATRi, three independent experiments in the presence of ATRi. one-way ANOVA Tukey’s test. e Quantification of micronuclei positive cells in RSTCs clone #2, #5, #7 cultured in 0.1 μM of 4OHT-containing medium. The results represent the means ± SEM of three independent experiments. one-way ANOVA Tukey’s test. f Total number of structural variants (SV) in RSTCs clone #2, #5, #7. DEL, deletion; INV, inversion; DUP, duplication; TRA, translocation. g CIRCOS plot of RSTCs clone #2, #5, #7 revealed by whole genome sequence. h Total number of mutations in RSTCs clone #2, #5, #7. SNV, single nucleotide variants; INDEL, insertion and/or deletion. All source data are provided as a Source Data file.
Fig. 7
Fig. 7. Proposed model for ATR-PrimPol-mediated RST under KRASG12V-induced RS.
a Left, KRASWT cells (H3122, H1975, H1819) and KRASG12mut cells (H358, A427, H2009) were incubated for 2 days. The indicated proteins expression levels were analyzed by western blot analysis. Right, quantification of each expression level. The results represent the means ± SEM of three cells. Unpaired t-test. b Left, Dot plot and mean of fork speed in KRASWT cells and KRASG12mut cells transfected with 1 nM of siControl or siPPol#5 for 24 h as shown in (S7b). Representative result of two independent reproducible experiments are shown. Black lines indicate the mean; n = 200; two-tailed Mann–Whitney t-test. Right, PrimPol KD fold change in fork speed. The results represent the means ± SEM of three cells. two-tailed unpaired t-test. c High expression of both ATR and PrimPol is associated to poor prognosis of LUAD patients. Overall Survival (OS) according to ATR and PrimPol mRNA expression from totally 199 of LUAD patients harboring KRASWT and KRASmut were sanalyzed. Log-rank p-values are shown. d In the early step of KRASG12V expression, KRASG12V induces transcription-dependent locally compacted heterochromatin region mediated by H3K27me3, leading to RS. When cells express normal level of ATR, replication forks stall, causing incomplete replication. In contrast, when cells express high level of ATR, ATR-PrimPol pathway functions as a regulatory module at replication forks to complete replication by promoting repriming, allowing cells to survive under KRASG12V-induced RS with acquiring genomic instability. All source data are provided as a Source Data file.

References

    1. Hanahan D, Weinberg RA. Hallmarks of cancer: the next generation. Cell. 2011;144:646–674. - PubMed
    1. Negrini S, Gorgoulis VG, Halazonetis TD. Genomic instability–an evolving hallmark of cancer. Nat. Rev. Mol. Cell Biol. 2010;11:220–228. - PubMed
    1. Macheret M, Halazonetis TD. DNA replication stress as a hallmark of cancer. Annu. Rev. Pathol. 2015;10:425–448. - PubMed
    1. Kotsantis P, Petermann E, Boulton SJ. Mechanisms of oncogene-induced replication stress: Jigsaw falling into place. Cancer Discov. 2018;8:537–555. - PMC - PubMed
    1. Halazonetis TD, Gorgoulis VG, Bartek J. An oncogene-induced DNA damage model for cancer development. Science. 2008;319:1352–1355. - PubMed

Publication types