. 2023 Aug 17;14(1):4992.
doi: 10.1038/s41467-023-40712-0.

Cell-specific and shared regulatory elements control a multigene locus active in mammary and salivary glands

Affiliations

Cell-specific and shared regulatory elements control a multigene locus active in mammary and salivary glands

Hye Kyung Lee et al. Nat Commun. .

Abstract

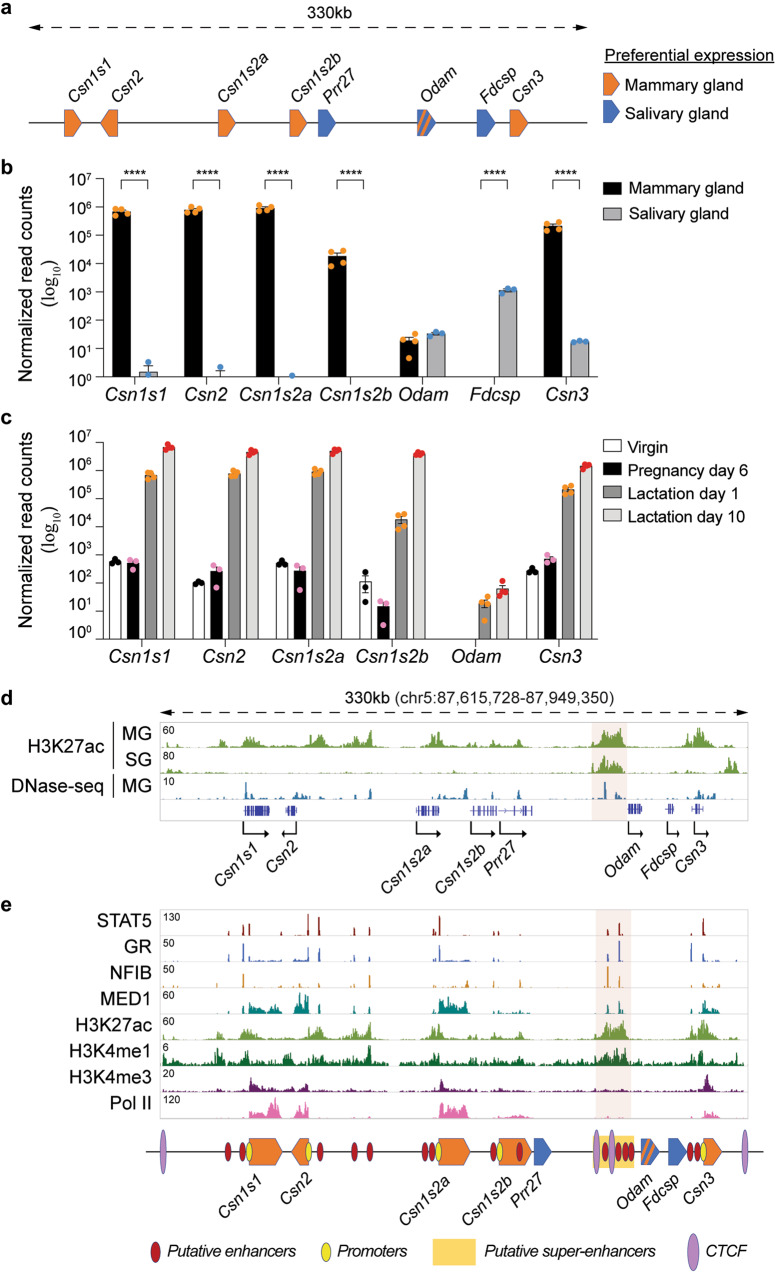
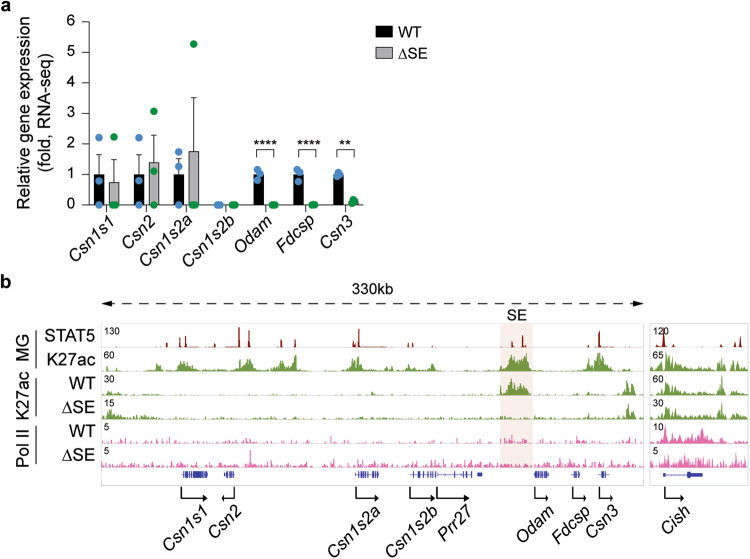
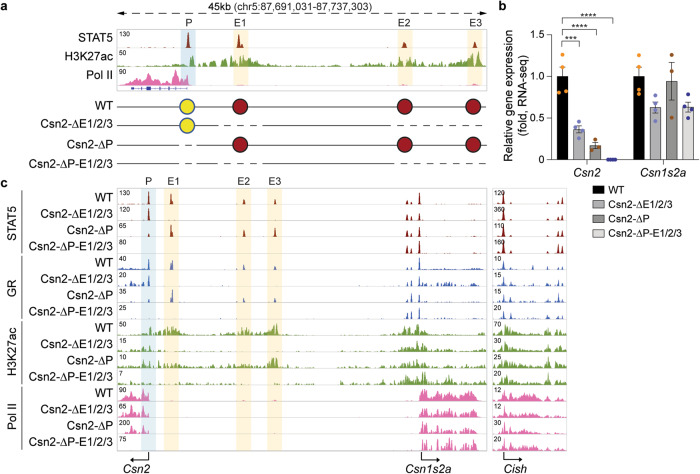
Regulation of high-density loci harboring genes with different cell-specificities remains a puzzle. Here we investigate a locus that evolved through gene duplication and contains eight genes and 20 candidate regulatory elements, including one super-enhancer. Casein genes (Csn1s1, Csn2, Csn1s2a, Csn1s2b, Csn3) are expressed in mammary glands, induced 10,000-fold during pregnancy and account for 50% of mRNAs during lactation, Prr27 and Fdcsp are salivary-specific and Odam has dual specificity. We probed the function of 12 candidate regulatory elements, individually and in combination, in the mouse genome. The super-enhancer is essential for the expression of Csn3, Csn1s2b, Odam and Fdcsp but largely dispensable for Csn1s1, Csn2 and Csn1s2a. Csn3 activation also requires its own local enhancer. Synergism between local enhancers and cytokine-responsive promoter elements facilitates activation of Csn2 during pregnancy. Our work identifies the regulatory complexity of a multigene locus with an ancestral super-enhancer active in mammary and salivary tissue and local enhancers and promoter elements unique to mammary tissue.


Conflict of interest statement

The authors declare no competing interests.

Figures

Fig. 1
Fig. 1. Characteristics of the Casein locus.
a Diagram presents gene structure within the mouse Casein locus and their preferential expression. b mRNA levels of genes in the Casein locus were measured by RNA-seq in lactating mammary glands (lactation day one, L1) and salivary glands (n = 4 and 3, respectively). Results are shown as the means ± SEM of independent biological replicates. p-values are from 2-way ANOVA with Sidak’s multiple comparisons test. **p < 0.01, ****p < 0.0001. c mRNA levels of Csn genes were measured by RNA-seq at virgin, day six of pregnancy (p6), lactation day one (L1) and L10 (virgin, p6, n = 3; L1, L10, n = 4). Results are shown as the means ± SEM of independent biological replicates. p-values are from 2-way ANOVA with Tukey’s multiple comparisons test. d Chromatin features of the Casein locus were identified by ChIP-seq and DNase-seq data in lactating mammary glands (lactation day one, L1) and salivary glands. The red shade indicates the super-enhancer. MG mammary gland, SG salivary gland. e ChIP-seq data for TFs binding and histone marks provided structural information of the Casein locus at day one of lactation (L1). Red, yellow and purple circles mark candidate enhancers, promoters, and CTCF binding sites, respectively. Super-enhancer is indicated by yellow, a rectangle and a red shade. Source data are provided as a Source Data file.
Fig. 2
Fig. 2. Differential activation of selected Casein genes by the super-enhancer during pregnancy.
a The candidate super-enhancer was identified by ChIP-seq for TFs and activating histone marks in mammary tissue of wild-type (WT) mice at day one of lactation (L1). The yellow shades and red circles indicate candidate enhancers. The diagram shows the enhancer deletions introduced in mice using CRISPR/Cas9 genome engineering. b Expression of Casein genes was measured in mammary tissue of WT and ΔSE mice collected at day 18 of pregnancy (p18) by RNA-seq (n = 4). Results are shown as the means ± SEM of independent biological replicates. p-values are from 2-way ANOVA followed by Sidak’s multiple comparisons test between WT and mutants. **p < 0.01, ****p < 0.0001. c STAT5 and GR binding, and H3K27ac and the Pol lI coverage of the Casein locus in WT and ΔSE mice were monitored by ChIP-seq. Mammary tissues of WT and ΔSE mice were collected within 12 h post-partum (pp <12 h). The red shade indicates the super-enhancer (SE). The Cish locus served as ChIP-seq control. d Expression of Casein genes in mammary tissue of WT and ΔSE mice at day 6 of pregnancy (p6) was analyzed by RNA-seq (WT, n = 3; ΔSE, n = 4). Results are shown as the means ± SEM of independent biological replicates. p-values are from 2-way ANOVA followed by Sidak’s multiple comparisons test between WT and mutants. ****p < 0.0001. e Genomic characteristics of the Casein locus were determined by ChIP-seq for STAT5 and H3K27ac in WT and ΔSE tissues at p6. Source data are provided as a Source Data file.
Fig. 3
Fig. 3. Salivary-specific activation of selected genes in the Casein locus by the super-enhancer.
a Expression of the five Casein genes, Odam and Fdcsp genes was measured by RNA-seq in salivary tissue from ΔSE mice (n = 3). Results are shown as the means ± SEM of independent biological replicates. p-values are from 2-way ANOVA followed by Sidak’s multiple comparisons test between WT and mutants. **p < 0.01, ****p < 0.0001. b ChIP-seq analysis shows the H3K27ac and Pol II landscapes in salivary tissue from WT mice and mice lacking the super-enhancer (ΔSE). The red shade indicates the super-enhancer (SE). The red shade indicates the super-enhancer. The Cish locus served as ChIP-seq control. MG, mammary gland at day one of lactation (L1). Source data are provided as a Source Data file.
Fig. 4
Fig. 4. Distance-dependent function of the super-enhancer.
a Odam and Csn3 mRNA levels were measured by qRT-PCR in lactating mammary tissues (day one of lactation, L1), from WT mice and mutant mice after deletion of the Odam gene (ΔOdam) (normalized to Gapdh levels). Results are shown as the means ± SEM of independent biological replicates (n = 3). 2-way ANOVA followed by Sidak’s multiple comparisons test was used to evaluate the statistical significance of differences in WT and mutants. ****p < 0.0001. b mRNA levels of salivary expressed gene in the Casein locus were measured by RNA-seq (n = 3). c, d Genomic features of the Odam-Csn3 locus were characterized by ChIP-seq in lactating mammary (day one of lactation, L1) (c) and salivary (d) tissues from WT and ΔOdam mutant mice. The red shade indicates the super-enhancer (SE). The Cish locus served as ChIP-seq control. Source data are provided as a Source Data file.
Fig. 5
Fig. 5. Super-enhancer-dependent local enhancers activate Csn3 expression.
a The presence of H3K27ac and H3K4me1 marks in mammary glands of wild-type mice at day one of lactation (L1) indicates a distal candidate enhancer (Csn3-E1) at −7 kbp and a proximal one (Csn3-E2) at −0.6 kbp. The yellow shade indicates the enhancers. The diagram shows the enhancer deletions introduced in mice using CRISPR/Cas9 genome engineering. Red and orange circles indicate the GAS motif and NFIB binding sites. b Csn3 mRNA levels were measured by qRT-PCR in pregnancy day 18 (p18) mammary tissue from WT mice and mice lacking the Csn3 distal enhancer (ΔE1) and Csn3 proximal enhancer (ΔE2) and normalized to Gapdh levels. Results are shown as the means ± SEM of independent biological replicates (n = 3). Two-tailed t-test with Welch’s correction was used to evaluate the statistical significance of differences between WT and each mutant mouse line. *p < 0.05, ****p < 0.00001. c Genomic features of the entire Csn locus were investigated by ChIP-seq in lactating mammary tissue (collected within 12 h post-partum (pp <12 h)) of WT, ΔE1, ΔE2-S and ΔE2-S/N mice. The red shade indicates the super-enhancer (SE). The Cish locus served as ChIP-seq control. Source data are provided as a Source Data file.
Fig. 6
Fig. 6. Csn1s1 gene expression is modulated by a proximal enhancer.
a The candidate Csn1s1 enhancers were identified by ChIP-seq for TFs and activating histone marks at day one of lactation (L1). The yellow shade indicates the enhancers. The diagram shows the deletions introduced in the mouse genome using CRISPR/Cas9 genome engineering. Red circles indicate Csn1s1 enhancers. b Csn1s1 mRNA levels in lactating mammary tissues (day one of lactation, L1) from WT and mutant mice were measured by qRT-PCR and normalized to Gapdh levels. Results are shown as the means ± SEM of independent biological replicates (n = 5). Two-tailed t-test with Welch’s correction was used to evaluate the statistical significance of differences between WT and each mutant mouse line. ***p < 0.0001. c The Casein locus was profiled using ChIP-seq in WT and Csn1s1-E1 and E2 mutant tissues at day one of lactation (L1). The red shade indicates the super-enhancer (SE). The Cish locus served as ChIP-seq control. Source data are provided as a Source Data file.
Fig. 7
Fig. 7. Activity of putative Csn2 enhancers.
a Chromatin features of the Csn2-Csn1s2a locus were mapped by ChIP-seq for mammary transcription factors (TF) and activating histone marks at day one of lactation (L1). The presence of H3K27ac and H3K4me1 marks indicated three candidate enhancers, E1 at −6 kb, E2 at −25 kb and E3 at −35 kb. The yellow and blue shades indicate the enhancers and promoters, respectively. The diagram shows the enhancer deletions introduced in mice using CRISPR/Cas9 genome engineering. Red circles indicate Csn2 enhancers. b Expression of the Csn2 gene was measured in lactating mammary tissue (day one of lactation, L1) from WT and mutant mice carrying enhancer deletions by qRT-PCR and normalized to Gapdh levels. Results are shown as the means ± SEM of independent biological replicates (WT, ΔE2/3, ΔE1/2/3, n = 4; ΔE1, n = 3). 2-way ANOVA followed by Dunnett’s multiple comparisons test was used to evaluate the statistical significance of differences between WT and each mutant mouse line. *p < 0.05. c ChIP-seq analysis shows the chromatin structure of the Csn2 locus in lactating mammary tissue (day one of lactation, L1) of WT and mutant mice. The Cish locus served as ChIP-seq control. Source data are provided as a Source Data file.
Fig. 8
Fig. 8. Synergy between promoter-based cytokine-response elements and distal enhancers.
a The Csn2 promoter region was characterized through ChIP-seq for STAT5, activating histone marks and Pol II loading at day one of lactation. The yellow and blue shades indicate the enhancers and promoters, respectively. The diagram shows the enhancer deletions and promoter mutations introduced in the mouse genome using CRISPR/Cas9 genome engineering and deaminase base editing, respectively. Red and yellow circles indicate Csn2 enhancers and promoters. b Csn2 mRNA levels were measured by RNA-seq in lactating mammary tissue (day one of lactation, L1) isolated from WT mice and mice carrying disabling mutations in the two GAS motifs in Csn2 promoter (ΔP) in the presence and absence of the three distal enhancers (ΔE1/2/3) (WT, ΔE1/2/3, ΔP-E1/2/3, n = 4; ΔP, n = 3). Results are shown as the means ± SEM of independent biological replicates. 2-way ANOVA followed by Dunnett’s multiple comparisons test was used to evaluate the statistical significance of differences between WT and each mutant mouse line. ***p < 0.0001, ****p < 0.00001. c Chromatin features of the Csn2 locus were investigated by ChIP-seq in lactating mammary tissue (day one of lactation, L1) of WT, ΔE1/2/3, ΔP and ΔP-E1/2/3 mice. The Cish locus served as ChIP-seq control. Source data are provided as a Source Data file.
Fig. 9
Fig. 9. Model for the regulation of the shared casein mammary-salivary locus by a dual specific super-enhancer, gene-specific local enhancers and promoters.
a Heatmap shows relative gene expression levels of genes in the Casein locus in the various mutant mice compared to WT mice at day 18 of pregnancy (p18) or day one of lactation (L1). DE distal enhancer. The data from the Csn2, Csn3 and ΔSE mice are from this study, and the Csn1s2b mutant has been reported earlier. b The super-enhancer preferentially activates the Csn1s2b, Csn3 and Odam genes and marginally the Csn1s1, Csn2 and Csn1s2a genes in mammary gland during pregnancy and regulates the promoters of Odam, Fdcsp and Csn3 genes in salivary gland tissue. c The Csn2 gene is characterized by distinct enhancer and promoter elements, both harboring STAT5 binding sites (GAS motifs) that are bound by STAT5 during lactation. Individually, neither the enhancers nor the promoter STAT5 sites are absolutely required for efficient gene activation, suggesting that they can partially compensate for each other’s activity. Combined inactivation of the distal enhancers and the promoter STAT5 site completely abrogates Csn2 expression suggesting synergism during pregnancy and lactation. Also, neighboring mammary genes are not impacted by the Csn2 enhancer and promoter elements. This distinguishes them from Epromoters, that bind STAT TFs and have been identified in interferon-response genes. In addition to their own native gene, Epromoters also control the expression of neighboring genes. Neither Epromoter-associated genes nor neighboring genes harbor classical distal enhancers. The graphs were created with BioRender.com. Source data are provided as a Source Data file.

Update of

Similar articles

Cited by

References

    1. Oftedal OT. The mammary gland and its origin during synapsid evolution. J. Mammary Gland Biol. Neoplasia. 2002;7:225–252. - PubMed
    1. Kawasaki K, Buchanan AV, Weiss KM. Biomineralization in humans: making the hard choices in life. Annu. Rev. Genet. 2009;43:119–142. - PubMed
    1. Kawasaki K. The SCPP gene family and the complexity of hard tissues in vertebrates. Cells Tissues Organs. 2011;194:108–112. - PubMed
    1. Hennighausen LG, Sippel AE. Characterization and cloning of the mRNAs specific for the lactating mouse mammary gland. Eur. J. Biochem. 1982;125:131–141. - PubMed
    1. Rijnkels M, Elnitski L, Miller W, Rosen JM. Multispecies comparative analysis of a mammalian-specific genomic domain encoding secretory proteins. Genomics. 2003;82:417–432. - PubMed