. 2023 Aug 17;14(1):5009.
doi: 10.1038/s41467-023-40763-3.

Thin, soft, wearable system for continuous wireless monitoring of artery blood pressure

Affiliations

Thin, soft, wearable system for continuous wireless monitoring of artery blood pressure

Jian Li et al. Nat Commun. .

Abstract

Continuous monitoring of arterial blood pressure (BP) outside of a clinical setting is crucial for preventing and diagnosing hypertension related diseases. However, current continuous BP monitoring instruments suffer from either bulky systems or poor user-device interfacial performance, hampering their applications in continuous BP monitoring. Here, we report a thin, soft, miniaturized system (TSMS) that combines a conformal piezoelectric sensor array, an active pressure adaptation unit, a signal processing module, and an advanced machine learning method, to allow real wearable, continuous wireless monitoring of ambulatory artery BP. By optimizing the materials selection, control/sampling strategy, and system integration, the TSMS exhibits improved interfacial performance while maintaining Grade A level measurement accuracy. Initial trials on 87 volunteers and clinical tracking of two hypertension individuals prove the capability of the TSMS as a reliable BP measurement product, and its feasibility and practical usability in precise BP control and personalized diagnosis schemes development.


Conflict of interest statement

The authors declare no competing interests.

Figures

Fig. 1
Fig. 1. Working principle and layouts of the wearable wireless continuous blood pressure monitoring system.
a Schematic diagram of signal conversion from piezo response to continuous blood pressure that is presented in a mobile graphic user interface (GUI). Physical distance between two sampling sites and time difference in two sensing units were utilized to calculate localized pulse wave velocity (PWV). Pulse wave features, together with localized PWV were transmitted to data for the estimation of beat-to-beat blood pressure (BP). b Explosive view of the wireless wristband, with three subsystems, sensing module, where the top surface and bottom surface of piezoelectric material lead zirconate titanate (PZT) are connected to top and bottom electrode, and top electrode is routed to bottom electrode by a vertical interconnect access (VIA), force generation module and signal processing module. c Optical image of the wireless wristband worn on user’s wrist joint. d Optical image of all the system components before sealed in the silicone wristband. e and f Optical images of the sensor array and micro airbag array suffering from mechanical deformations. g Technical comparison between our device and published works utilizing Photoplethysmography (PPG), ultrasound wall tracking, bioimpedance (Bio-Z), and capacitive sensor for continuous BP monitoring in terms of wearability, accuracy, dynamics, continuance and wireless.
Fig. 2
Fig. 2. Device characterization and signal analysis.
a Schematic illustration of the wireless wristband worn on the wrist, where the airbag provide backpressure to effectively increase the mechanical deformation of the sensor array generated from blood propogation. b The pressure in airbag under five pumping phases with pumping duration at 35 ms. With the one-way valve utilized, the pressure in the airbag maintains after the pump is turned off, and the pressure increase to 12 KPa after 5 pumping phases. c FEA results and corresponing optimal images present the coutour of the airbag under different inner pressure, 1 KPa and 10 KPa. d Optical images of the sensor array mounting on wrist and elbow joints under different deformation. e Measured peizo response of a sensing unit from radial artery and brachial artery under 0–45° bending deformations. f Schematic illustration of the blood propogration and generated piezo response. g Converted pulse waveform from the piezo response in (e) based the mathematical model illustrated in (f). h Illustration of the calculation of time difference between two sensing units from their piezo response. i Measured pulse wave on radial artery before and after exercise, and corresponding localized PWV.
Fig. 3
Fig. 3. Performance evaluation of the data model for continuous BP estimation.
a Illustration of the extracted pulse wave features, including systolic time span (ST) and diastolic time span (DT) and physiological features (b) in the estimation model. c Scatter plot of systolic blood pressure (SBP) and diastolic blood pressure (DBP) from 10 volunteers with wide dynamic BP range, which is necessary for accurate estimation of BP in a wide range. d Performance comparison in SBP of different estimation algorithms, including Support Vector Regression (SVR), Adaptive Boosting (AdaBoost), K-Nearest Neighbors (KNN), eXtreme Gradient Boosting (XGBoost) utilized in this work (oval with white background) and other works, PPG, Bio-Z,, Resistive pressure sensor, under the IEEE standard for wearable BP monitoring devices. e Model performance evaluation of SBP in a week after calibration (n = 3 tests on the same volunteer; center, mean; error bars, s.d.). f Optical images presenting the calibration process, with finger cuff of BioPAC system on the left hand, and wirelessed wristband on the right wrist joint. g Trainning and validation process showing a over 10 min trainning process, followed by 10 min and validation process.
Fig. 4
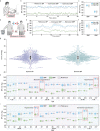
Fig. 4. Performance evaluation of the wireless wristband for continuous BP monitoring.
a Schematic illustration of continuous blood pressure (BP) monitoring in an office scene with the wireless wristband. b Performance validation of estimated BP (Est. BP), including systolic blood pressure (SBP) and diastolic blood pressure (DBP), in comparison with reference BP (ref. BP) measured by commercial continuous noninvasive artery pressure (CNAP) monitoring system, for 25 min. c Statistical plots present the comparison between our wireless wristband and BioPAC system in SBP and DBP. d Schematic illustration of hand grip and cold pressor process (HGCP) process for producing a wide range of dynamic BP. Volunteer’s hand is immersed in cold water (4 °C) for 2 min, followed by hand grip exercise for 2 min to increase BP. e Predicted SBP and DBP in comparison with Bio-PAC during three HGCP cycles. f Statistical plots present the comparison between our wireless wristband and CNAP system in SBP and DBP during HGCP cycles. g Violin plots representing the BP measurement accuracy of the TSMS compared with commercial CNAP in a total number of 87 volunteers (n = 87 volunteers with 39 male and 48 female involved. Circle point, median; central box limits, upper and lower quartiles; whiskers, upper and lower adjacent values, equal to 1.5 × interquartile range; outline, density plots with width equals to frequency; points, data points). h and i Statistical comparison of BP measured by the wireless wristband and measured by commercial cuff-based monitor in a total number of 17 volunteers, divided into 4 age groups (h) and 3 BMI groups (i). n = 250 BP data points in box plots of (c and f), n = 80 BP data points in the box plots of (h and i). Square, mean; center line, median; box limits, upper and lower quartiles; whiskers, 1.5 × interquartile range; points, data points, in box plots of (c, f, h, and i).

References

    1. Nabel EG. Cardiovascular Disease. N. Engl. J. Med. 2003;349:60–72. doi: 10.1056/NEJMra035098. - DOI - PubMed
    1. Mani V, et al. Multiplexed sensing techniques for cardiovascular disease biomarkers - A review. Biosens. Bioelectron. 2022;216:114680. doi: 10.1016/j.bios.2022.114680. - DOI - PubMed
    1. Mahajan S, et al. Relationship of Age With the Hemodynamic Parameters in Individuals With Elevated Blood Pressure. J. Am. Geriatr. Soc. 2020;68:1520–1528. doi: 10.1111/jgs.16411. - DOI - PubMed
    1. Akselrod S, et al. Hemodynamic regulation: investigation by spectral analysis. Am. J. Physiol.-Heart Circ. Physiol. 1985;249:H867–H875. doi: 10.1152/ajpheart.1985.249.4.H867. - DOI - PubMed
    1. Ahmed SN, Syed FM, Porembka DT. Echocardiographic evaluation of hemodynamic parameters. Crit. Care Med. 2007;35:S323. doi: 10.1097/01.CCM.0000270242.03536.D3. - DOI - PubMed

Publication types