. 2023 Aug 17;14(1):4987.
doi: 10.1038/s41467-023-40597-z.

p21-activated kinase 4 suppresses fatty acid β-oxidation and ketogenesis by phosphorylating NCoR1

Affiliations

p21-activated kinase 4 suppresses fatty acid β-oxidation and ketogenesis by phosphorylating NCoR1

Min Yan Shi et al. Nat Commun. .

Erratum in

Abstract

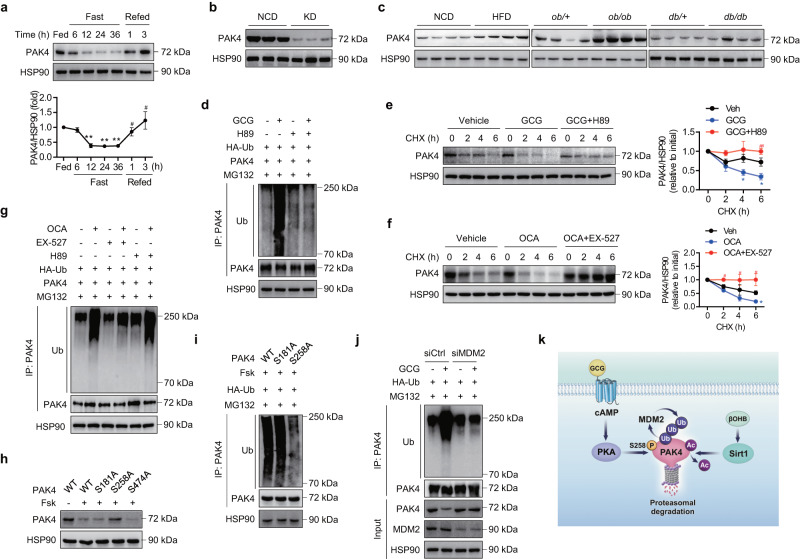
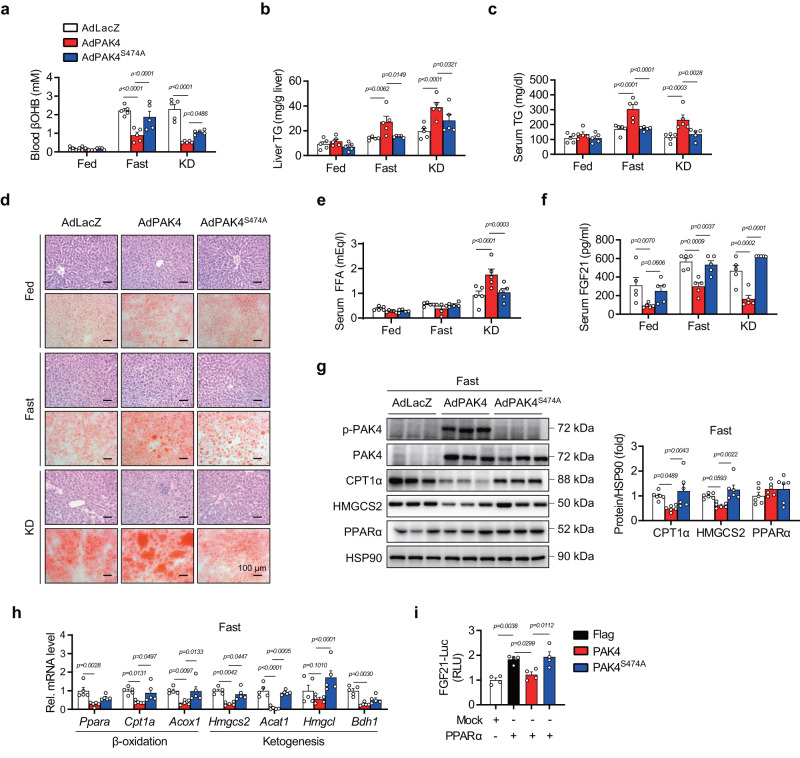
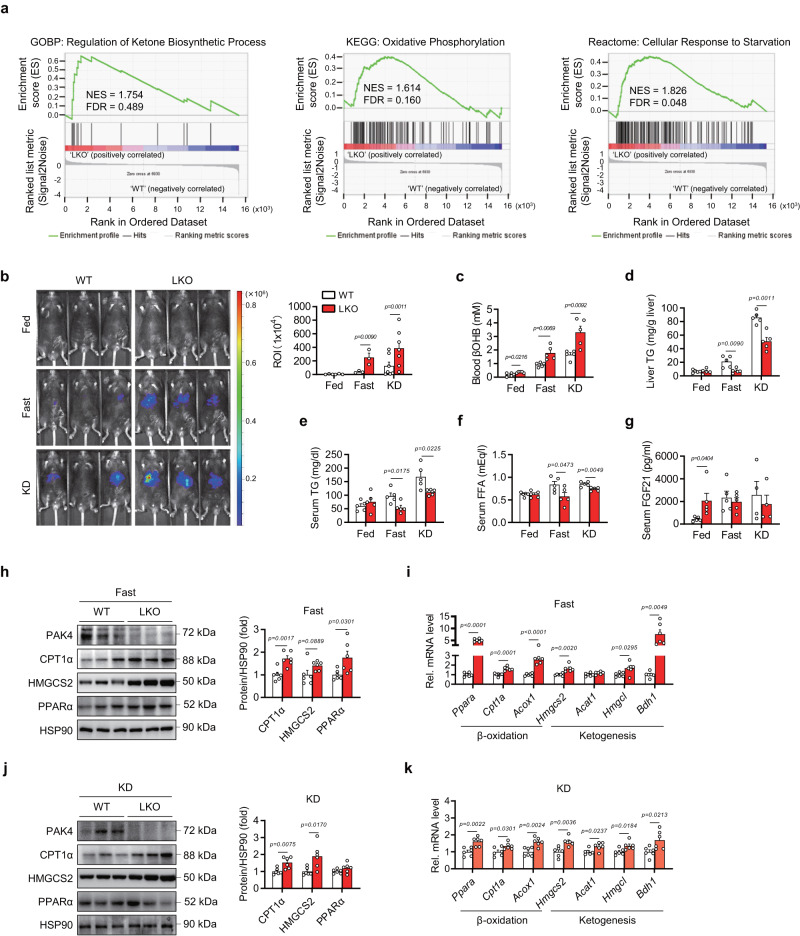
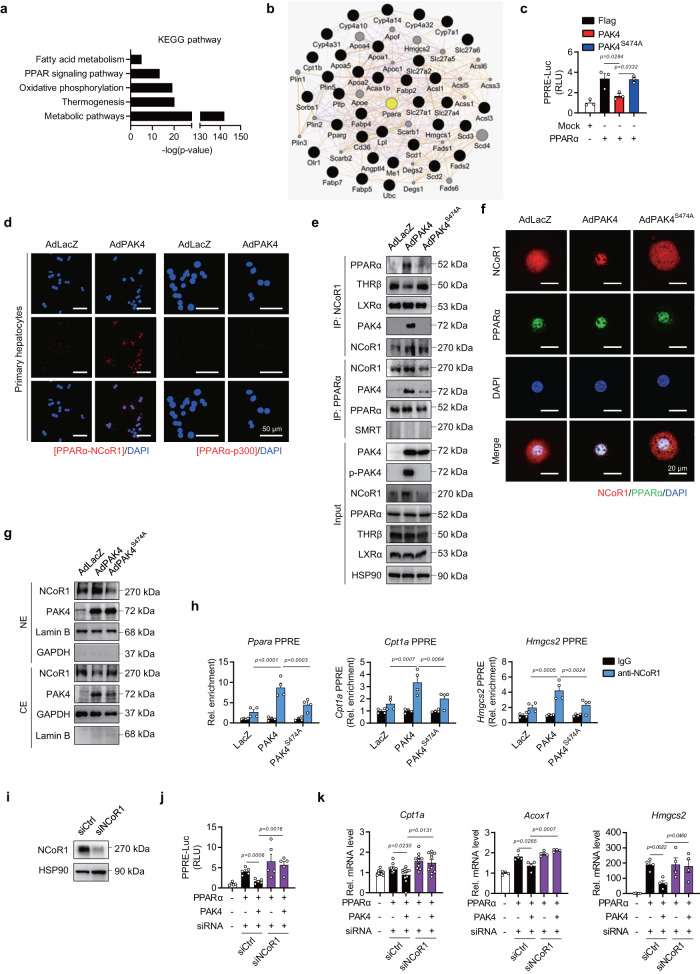
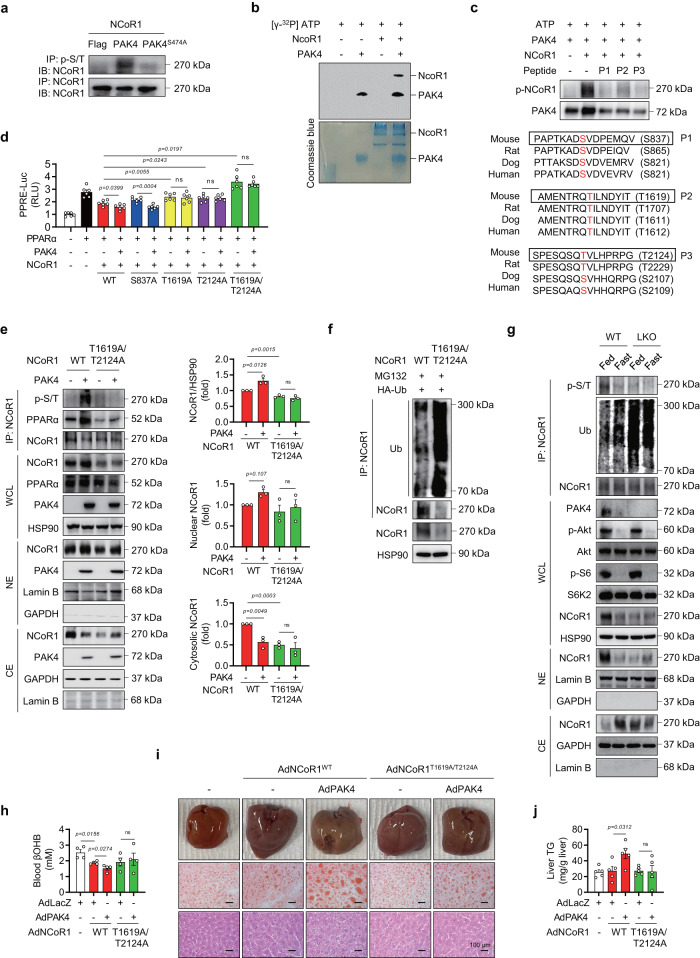
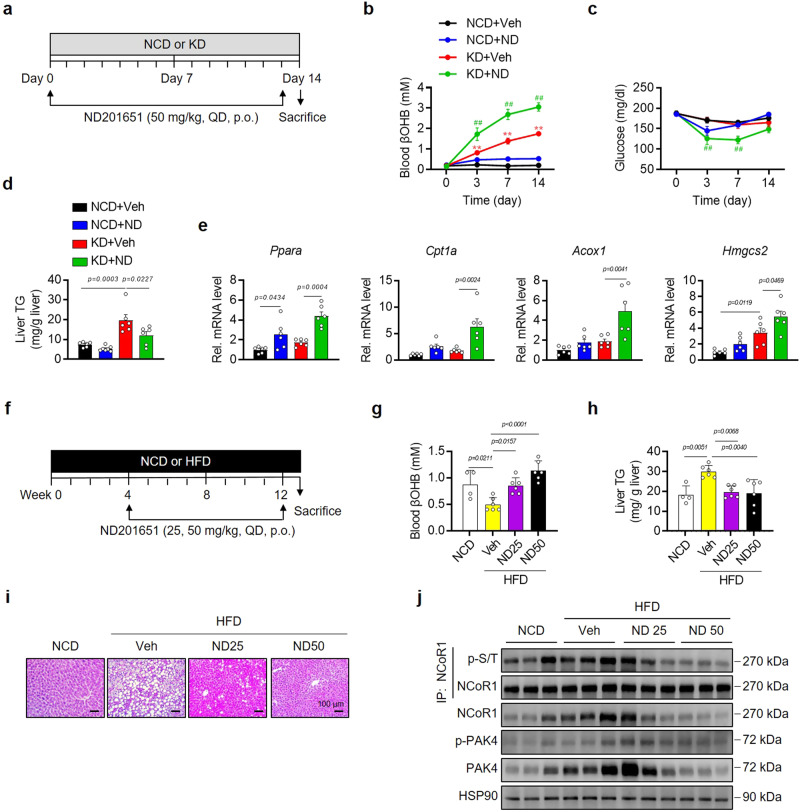
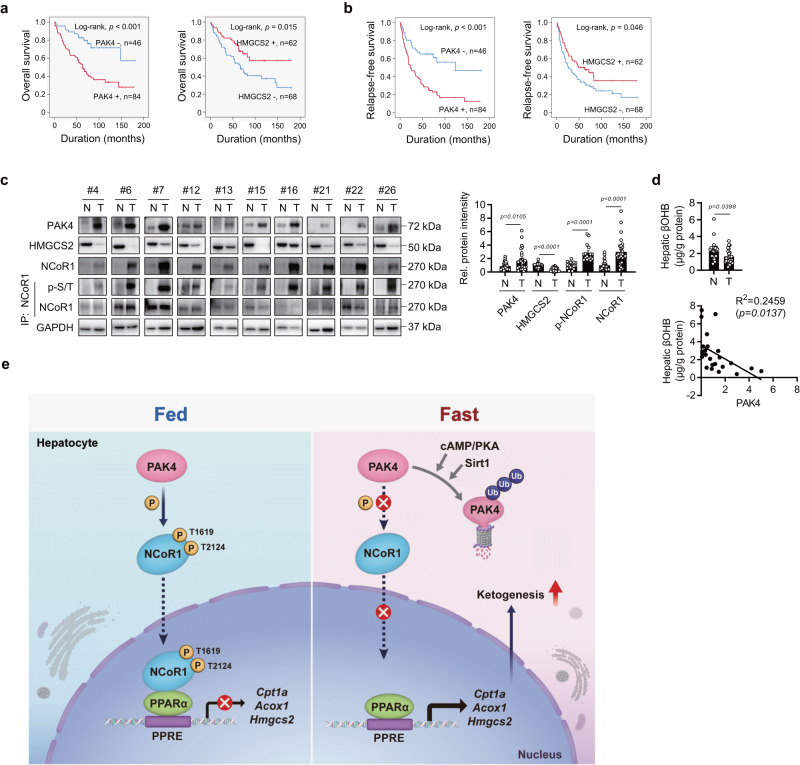
PPARα corepressor NCoR1 is a key regulator of fatty acid β-oxidation and ketogenesis. However, its regulatory mechanism is largely unknown. Here, we report that oncoprotein p21-activated kinase 4 (PAK4) is an NCoR1 kinase. Specifically, PAK4 phosphorylates NCoR1 at T1619/T2124, resulting in an increase in its nuclear localization and interaction with PPARα, thereby repressing the transcriptional activity of PPARα. We observe impaired ketogenesis and increases in PAK4 protein and NCoR1 phosphorylation levels in liver tissues of high fat diet-fed mice, NAFLD patients, and hepatocellular carcinoma patients. Forced overexpression of PAK4 in mice represses ketogenesis and thereby increases hepatic fat accumulation, whereas genetic ablation or pharmacological inhibition of PAK4 exhibites an opposite phenotype. Interestingly, PAK4 protein levels are significantly suppressed by fasting, largely through either cAMP/PKA- or Sirt1-mediated ubiquitination and proteasome degradation. In this way, our findings provide evidence for a PAK4-NCoR1/PPARα signaling pathway that regulates fatty acid β-oxidation and ketogenesis.


Conflict of interest statement

The authors declare no competing interests.

Figures

Fig. 1
Fig. 1. PAK4 protein levels are repressed by fasting.
a Eight-week-old male C57BL/6 mice were either fed a normal chow diet (NCD) ad libitum, fasted for 6–36 h, or refed for 1 or 3 h following a 36 h fast. Liver tissues were subjected to Western blotting to determine PAK4 protein levels (n = 3). **P < 0.01 versus fed; #P < 0.05 versus fasted for 36 h. b Eight-week-old male C57BL/6 mice were fed either a NCD or a ketogenic diet (KD) for 2 weeks, and hepatic PAK4 protein levels were analyzed. c Representative immunoblot images for PAK4 expression in liver tissue obtained from mice fed either a NCD or a 60% high-fat diet (HFD) for 16 weeks or from ob/ob or db/db mice and their control groups. d AML12 cells transfected with HA-Ub and PAK4 were treated with glucagon (GCG, 100 nM) for 12 h in the presence or absence of H89 (10 μM). Cell lysates were immunoprecipitated with anti-PAK4 antibody and immunoblotted with anti-ubiquitin (Ub) antibody. e, f Mouse primary hepatocytes were treated with glucagon (100 nM) with or without H89 (10 μM), or octanoate (OCA, 2 mM) with or without EX-527 (100 nM). Subsequently, the cells were treated with cycloheximide (CHX, 100 μg/ml) for the indicated time periods. The protein levels of PAK4 were compared (n = 3). *P < 0.05 versus vehicle (Veh); #P < 0.05 and ##P < 0.01 versus GCG or OCA. g Primary hepatocytes were treated with octanoate (2 mM) for 12 h in the presence or absence of H89 (10 μM) or EX-527 (100 nM). Cell lysates were immunoprecipitated with anti-PAK4 antibody and immunoblotted with anti-ubiquitin (Ub) antibody. h, i AML12 cells were transfected with wild-type (WT) or mutant PAK4 (S181A, S258A, or S474A) and then treated with forskolin (Fsk, 10 μM) for 12 h to compare protein degradation and ubiquitination of PAK4. j AML12 cells transfected with either control siRNA or siRNA targeting MDM2 were treated with glucagon (100 nM) for 12 h. Cell lysates were immunoblotted for indicated proteins or immunoprecipitated with anti-PAK4 antibody followed by immunoblotting with anti-ubiquitin (Ub) antibody. k Schematic summary of PKA- and Sirt1-mediated PAK4 degradation. Data are presented as the mean ± SEM. One-way ANOVA followed by Dunnett’s multiple comparisons test (a) and Tukey’s multiple comparisons test (e, f) were conducted for statistical analyses. Source data are provided as a Source Data file.
Fig. 2
Fig. 2. Forced overexpression of PAK4 in mouse liver attenuates ketogenic responses.
Eight-week-old male C57BL/6 mice were injected with adenoviruses expressing control (AdLacZ), PAK4 (AdPAK4), or kinase-inactive mutant PAK4S474A (AdPAK4S474A) and then fed a normal chow diet (NCD) ad libitum (Fed), fasted for 24 h (Fast), or fed a ketogenic diet (KD) for 2 weeks. ac Blood levels of βOHB (a) and TG levels in the liver (b) and serum (c) were compared (n = 5). d Representative microscopic images of hematoxylin & eosin (H&E, top)- or Oil red O (ORO, bottom)-stained liver tissue (scale bars, 100 µm). e, f Serum levels of free fatty acid (e, n = 5) and FGF21 (f, n = 5). g, h Western blotting (g, n = 6) and qPCR (h, n = 5) analyses of liver tissue obtained from fasted mice. i AML12 cells were co-transfected with PPARα expression plasmid, FGF21 promoter luciferase reporter plasmid, and the plasmids encoding PAK4 or PAK4S474A. FGF21-luciferase activities were measured and expressed as the fold change relative to Mock (n = 4). RLU relative luminescence unit. Data are presented as the mean ± SEM. One-way ANOVA followed by Tukey’s multiple comparisons test was conducted for statistical analyses (ac, ei). Source data are provided as a Source Data file.
Fig. 3
Fig. 3. Hepatocyte-specific PAK4 deficiency enhances ketogenic responses.
a Gene set enrichment analysis plots of RNA-Seq data. Eight-week-old male Pak4 LKO and WT mice were fasted for 24 h, and RNA samples from liver tissues were subjected to RNA-Seq. b Representative IVIS images of in vivo luciferase activity after injection with adenovirus expressing HMGCS2-luciferase in Pak4 LKO and WT mice (n = 3 for Fed and Fast groups and n = 7 for KD group). cg Pak4 LKO and WT mice were fed a normal chow ad libitum (Fed), fasted for 24 h (Fast), or fed a ketogenic diet (KD) for 2 weeks. Blood levels of βOHB (c, n = 5), TG levels in the liver (d, n = 5) and serum (e, n = 5), and serum levels of free fatty acid (f, n = 5) and FGF21 (g, n = 5 for Fed and Fast, n = 4 for KD) were compared. hk Western blotting analysis of liver tissue obtained from Pak4 LKO and WT mice after fasting (h, n = 6) or KD-feeding (j, n = 6), and qPCR analysis of liver tissue after fasting (i, n = 6) or KD-feeding (k, n = 6). Data are presented as the mean ± SEM. Unpaired two-tailed t test was conducted for statistical analyses (bk). Source data are provided as a Source Data file.
Fig. 4
Fig. 4. PAK4 suppresses PPARα transcriptional activity by physically interacting with PPARα and NCoR1.
a, b KEGG pathway analysis of the DEGs from RNA-Seq (a) and GeneMANIA analysis showing an association of PPARα with the identified PPAR signaling pathway genes (b). c AML12 cells were co-transfected with PPARα expression plasmid, a firefly luciferase gene under the control of three tandem PPAR response elements (PPRE), and the plasmids encoding PAK4 or PAK4S474A. PPRE-luciferase activities were measured and expressed as the fold change relative to Mock (n = 3). dg Primary hepatocytes were infected with the adenoviruses expressing control (AdLacZ), PAK4 (AdPAK4), or kinase-inactive mutant PAK4S474A (AdPAK4S474A), as indicated. PPARα binding to NCoR1 or p300 was analyzed with an in situ proximity ligation assay (PLA, d). Red fluorescent spots indicate that PPARα and NCoR1 are closely interacting (scale bars, 50 µm). Cell lysates were immunoprecipitated with the antibodies against NCoR1 or PPARα, followed by immunoblotting with anti-PPARα, anti-THRβ, anti-LXRα, anti-PAK4, anti-NCoR1, and anti-SMRT antibodies (e). Representative confocal microscopy images showing an increase of NCoR1 in the nucleus by PAK4 (f, scale bars, 20 µm). Nuclear (NE) and cytosolic extracts (CE) were analyzed for NCoR1 (g). h ChIP-qPCR assay assessing NCoR1 recruitment to the PPRE promoter regions of Ppara, Cpt1a, and Hmgcs2 in mouse livers (n = 4). ik AML12 were transfected with siRNA against NCoR1 (siNCoR1) or scrambled RNA (siCtrl) for 24 h, followed by transfection with the plasmids as indicated. Immunoblot images for NCoR1 (i), PPRE-luciferase activities (j, n = 5), and qPCR analysis (k) for Cpt1a (n = 10), Acox1, and Hmgcs2 (n = 4). Cpt1a carnitine palmitoyltransferase 1a, Acox1 acyl-CoA oxidase 1, Hmgcs2 3-hydroxy-3-methylglutaryl-CoA synthase 2, RLU relative luminescence unit. Data are presented as the mean ± SEM. One-way ANOVA followed by Tukey’s multiple comparisons test (c, h) and unpaired two-tailed t test (j, k) were conducted for statistical analyses. Source data are provided as a Source Data file.
Fig. 5
Fig. 5. PAK4 phosphorylates NCoR1.
a AML12 cells were transfected with the plasmids encoding PAK4 or PAK4S474A, along with NCoR1, as indicated. Phosphorylation of NCoR1 was analyzed by immunoblotting of NCoR1 after immunoprecipitation with a p-Ser/Thr antibody. b Recombinant NCoR1 was incubated with active PAK4 and [32P] ATP for 30 min at 31 °C. Proteins in the mixture were resolved by SDS-PAGE and visualized by autoradiography. Loading of proteins was confirmed by Coomassie blue staining. c In vitro peptide-competing kinase assay using synthetic oligopeptides comprising putative PAK4 target sites (P1: S837, P2: T1619, or P3: T2124) was performed. The diagram shows the sequence alignment of the putative phosphorylation sites of NCoR1 in various mammalian species. d PPRE-luciferase activities were measured in HEK293T cells co-transfected with PAK4, PPARα, and either wild-type (WT) or mutated NCoR1 (S837A, T1619A, T2124A, or T1619A/T2124A) (n = 6). e Co-IP and immunoblot analysis in HEK293T cells after co-transfection of NCoR1 (WT or T1619A/T2124A) and PAK4. Whole-cell lysates (WCL), nuclear extracts (NE), and cytosolic extracts (CE) were analyzed for NCoR1 protein levels and quantified (n = 3). f Ubiquitination of NCoR1 in HEK293T cells after co-transfection of HA-Ub and NCoR1 (WT or T1619A/T2124A). g Phosphorylation and ubiquitination of NCoR1 were analyzed in liver tissues from fed- or 24 h-fasted Pak4 LKO or WT mice. Protein levels of the indicated proteins were also analyzed in the WCL, NE, and CE. hj Eight-week-old male C57BL/6 mice were injected with either adenoviruses expressing NCoR1 (AdNCoR1WT or AdNCoR1T1619A/T2124A), PAK4 (AdPAK4), or LacZ (AdLacZ), and were subsequently fasted for 24 h. Blood levels of βOHB (h, n = 4), gross liver morphology, and microscopic analysis (Oil Red O and H&E stain) of liver tissues (i, scale bars, 100 µm), as well as TG levels in the liver (j, n = 5), were compared. RLU relative luminescence unit, ns no significance. Data are presented as the mean ± SEM. Unpaired two-tailed t test was conducted for statistical analyses (d, e, h, j). *P < 0.05 and **P < 0.01. Source data are provided as a Source Data file.
Fig. 6
Fig. 6. PAK4 inhibitor ND201651 enhances ketogenesis in mice.
a, f Schematic diagrams illustrating the drug administration and the diet regimen in eight-week-old male C57BL/6 mice. Mice were orally given ND201651 (ND) once daily (QD) for 14 days (a) or 8 weeks (f) while fed a normal chow (NCD), ketogenic diet (KD), or high-fat diet (HFD). b, c Fed blood levels of βOHB (b, n = 7) and glucose (c, n = 7) were monitored at the indicated time points. **P < 0.01 versus NCD+Veh; and ##P < 0.01 versus KD+Veh. d, e Hepatic TG contents (d, n = 6) and qPCR analysis of β-oxidation and ketogenesis genes (e, n = 6) were assessed on day 14. gj Blood levels of βOHB (g), hepatic TG levels (h) (g, h, n = 4 for NCD and n = 6 for HFD), hematoxylin & eosin (H&E) staining of liver sections (i, scale bars, 100 µm), and Western blotting analysis for the indicated proteins in liver tissues (j). Data are presented as the mean ± SEM. One-way ANOVA followed by Tukey’s multiple comparisons test (be, g, h) were conducted for statistical analyses. Source data are provided as a Source Data file.
Fig. 7
Fig. 7. Tumor overexpression of PAK4 is associated with reduced ketogenesis in hepatocellular carcinoma (HCC) patients.
a, b Kaplan–Meier survival curves are shown for overall survival (OS, a) and relapse-free survival (RFS, b) based on the expression of PAK4 and HMGCS2 in HCC patients. c Immunoblot analysis was performed for the indicated proteins in non-tumor (N) and tumor (T) liver tissues obtained from HCC patients (n = 30). NCoR1 phosphorylation was analyzed by immunoblotting with anti-p-Ser/Thr antibody following immunoprecipitation with anti-NCoR1 antibody. Protein density was quantified. d βOHB levels were measured in non-tumor and tumor liver tissues (n = 23). e The proposed summary is presented. Data are presented as the mean ± SEM. The survival of HCC patients was analyzed with univariate and multivariate Cox proportional hazards regression analyses and Kaplan–Meier survival analysis (a, b). Unpaired two-tailed t test was conducted for statistical analyses (c, d). Pearson correlation coefficients were calculated between continuous variables (d). Source data are provided as a Source Data file.

References

    1. Puchalska P, Crawford PA. Metabolic and signaling roles of ketone bodies in health and disease. Annu. Rev. Nutr. 2021;41:49–77. doi: 10.1146/annurev-nutr-111120-111518. - DOI - PMC - PubMed
    1. Rodriguez JC, Gil-Gomez G, Hegardt FG, Haro D. Peroxisome proliferator-activated receptor mediates induction of the mitochondrial 3-hydroxy-3-methylglutaryl-CoA synthase gene by fatty acids. J. Biol. Chem. 1994;269:18767–18772. doi: 10.1016/S0021-9258(17)32234-2. - DOI - PubMed
    1. Hashimoto T, et al. Defect in peroxisome proliferator-activated receptor α-inducible fatty acid oxidation determines the severity of hepatic steatosis in response to fasting. J. Biol. Chem. 2000;275:28918–28928. doi: 10.1074/jbc.M910350199. - DOI - PubMed
    1. Kersten S, et al. Peroxisome proliferator-activated receptor α mediates the adaptive response to fasting. J. Clin. Investig. 1999;103:1489–1498. doi: 10.1172/JCI6223. - DOI - PMC - PubMed
    1. Longuet C, et al. The glucagon receptor is required for the adaptive metabolic response to fasting. Cell Metab. 2008;8:359–371. doi: 10.1016/j.cmet.2008.09.008. - DOI - PMC - PubMed

Publication types