. 2023 Aug 17;14(1):5003.
doi: 10.1038/s41467-023-40779-9.

C16orf72/HAPSTR1/TAPR1 functions with BRCA1/Senataxin to modulate replication-associated R-loops and confer resistance to PARP disruption

Affiliations

C16orf72/HAPSTR1/TAPR1 functions with BRCA1/Senataxin to modulate replication-associated R-loops and confer resistance to PARP disruption

Abhishek Bharadwaj Sharma et al. Nat Commun. .

Erratum in

Abstract

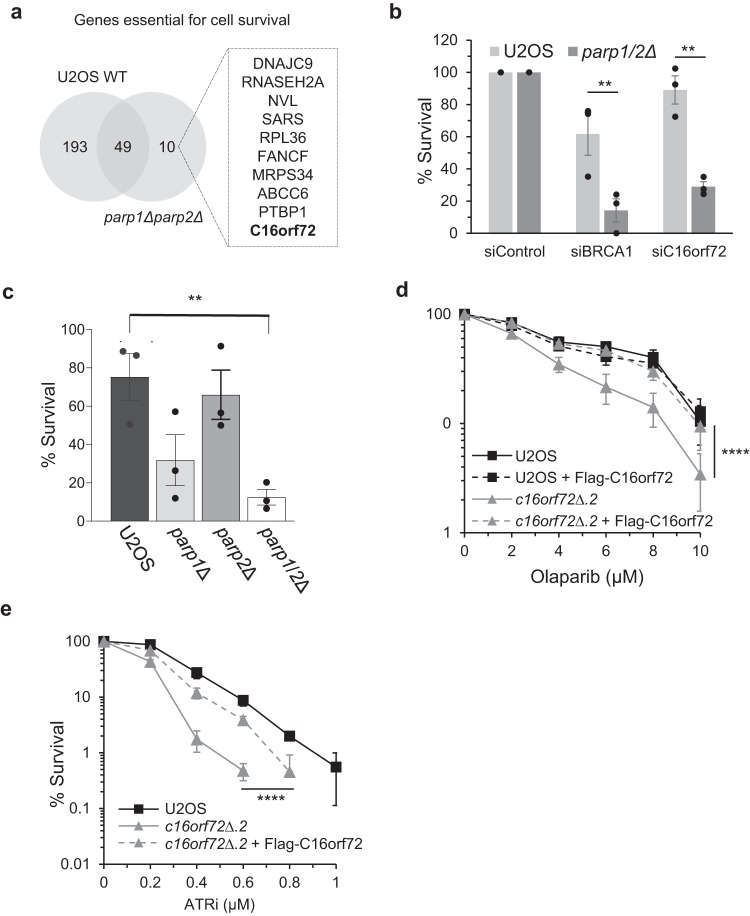
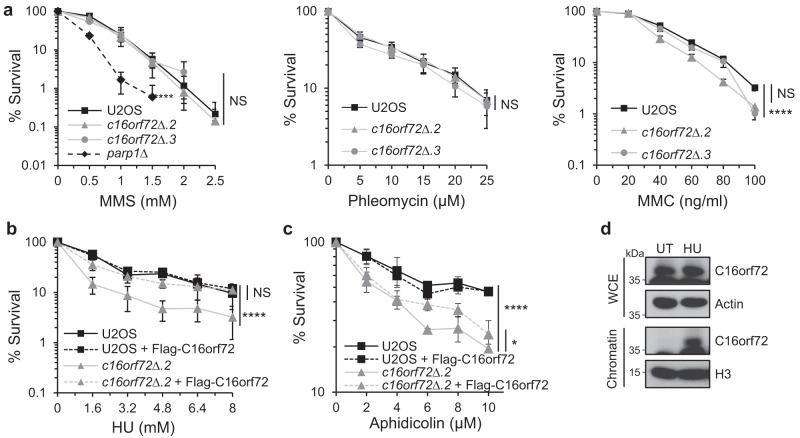
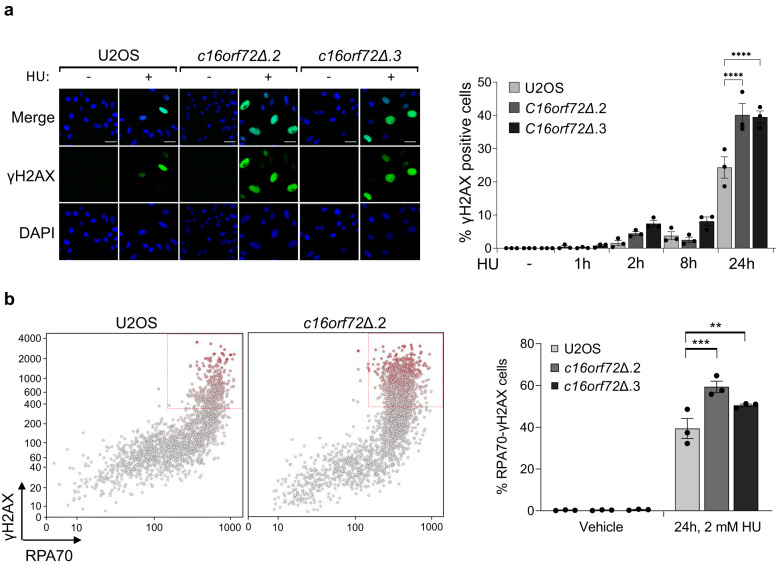
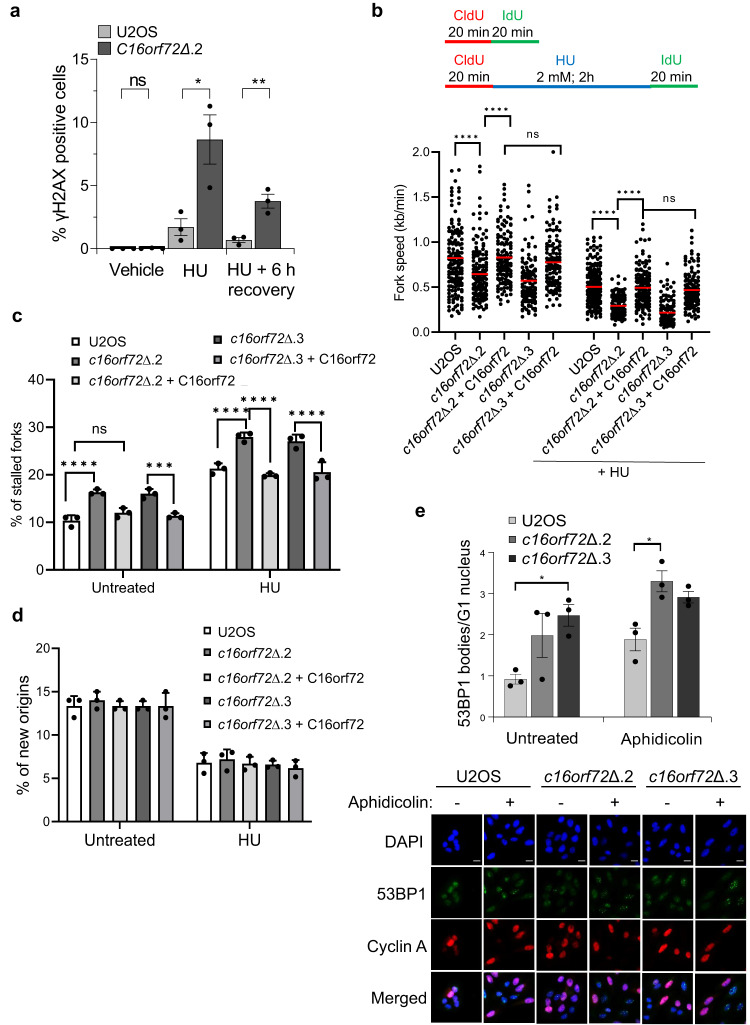
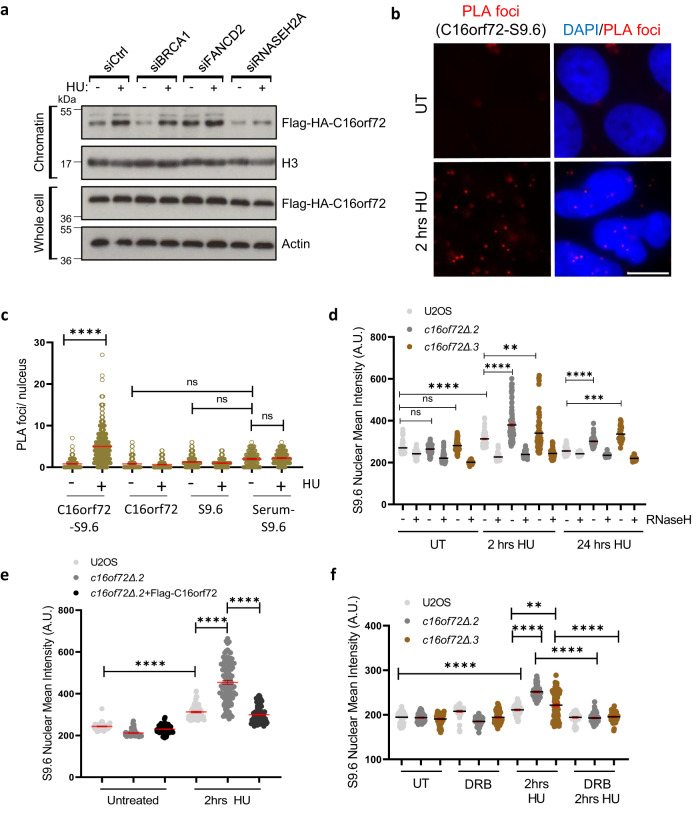
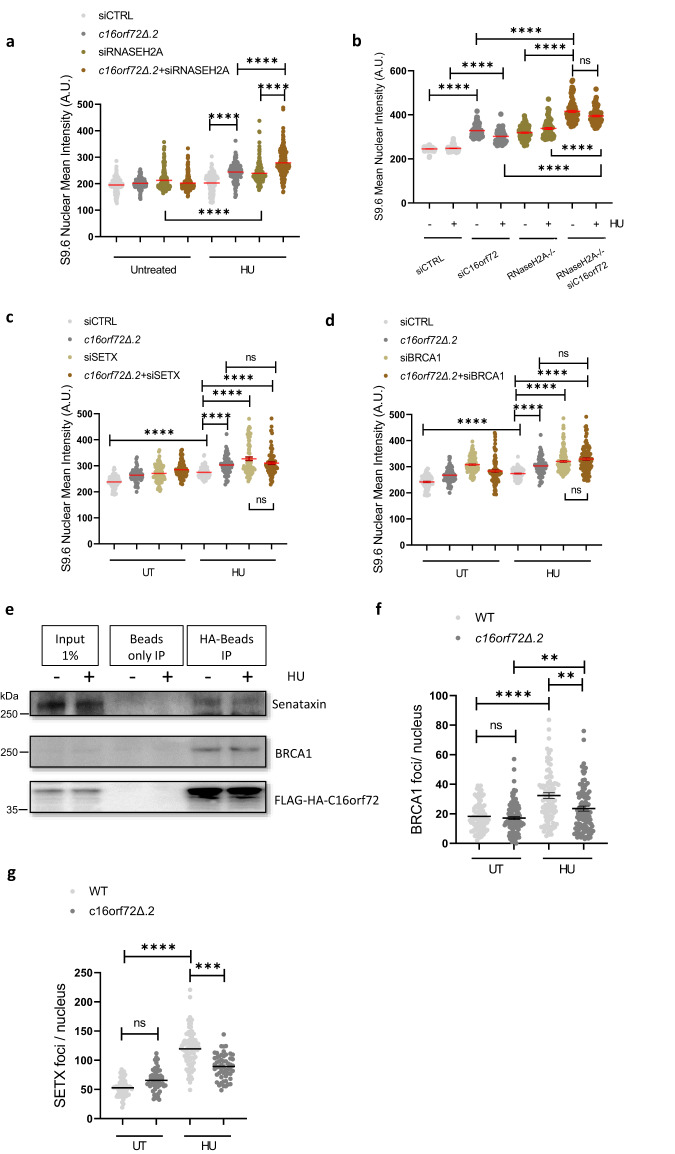
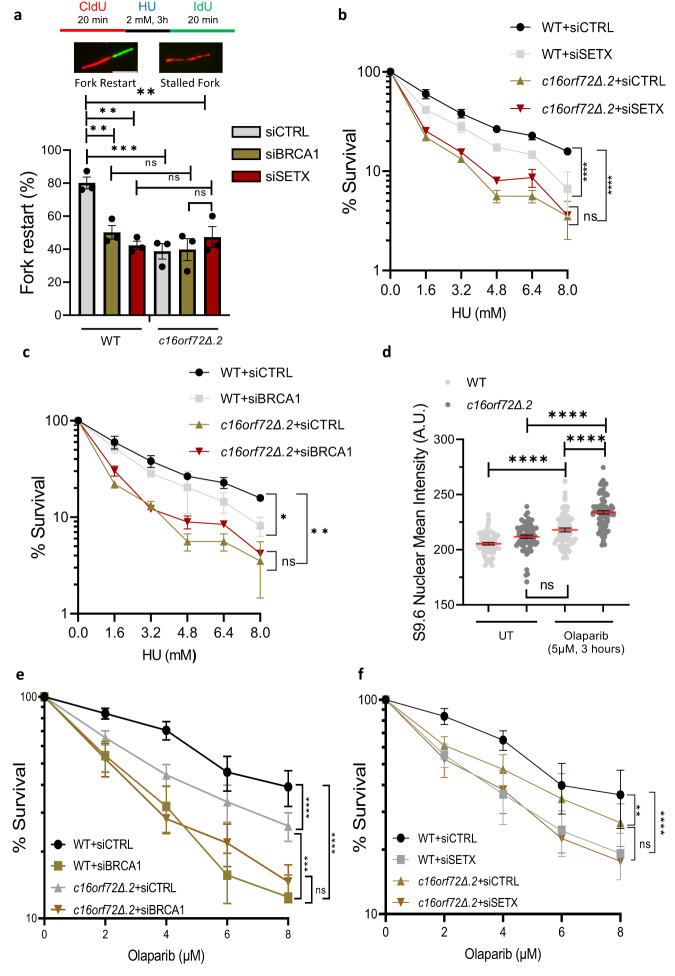
While the toxicity of PARP inhibitors to cells with defects in homologous recombination (HR) is well established, other synthetic lethal interactions with PARP1/PARP2 disruption are poorly defined. To inform on these mechanisms we conducted a genome-wide screen for genes that are synthetic lethal with PARP1/2 gene disruption and identified C16orf72/HAPSTR1/TAPR1 as a novel modulator of replication-associated R-loops. C16orf72 is critical to facilitate replication fork restart, suppress DNA damage and maintain genome stability in response to replication stress. Importantly, C16orf72 and PARP1/2 function in parallel pathways to suppress DNA:RNA hybrids that accumulate at stalled replication forks. Mechanistically, this is achieved through an interaction of C16orf72 with BRCA1 and the RNA/DNA helicase Senataxin to facilitate their recruitment to RNA:DNA hybrids and confer resistance to PARP inhibitors. Together, this identifies a C16orf72/Senataxin/BRCA1-dependent pathway to suppress replication-associated R-loop accumulation, maintain genome stability and confer resistance to PARP inhibitors.


Conflict of interest statement

The authors declare no competing interests.

Figures

Fig. 1
Fig. 1. Depletion of C16orf72 is synthetic lethal with disruption of PARPs.
a A genome-wide CRISPR screen identified C16orf72 as one of ten genes whose disruption negatively affected the survival of PARP1/PARP2 double knock-out cells (parp1Δparp2Δ) as compared to wild-type U2OS cells. b Clonogenic survival assay of wild-type U2OS and parp1/2Δ cells treated with siRNA targeting C16orf72. Treatment with non-targeting siRNA (siNT) and siRNA targeting BRCA1 act as negative and positive controls, respectively. c Clonogenic survival assay of wild-type U2OS, PARP1 knock-out (parp1∆), PARP2 knock-out (parp2∆) and PARP1/PARP2 double knock-out (parp1/2∆) cells transfected with siC16orf72. d Clonogenic survival assay of C16orf72 knock-out cells (c16orf72Δ.2) and complemented cells (c16orf72Δ.2 cells expressing Flag-C16orf72) treated with increasing concentration of Olaparib for 9 days. e Clonogenic survival assay of C16orf72 knock-out cells (c16orf72Δ.2) and complemented cells (c16orf72Δ.2 + Flag-C16orf72) treated with increasing concentration of ATRi for 9 days. For all clonogenic survival assay plots, mean values ± SEM of three independent biological repeats shown. Statistical analysis was performed using either a one-way ANOVA with a Bonferroni post-hoc analysis (b, c), or two-way ANOVA (d, e); *p < 0.05; **p < 0.01; ***p < 0.001; ****p < 0.0001. Source data are provided as a Source Data file.
Fig. 2
Fig. 2. C16orf72 is required for tolerance against replication stress.
a Clonogenic survival assay of C16orf72 knock-out cells (c16orf72Δ.2 and c16orf72Δ.3) treated with increasing concentration of methyl methanesulfonate (MMS) for 1 h (left), phleomycin for 1 h (middle) and mitomycin C (MMC) for 24 h (right). PARP1 knock-out cells (parp1Δ) were used as positive control for MMS sensitivity. b Clonogenic survival assay of C16orf72 knock-out cells (c16orf72Δ.2) and complemented cells (c16orf72Δ.2 expressing Flag-C16orf72) treated with increasing concentration of the replication stress-inducing agent, hydroxyurea (HU), for 24 h. c Clonogenic survival assay of C16orf72 knock-out cells (c16orf72Δ.2) and complemented cells (c16orf72Δ.2 + Flag-C16orf72) treated with increasing concentration of the replication stress-inducing agent aphidicolin, for 24 h. d Western blot analysis of C16orf72 protein in whole-cell extract (WCE) and chromatin-enriched fraction of U2OS cells treated with 2 mM hydroxyurea (HU) for 24 h. Extracts were prepared for untreated or HU-treated cells and western blotting performed with the indicated antibodies. Images are representative of 3 biological repeats. For all clonogenic survival assay plots, mean values ± SEM of 3 biological independent experiments are shown. Statistical analysis performed using two-way ANOVA with replication; *p < 0.05; **p < 0.01; ***p < 0.001; ****p < 0.0001. Source data are provided as a Source Data file.
Fig. 3
Fig. 3. C16orf72-depleted cells display elevated levels of DNA damage.
a Quantitative image-based cytometry (QIBC) of γH2AX levels in wild-type U2OS and C16orf72 knock-out cells (C16orf72Δ.2 and C16orf72Δ.3) treated with 2 mM hydroxyurea (HU) for 0, 1 h, 2 h, 8 h or 24 h. Left: representative images of γH2AX induction in the cells. Scale bar represents 20 µm. Right: Mean % γH2AX positive cells ± SEM of 3 biological independent experiments with at least 500 cells analysed per condition. b QIBC co-staining of γH2AX and RPA70 in wild-type U2OS and C16orf72 knock-out cells (c16orf72Δ.2 and c16orf72Δ.3) treated with 2 mM hydroxyurea (HU) for 24 h. Left: representative results of elevated γH2AX and RPA70 levels in c16orf72Δ.2 cells. Right: mean values ± SEM of 3 biological independent experiments. Statistical analysis from at least 3 independent experiments was performed using Ordinary one-way ANOVA with a Bonferroni post-hoc analysis; **p < 0.01; ****p < 0.0001. Source data are provided as a Source Data file.
Fig. 4
Fig. 4. Depletion of C16orf72 leads to replication stress.
a Immuno-fluorescence microscopy quantification of nuclear γH2AX intensity in wild-type U2OS and C16orf72 knock-out cells (c16orf72Δ.2) treated with 200 µM hydroxyurea (HU) for 24 h with or without 6 h recovery thereafter. Mean % γH2AX positive cells ± SEM of 3 biological independent experiments with at least 1500 cells analysed per condition. bd DNA fibre spreading analysis of wild-type U2OS and C16orf72∆ cells. U2OS, C16orf72∆ (c16orf72Δ.2 and c16orf72Δ.3) and C16orf72∆ cells complemented with Flag-C16orf72 (+ C16orf72) were left untreated, or exposed to 2 mM hydroxyurea (HU) for 2 h according to the schematic (upper panel). CldU/IdU labelling patterns and tract length were used to determine replication fork speed (b), percentage of DNA fibres with stalled forks (c) or new origins (d). Data presented are derived from 3 biological independent experiments. Mean values are represented +/− SEM. e Quantitative image-based cytometry (QIBC) of 53BP1 level in wild-type U2OS and C16orf72 knock-out cells (c16orf72Δ.2 and c16orf72Δ.3) left untreated or exposed to 0.2 µM aphidicolin for 24 h. Below: representative images of 53BP1 induction in the cells. Scale bars represent 20 μm. Above: mean nuclear 53BP1 bodies per G1 nucleus (Cyclin A negative) ± SEM of 3 biological independent experiments with at least 400 G1 cells (cyclin A-negative cells) analysed per condition. For all plots, mean ± SEM of three independent biological repeats shown. Statistical analysis for (b) was Mann-Whitney non-parametric. In all other instances statistical significance was determined using a Ordinary one-way ANOVA with a Bonferroni post-hoc analysis. *p < 0.05; **p < 0.01; ***p < 0.001; ****p < 0.0001. Source data are provided as a Source Data file.
Fig. 5
Fig. 5. C16orf72 modulates R-loop homoeostasis in response to replication stress.
a Cells expressing Flag-HA-tagged C16orf72 were transfected with control siRNA, or siRNA targeting BRCA1, FANCD2 or RNASEH2A. Cells were left untreated or exposed to 2 mM HU for 24 h prior to preparing cell extracts and western blotting with antibodies as indicated. Images are representative of 2 biological repeats. b, c U2OS cells were treated with 2 mM HU for 2 hours and subjected to proximity ligation assays using anti-C16orf72 and anti-S9.6 antibodies. Representative images of PLA foci (red) and nuclei (DAPI) are illustrated (b). Scale bars represent 10 μm. Graphs (c) represent the average foci/nucleus from (b). Mean values (red lines) are represented +/− SEM for at least 93 cells examined per treatment over 3 biological independent experiments. d Parental U2OS and c16orf72Δ cells were treated with HU for the indicated times prior to immuno-fluorescence with the S9.6 antibody. As a control for S9.6 antibody specificity, cells were left untreated or incubated with RNaseH before immuno-fluorescence. Data represents the quantification of nuclear mean intensity of the S9.6 signal. Data presented represent at least 124 cells over 3 (U2OS UT+RNaseH; c16orf72Δ.2 UT+RNaseH; c16orf72Δ.3 2 hrs HU; c16orf72Δ.2 24hrs HU) or 205 cells over 4 (U2OS UT; c16orf72Δ.2 UT; c16orf72Δ.3 UT; U2OS 2 hrs HU; c16orf72Δ.2 2 hrs HU) biological independent experiments. All other samples represent at least 50 cells examined per condition over 2 biological independent experiments. Mean values are represented (black lines) +/− SEM. e Parental U2OS, c16orf72Δ cells, or c16orf72Δ cells expressing Flag-C16orf72 (c16orf72Δ + Flag-C16orf72) were treated with HU for the indicated time prior to immuno-fluorescence with the S9.6 antibody. Data represent the quantification of nuclear mean intensity of the S9.6 signal. Data presented represent at least 150 cells examined per condition over 3 (U2OS UT; c16orf72Δ.2+Flag-C16orf72 2 hrs HU), 4 (c16orf72Δ.2 UT; c16orf72Δ.2+Flag-C16orf72 UT; U2OS 2 hrs HU) or 5 (c16orf72Δ.2 2 hrs HU) biological independent experiments. Mean values are represented (red lines) +/− SEM. f The indicated cells were treated with 100 µM DRB for 3 hours, followed by HU in the presence or absence of DRB, as indicated. Cells were subjected to immuno-fluorescence using the S9.6 antibody. Data represent the quantification of nuclear mean intensity of the S9.6 signal. Data presented represent at least 141 cells examined per condition over 3 biological independent experiments with the erxception of U2OS UT; c16orf72Δ.2 UT; U2OS 2 hrs HU; c16orf72Δ.3 2 hrs HU; U2OS DRB + HU; c16orf72Δ.3 DRB + HU (n = 4). Mean values are represented (black lines) +/− SEM. All Statistical significance in plots was assessed by Ordinary one-way ANOVA or Kruskal Wallis non-parametric tests (**p ≤ 0.01, ***p ≤ 0.001, ****p ≤ 0.0001 and ns = not significant). Source data are provided as a Source Data file.
Fig. 6
Fig. 6. C16orf72 and BRCA1/Senataxin interact to modulate R-loop homoeostasis in response to replication stress.
a Parental U2OS or c16orf72Δ cells were transfected with either control (siCTRL) or RNaseH2A (siRNaseH2A) siRNA as indicated. Cells were left untreated or exposed to 2 mM HU for 2 hours prior to immuno-fluorescence with the S9.6 antibody. Data represents the quantification of nuclear mean intensity of the S9.6 signal. Mean values (red lines) are represented +/− SEM where at least 138 cells were examined per treatment over 3 biological independent experiments. b Parental HeLa cells or RNaseH2 knock-out cells (RNaseH2A-/-) were transfected with either control or C16orf72 siRNA (siCTRL and siC16orf72, respectively) as indicated. Cells were left untreated or exposed to 2 mM HU for 2 hours prior to immuno-fluorescence with the S9.6 antibody. Data represents the quantification of nuclear mean intensity of the S9.6 signal. Mean values (red lines) are represented +/− SEM where at least 210 cells were examined per treatment over 4 biological independent experiments with the exception of RNaseH2A−/−/siC16orf72 cells (n = 3). c Parental U2OS and c16orf72Δ cells were transfected with control (siCTRL) or Senataxin (siSETX) siRNA as indicated. Cells were left untreated or exposed to 2 mM HU for 2 hours, prior to immuno-fluorescence with the S9.6 antibody. Data represent the quantification of nuclear mean intensity of the S9.6 signal. Mean values (red lines) are represented +/− SEM where at least 226 cells were examined per treatment over 4 biological independent experiments. d Parental U2OS and c16orf72Δ cells were transfected with control (siCTRL) or BRCA1 (siBRCA1) siRNA as indicated. Cells were left untreated or exposed to 2 mM HU for 2 hours, prior to immuno-fluorescence with the S9.6 antibody. Data represent the quantification of nuclear mean intensity of the S9.6 signal. Mean values (red lines) are represented +/− SEM where at least 234 cells were examined per treatment over 4 biological independent experiments with the exception of c16orf72Δ.2+siBRCA1 HU cells (n = 3). e The c16orf72Δ cell line expressing c16orf72-HA-Flag were left untreated or exposed to 2 mM HU for 2 hours as indicted. Following whole-cell extract preparation, c16orf72-HA-Flag was immunoprecipitated using anti-HA beads. Inputs or immunoprecipitates were subjected to western blotting using the indicated antibodies. Data are representative of 3 independent experiments. f, Parental and c16orf72Δ U2OS cells were treated with 2 mM HU for 2 hours and nuclear foci detected by immuno-fluorescence using anti-BRCA1 (f) or anti-Senataxin (g) antibodies. Data represent the mean BRCA1 and SETX foci count/nucleus, respectively. Mean values (black lines) are represented +/− SEM where at least 187 (f) or 155 (g) cells were examined per treatment over 3 biological independent experiments. All the Statistical significance was assessed by Ordinary one-way ANOVA or Kruskal Wallis non-parametric tests (**p ≤ 0.01, ***p ≤ 0.001, ****p ≤ 0.0001 and ns = not significant). Source data are provided as a Source Data file.
Fig. 7
Fig. 7. C16orf72 and BRCA1/Senataxin function together to promote replication fork restart and tolerance to replication stress.
a Parental and c16orf72Δ U2OS cells were transfected with control (siCTRL), BRCA1, or Senataxin (SETX) siRNA. Following treatment of cells with CIdU, HU and IdU as illustrated (top panel), DNA fibres were prepared from cells and quantified for the CIdU/IdU staining. 300-900 DNA fibres were analysed per condition from n = 3. Fork restart represents the % of fibres that display both CldU and IdU staining (upper panel). Data are presented as mean values +/− SEM.  b, c Clonogenic survival assay of parental and c16orf72Δ U2OS cells transfected with control (siCTRL), Senataxin (siSETX; b) or BRCA1 (siBRCA1; c) siRNA following exposure to increasing concentrations of HU. Data represent 2 biological repeats. Data are presented as mean values +/− SEM. d Parental and c16orf72Δ U2OS cells treated with DMSO or Olaparib as indicated prior to immuno-fluorescence with the S9.6 antibody. Data represents the quantification of nuclear mean intensity of the S9.6 signal. Mean values (red lines) are represented +/− SEM where at least 173 cells were examined per treatment over 3 biological independent experiments. e, f Clonogenic survival assay of parental (WT) and c16orf72Δ U2OS cells transfected with control (siCTRL), BRCA1 (siBRCA1; e) or Senataxin (siSETX; f) siRNA following exposure to increasing concentrations of olaparib. Data are presented as mean values +/− SEM where n = 5 independent biological repeats for (e) and n = 3 independent biological repeats for (f). In the case of DNA fibre and S9.6 staining, statistical significance was assessed by Ordinary one-way ANOVA or Kruskal Wallis non-parametric test. Clonogenic survival assays were assessed by two-way ANOVA (*p ≤ 0.05, **p ≤ 0.01, ***p ≤ 0.001, ****p ≤ 0.0001 and ns = not significant). Source data are provided as a Source Data file.

References

    1. Bartkova J, et al. DNA damage response as a candidate anti-cancer barrier in early human tumorigenesis. Nature. 2005;434:864–870. doi: 10.1038/nature03482. - DOI - PubMed
    1. Bryant HE, et al. Specific killing of BRCA2-deficient tumours with inhibitors of poly(ADP-ribose) polymerase. Nature. 2005;434:913–917. doi: 10.1038/nature03443. - DOI - PubMed
    1. Farmer H, et al. Targeting the DNA repair defect in BRCA mutant cells as a therapeutic strategy. Nature. 2005;434:917–921. doi: 10.1038/nature03445. - DOI - PubMed
    1. Ashworth A, Lord CJ. Synthetic lethal therapies for cancer: what’s next after PARP inhibitors? Nat. Rev. Clin. Oncol. 2018;15:564–576. doi: 10.1038/s41571-018-0055-6. - DOI - PubMed
    1. Martin-Hernandez K, Rodriguez-Vargas JM, Schreiber V, Dantzer F. Expanding functions of ADP-ribosylation in the maintenance of genome integrity. Semin. Cell Dev. Biol. 2017;63:92–101. doi: 10.1016/j.semcdb.2016.09.009. - DOI - PubMed

Publication types

MeSH terms