. 2023 Aug 17;13(1):13363.
doi: 10.1038/s41598-023-39687-1.

Inactivation kinetics of horseradish peroxidase (HRP) by hydrogen peroxide

Affiliations

Inactivation kinetics of horseradish peroxidase (HRP) by hydrogen peroxide

Diego Morales-Urrea et al. Sci Rep. .

Abstract

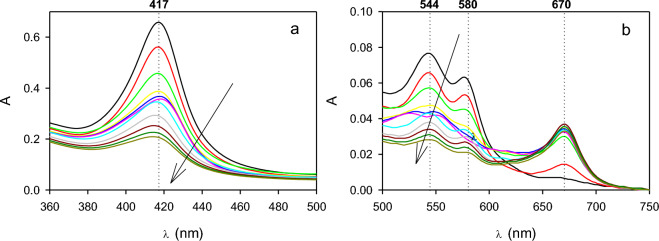
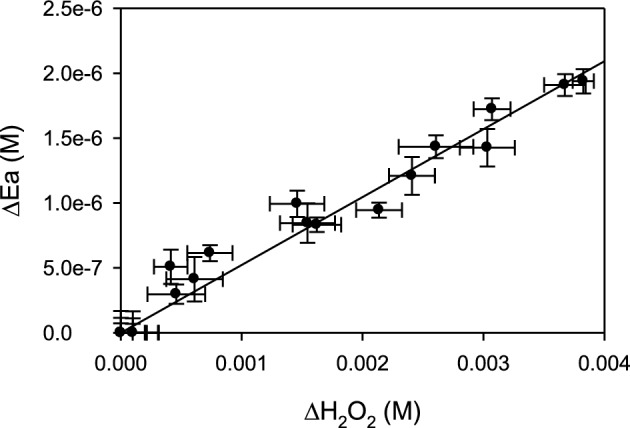
In recent years, the peroxidase enzymes have generated wide interest in several industrial processes, such as wastewater treatments, food processing, pharmaceuticals, and the production of fine chemicals. However, the low stability of the peroxidases in the presence of hydrogen peroxide (H2O2) has limited its commercial use. In the present work, the effect of H2O2 on the inactivation of horseradish peroxidase (HRP) was evaluated. Three states of HRP (E0, E2, and E3) were identified. While in the absence of H2O2, the resting state E0 was observed, in the presence of low and high concentrations of H2O2, E2, and E3 were found, respectively. The results showed that HRP catalyzed the H2O2 decomposition, forming the species Ex, which was catalytically inactive. Results suggest that this loss of enzymatic activity is an intrinsic characteristic of the studied HRP. A model from a modified version of the Dunford mechanism of peroxidases was developed, which was validated against experimental data and findings reported by the literature.


Conflict of interest statement

The authors declare no competing interests.

Figures

Figure 1
Figure 1
(a) Soret band, and (b) visible absorption spectra corresponding to the species E0 (black), E2 (red), E3 (green), and EX (blue). Dotted lines indicate the characteristic absorption bands corresponding to each species.
Figure 2
Figure 2
Change of the UV–Vis spectra of the reaction mixture as a function of time after the repeated additions of 20 µL of H2O2 (1 mM) to 3 mL of HRP (500 mg/L of lyophilized enzyme in PB 100 mM, pH 9). In each case, pi represents the number of the pulse of the oxidant.
Figure 3
Figure 3
Enzyme species E0 (black), E2 (red), and E3 (green) as a function of time after the addition of successive pulses (p1 to p6) of H2O2 to HRP (500 mg/L) dissolved in phosphate buffer (100 mM, pH 9). Yellow symbols indicate the sum of all the species. Bars represent the standard deviation.
Figure 4
Figure 4
Typical examples of the effect of the initial concentration of H2O2 (a), and enzyme (b) on the change of absorbance at 422 nm. Experimental conditions in (a) HRP = 5.2 µM; H2O2 (µM) = 26 (black), 48 (red), 67 (green). Experimental conditions in (b) HRP (µM) = 1.7 (black), 3.4 (red), 5.2 (green); H2O2 = 26 µM. All assays were performed in PB (100 mM, pH 9) at room temperature. For comparison purposes, results were normalized with respect to the corresponding initial absorbance value (Ai). Continuous lines indicate the proposed model using the coefficients shown in Table 1.
Figure 5
Figure 5
(a) Soret band, and (b) visible absorption spectra corresponding as a function of time. Initial conditions: HRP = 6 µM, H2O2 = 550 µM. Dotted lines indicate the characteristic absorption bands corresponding to E3 (417, 544, and 580 nm), and Ex (670 nm). Arrows indicate the evolution of time.
Figure 6
Figure 6
(a) Total active enzyme concentration (EA), and (b) peroxidatic activity as a function of time. Enzyme concentrations were obtained from the UV/Vis spectra depicted in Fig. 5. Bars represent the standard deviation. Dotted lines indicate the addition of a new pulse of H2O2.
Figure 7
Figure 7
Degradation of E3 (black) and formation of Ex (red) (a,c,e) and the corresponding H2O2 consumption (b,d,f) as a function of time. Bars represent the standard deviation. Continuous lines indicate the proposed model using the coefficients shown in Table 1. Dotted lines represent the time at which the active enzyme concentration was less than 10% of the initial one.
Figure 8
Figure 8
Degradation of HRP as a function of the consumed H2O2. Data were obtained from the results shown in Fig. 7. Bars represent the standard deviation.
Figure 9
Figure 9
Effect of the hydrogen peroxide concentration on the fraction of each enzyme species under the absence (black lines) or the presence (red lines) of an external substrate (OII = 1 × 10–4 M). Calculations were performed using Eqs. (A26) to (A29) along with the coefficients shown in Table 1. For details, see the Supplementary Material, Item 5.

References

    1. Straathof AJJ, Panke S, Schmid A. The production of fine chemicals by biotransformations. Curr. Opin. Biotechnol. 2002;13:548–556. doi: 10.1016/S0958-1669(02)00360-9. - DOI - PubMed
    1. Morales Urrea DA, Haure PM, García Einschlag FS, Contreras EM. Horseradish peroxidase-mediated decolourization of orange II: Modelling hydrogen peroxide utilization efficiency at different PH values. Environ. Sci. Pollut. Res. 2018;25:19989–20002. doi: 10.1007/s11356-018-2134-8. - DOI - PubMed
    1. Chiong T, Lau SY, Lek ZH, Koh BY, Danquah MK. Enzymatic treatment of methyl orange dye in synthetic wastewater by plant-based peroxidase enzymes. J. Environ. Chem. Eng. 2016;4:2500–2509. doi: 10.1016/j.jece.2016.04.030. - DOI
    1. Darwesh, O.M.; Matter, I.A.; EidaM, .F Application of Nanotechnology to Stabilize Peroxidase Enzyme and Improve It in Textile Dyes Removal from Wastewater. In Proceedings of the Conference on Water Resources and Arid Environments ; 2016; pp. 465–473.
    1. Ayyagari M, Akkara JA, Kaplan DL. Enzyme-mediated polymerization reactions: Peroxidase-catalyzed polyphenol synthesis. Acta Polym. 1996;47:193–203. doi: 10.1002/actp.1996.010470501. - DOI

Publication types