. 2023 Sep;9(9):1468-1480.
doi: 10.1038/s41477-023-01501-1. Epub 2023 Aug 17.

A critical role of a eubiotic microbiota in gating proper immunocompetence in Arabidopsis

Affiliations

A critical role of a eubiotic microbiota in gating proper immunocompetence in Arabidopsis

Bradley C Paasch et al. Nat Plants. 2023 Sep.

Abstract

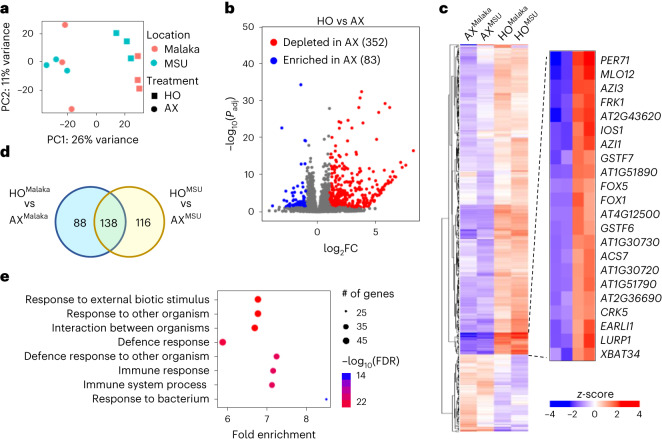
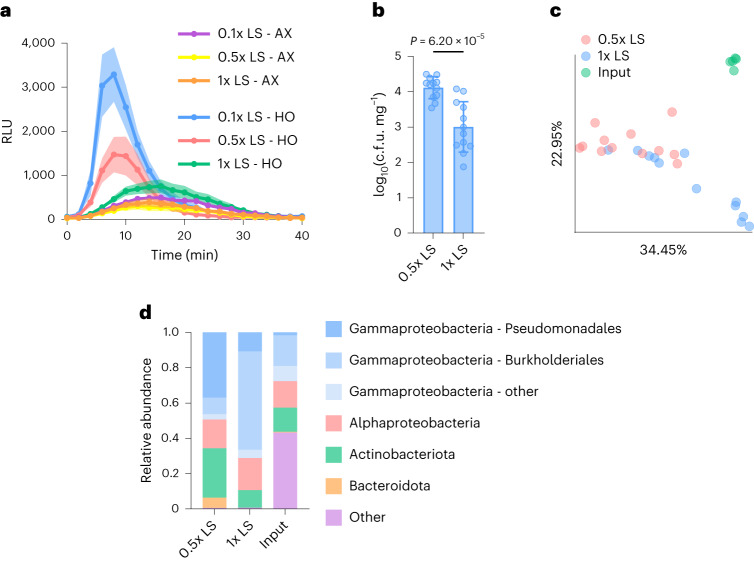
Although many studies have shown that microbes can ectopically stimulate or suppress plant immune responses, the fundamental question of whether the entire preexisting microbiota is indeed required for proper development of plant immune response remains unanswered. Using a recently developed peat-based gnotobiotic plant growth system, we found that Arabidopsis grown in the absence of a natural microbiota lacked age-dependent maturation of plant immune response and were defective in several aspects of pattern-triggered immunity. Axenic plants exhibited hypersusceptibility to infection by the bacterial pathogen Pseudomonas syringae pv. tomato DC3000 and the fungal pathogen Botrytis cinerea. Microbiota-mediated immunocompetence was suppressed by rich nutrient conditions, indicating a tripartite interaction between the host, microbiota and abiotic environment. A synthetic microbiota composed of 48 culturable bacterial strains from the leaf endosphere of healthy Arabidopsis plants was able to substantially restore immunocompetence similar to plants inoculated with a soil-derived community. In contrast, a 52-member dysbiotic synthetic leaf microbiota overstimulated the immune transcriptome. Together, these results provide evidence for a causal role of a eubiotic microbiota in gating proper immunocompetence and age-dependent immunity in plants.


Conflict of interest statement

The authors declare no competing interests.

Figures

Fig. 1
Fig. 1. Age-dependent flg22-triggered immunity in Arabidopsis.
a, flg22 protection assay showing enhanced resistance against Pst DC3000 triggered by pretreatment with 500 nM flg22 in 2.5-week-old and 3.5-week-old plants. Each bar represents the mean (±s.d.) bacterial titre 24 h after inoculation as log-transformed c.f.u. cm−2 (n = 6 plants). Different letters above bars represent a significant difference (P < 0.05, two-way analysis of variance (ANOVA) with Tukey’s honest significant difference (HSD) post-hoc test). b, Age-dependent flg22 protection. AX or HO plants were treated 24 h before inoculation with Pst DC3000 with either a water (mock) or 100 nM flg22 solution. Each bar represents the mean (±s.d.) bacterial titre 24 h after inoculation as log-transformed c.f.u. cm−2 (n = 3 plants). Different letters represent a significant difference (P < 0.05, two-way ANOVA with Tukey’s HSD post-hoc test). c, Relative protection displayed as fold change in bacterial cell counts between flg22- and mock-treated samples. Derived from absolute counts quantified in b. Error bars represent s.d. Different letters represent a significant difference (P < 0.05, two-way ANOVA with Tukey’s HSD post-hoc test). d,e, Basal (d) and flg22-induced (e) age-dependent FRK1 gene expression in 3.5-week-old and 5.5-week-old AX and HO plants. Total RNA was extracted 4 h after treatment with a mock solution lacking flg22 for basal expression or 100 nM flg22 for flg22-induced expression. Expression levels displayed as relative to mock-treated 3.5-week-old HO plants for both panels. PP2AA3 was used for normalization. Results represent the mean ± s.d. (n = 4 plants). Different letters represent a significant difference (P < 0.05, two-way ANOVA with Tukey’s HSD post-hoc test). ae, Experiments were repeated three independent times with similar results. Exact P values for all comparisons are detailed in the Source data. Source data
Fig. 2
Fig. 2. Axenic Arabidopsis plants are depleted in the basal expression of defence-related transcripts.
a, PCA analysis of genes expressed under AX and HO conditions using microbial communities from two different locations/soil types (‘MSU’: Michigan, Alfisol soil type; ‘Malaka’: Iowa, Mollisol soil type). b, Volcano plot of DEGs. Coloured regions represent significant differential expression with |log2FC| > 1 and FDR < 0.05 cut-off (Benjamini–Hochberg-corrected Wald test) with the number of genes corresponding to each group indicated in parentheses. c, Heat map of DEGs generated using hierarchical clustering with Euclidean distance and complete linkage. Label superscript indicates community used for inoculation of HO plants or mock inoculation of AX plants. A subset of the differentially regulated genes in HO and AX is shown on right. d, Venn diagram of upregulated DEGs showed 138 common genes in response to HOMSU and HOMalaka treatments. e, GO term enrichment (GO:BP biological process) analysis on ‘core’ depleted DEGs in AX plants. Top enriched GO terms displayed, ranked by significance (FDR < 0.05 cut-off). ae, n = 3 biologically independent plant samples per condition.
Fig. 3
Fig. 3. Axenic Arabidopsis plants exhibit defects in PTI compared with colonized plants.
a, ROS burst dynamics induced by 250 nM flg22, elf18 and Pep1 in AX and HO plants in GnotoPots. Results represent the mean ± s.e.m. (n = 8 plants). b, FRK1 gene expression in AX and HO plants induced by 250 nM flg22, elf18 and Pep1. Total RNA was extracted from leaf discs 1.5 h after treatment. Bars represent the mean ± s.d. (n = 8 plants; flg22 P = 0.009, elf18 P = 0.017, Pep1 P = 0.034; two-way ANOVA with Šidák’s multiple comparisons test). c,d, Representative blots of total MPK3 (c) or MPK6 (d) proteins in 4.5-week-old AX and HO plants. Protein was detected with MPK3 or MPK6-specific antibodies. Numbers indicate band intensity relative to that of Ponceau S, normalized to HO = 1.00. e, Representative blot of phosphorylated MPK3/6 proteins detected using an α-p44/42-ERK antibody upon treatment with 100 nM flg22. Samples were taken at the indicated times after treatment. f, Basal and flg22-induced expression of FLS2 gene in AX and HO plant leaf tissue. Total RNA was extracted 1 h after treatment with 100 nM flg22 or mock solution. Bars represent the mean ± s.d. (n = 3 biologically independent plant samples). Different letters represent a significant difference (P < 0.05, two-way ANOVA with Tukey’s HSD post-hoc test). g, Total BAK1 protein detected in leaf lysates of AX and HO plants. Numbers indicate band intensity relative to Amido Black, normalized to HO = 1.00. h, Pst DC3000 populations in AX and HO plants. Each bar represents the mean (±s.d.) bacterial titre 3 d after inoculation as log-transformed c.f.u. cm−2 (n = 3 plants). P = 0.0006, two-tailed unpaired t-test. i, Size of lesions formed in AX and HO plants by B. cinerea. Each bar represents the mean (±s.d.) lesion diameter 5 d after inoculation (n = 6 plants). P = 2.26 × 10−6, two-tailed unpaired t-test. ai, Experiments were repeated three independent times with similar results. b,f, Exact P values for all comparisons are detailed in the Source data. ce,g, See Source data for image cropping. Source data
Fig. 4
Fig. 4. Natural microbiota and SynComCol-0 restore immunocompetence.
a, ROS burst dynamics induced by 100 nM flg22 in axenic plants mock-inoculated with 10 mM MgCl2 and plants colonized by HO or SynComCol-0. Results represent the mean ± s.e.m. (n = 12 plants). b,c, Basal (b) and flg22-induced (c) FRK1 expression in axenic MgCl2 mock-inoculated plants and plants inoculated with SynComCol-0. Total RNA was extracted 3 h after treatment with a mock solution lacking flg22 (b) or 100 nM flg22 (c). Results relative to basal expression in SynComCol-0-inoculated plants. PP2AA3 was used for normalization. Bars represent the mean (±s.d.) expression value (n = 3 plants). Basal expression P = 0.0011; flg22-induced P = 0.0006, two-tailed unpaired t-test. d, Pst DC3000 populations in axenic plants mock-inoculated with 10 mM MgCl2 and SynComCol-0-inoculated plants. Each bar represents the mean (±s.d.) bacterial titre 3 d after inoculation as log-transformed c.f.u. cm−2 (n = 4 plants). P = 4.80 × 10−5, two-tailed unpaired t-test. ad, Experiments were repeated three independent times with similar results. Source data
Fig. 5
Fig. 5. Microbiota-mediated immunocompetence is nutrient dependent.
a, ROS burst dynamics induced by 100 nM flg22 in AX and HO plants grown in GnotoPots supplied with 0.1x, 0.5x or 1x LS nutrient solution concentrations. Results represent the mean ± s.e.m. (n = 6 plants). b, Absolute abundance of phyllosphere bacterial populations associated with HO plants grown in GnotoPots supplied with either 0.5x or 1x LS nutrient solution. Each bar represents the mean (±s.d.) bacterial titre as log-transformed c.f.u. cm−2 (n = 12 plants). P = 6.20 × 10−5, two-tailed unpaired t-test. a,b, Experiments were repeated a minimum of two independent times with similar results. c, PCoA of weighted UniFrac distances obtained from 16S rRNA gene sequence profiles of soil-derived input microbiota (MSU) and phyllosphere microbiota of HO plants after 6 weeks of growth in GnotoPots supplied with either 0.5x or 1x LS nutrient solution (0.5x LS vs 1x LS: q = 0.002, 0.5x LS vs input: q = 0.002, 1x LS vs input: q = 0.002; pairwise permutational multivariate ANOVA with 999 permutations). d, Relative abundance of bacterial populations at the phylum level. Members of Proteobacteria phylum are separated into class and members of Gammaproteobacteria class are further separated into order. c,d, n = 5 biologically independent soil samples (input), n = 12 plants (0.5x LS), n = 12 plants (1x LS). Source data
Fig. 6
Fig. 6. Dysbiotic microbiota overstimulates immune gene expression.
ac, Basal expression of defence-related genes FRK1 (a), CYP71A12 (b) and PR1 (c) in AX, SynComCol-0- and SynCommfec-inoculated plants grown in agar plates. PP2AA3 was used for normalization. Bars represent the mean ± s.d. (n = 4 biologically independent plant samples). Different letters represent a significant difference (P < 0.05, one-way ANOVA with Tukey’s HSD post-hoc test). d, Volcano plot of genes differentially expressed in SynComCol-0- and SynCommfec-colonized plants. Coloured regions represent significant differential expression with |log2FC| > 1 and FDR < 0.05 (Benjamini–Hochberg-corrected Wald test), with the number of genes corresponding to each group indicated in parentheses. e, GO term enrichment for upregulated DEGs in SynCommfec-colonized plants compared to SynComCol-0-colonized plants, ranked by significance (FDR < 0.05 cut-off). f, Heat map for selected genes from hierarchical clustering of all DEGs. Gene descriptions are listed in Supplementary Data 4. df, n = 3 biologically independent plant samples per condition. Source data
Extended Data Fig. 1
Extended Data Fig. 1. oloxenic bbc plants do not show robust flg22 protection.
H 4-week-old wildtype (Col-0) and bbc mutant HO plants were treated 24 hours before inoculation with Pst DC3000 (OD600 = 0.002) with either a water (mock) or 100 nM flg22 solution. Each column represents the mean bacterial titer 24 hours after inoculation as log transformed cfu/cm2 (n = 3 plants). Error bars indicate SD. (Col-0: p = 7.74 × 10⁻⁹, bbc: not significant; two-way ANOVA with Šidák’s multiple comparison test). This experiment was repeated three independent times with similar results. Exact p-values for all comparisons are detailed in the Source Data. Source data
Extended Data Fig. 2
Extended Data Fig. 2. Axenic Arabidopsis plants exhibit decreased total ROS production upon PTI elicitation compared to holoxenic plants.
Total ROS production induced by 250 nM flg22, elf18, and Pep1 in AX and HO plants in GnotoPots. Results calculated from data presented in Fig. 2a by determining the mean area under curve (n = 8 plants). Error bars indicate SD (flg22: p = 6.07 × 10⁻⁵, elf18: p = 3.77 × 10⁻⁵, Pep1: p = 0.03; two-way ANOVA with Fisher’s LSD test). This experiment was repeated three independent times with similar results. Source data
Extended Data Fig. 3
Extended Data Fig. 3. FLS2 protein abundance in axenic and holoxenic plants.
Total FLS2 protein detected in whole leaf tissue lysate of four pooled plants. Two experimental repeats show variability in FLS2 relative abundance. Ponceau S stain of all blots show equal loading. This experiment was repeated five times with variable results. Blots from two representative experiments shown. See Source Data for image cropping. Source data
Extended Data Fig. 4
Extended Data Fig. 4. SA and glucosylated SA abundance in axenic and holoxenic plants.
a,b, Total levels of salicylic acid (SA) (a) and glucosylated SA (b) in AX and HO plants. Each bar represents the mean values (n = 6 biologically independent plant samples). Error bars represent SD (SA: p = 0.003, SAG: p = 0.002; two-tailed unpaired t-test). This experiment was repeated three independent times with similar results. Source data
Extended Data Fig. 5
Extended Data Fig. 5. SynComCol-0 restores immunocompetence.
a, Total ROS production induced by 100 nM flg22 in plants colonized by HO or SynComCol-0. Results calculated from data presented in Fig. 3a by determining the mean area under curve ± SD (n = 12 plants). Different letters represent a significant difference (p < 0.05, one-way ANOVA with Tukey’s HSD post-hoc test). Exact p-values for all comparisons are detailed in the Source Data. b, Total BAK1 protein detected in leaf lysates of 6-week-old plants mock-inoculated with 10 mM MgCl2 and plants colonized by SynComCol-0. Numbers below blot indicates band intensity relative to that of Ponceau S, normalized to HO = 1.00. See Source Data for image cropping. a,b, Experiments were repeated two times with similar results. Source data
Extended Data Fig. 6
Extended Data Fig. 6. A simplified SynCom restores immunocompetency.
a, ROS burst kinetics after induction by 250 nM flg22 in plants colonized by SynComCol-mix19, SynComCol-mix3 or mock-inoculated with 10 mM MgCl2 as a control in GnotoPots. Results represent the mean values ± s.e.m. (n = 8 plants). b, Total ROS production calculated by determining the area under each curve displayed in panel a. Results represent the mean value ± SD (n = 8 plants). Different letters represent a significant difference (p < 0.05, one-way ANOVA with Tukey’s HSD post-hoc test). Exact p-values for all comparisons are detailed in the Source Data. This experiment was repeated two independent times with similar results. Source data
Extended Data Fig. 7
Extended Data Fig. 7. Excess nutrients suppress microbiota-mediated immune maturation.
a, Total ROS production induced by 100 nM flg22 in AX and HO plants grown in GnotoPots supplied with 0.1x, 0.5x, or 1x LS nutrient solution concentrations. Results calculated from data presented in Fig. 5a by determining the mean area under curve ± SD (n = 6 plants). Different letters represent a significant difference (p < 0.05, two-way ANOVA with Fisher’s LSD test). This experiment was repeated three times with similar results. b, ROS burst dynamics induced by 250 nM flg22 in HO plants grown in GnotoPots supplied with 0.5x LS, 0.5x LS supplemented with additional components of LS up to 1x, and 1x LS. AX plants included as a control. Results represent the mean value ± s.e.m. (n = 8 plants). c, Total ROS production calculated by determining the area under each curve in panel b. Results represent the mean value (n = 8 plants). Error bars represent SD (compared to 0.5x LS: p = 0.0051 ( + N), p = 0.0009 (1x LS), q = 0.0184 (AX), all others ns; one-way ANOVA with Dunnett test). d, FRK1 gene expression in AX and HO plants induced by 250 nM flg22. Total RNA was extracted from leaf disks 1.5 h after treatment. PP2AA3 was used for normalization. Bars represent the mean value (n = 8 plants). Error bars indicate SD (compared to 0.5x LS: p = 0.0180 ( + N), p = 0.0169 (1x LS), p = 0.0234 (AX), all others ns; one-way ANOVA with Dunnett test). a-d, Experiments were repeated a minimum of two independent times with similar results. a,c,d, Exact p-values for all comparisons are detailed in the Source Data. Source data
Extended Data Fig. 8
Extended Data Fig. 8. Induction of CYP17A12 gene expression by individual members of SynComCol-0 and SynCommfec in CYP71A12pro:GUS reporter line.
GUS histochemical staining was performed after treatment of 12-days old seedling of CYP71A12pro:GUS reporter line with individual SynCom strains. Representative pictures of plants after GUS assay are depicted here. This experiment was repeated two independent times with similar results.
Extended Data Fig. 9
Extended Data Fig. 9. Leaf transcriptomes of plants colonized with natural community and SynComCol-0 share common immune-related gene expression.
a. Venn diagram of upregulated DEGs showed 213 common Arabidopsis genes in response to natural microbiota and SynComCol-0 colonization. Significant DEGs were identified using DESEq2 with |log2FC | > 1 and FDR < 0.05 (Benjamini-Hochberg corrected Wald Test) criteria in a comparison of HO plants (colonized by microbial communities from two different locations/soil types ‘MSU’ and ‘Malaka’) and SynComCol-0-colonizedplants with their corresponding AX control. b, A subset of the differentially regulated genes in HO and SynComCol-0 plants, compared to corresponding AX plants, is shown. Heat map of the DEGs was generated using hierarchical clustering with Euclidean distance and complete linkage. c-e, Gene Ontology (GO) term enrichment (GO:BP biological process) analysis on 213 common enriched DEGs in both HO and SynComCol-0, only in HO or only in SynComCol-0 plants, compared to their respective AX control plants. Top enriched GO terms are displayed, ranked by significance (FDR < 0.05 cutoff). The 213 enriched DEGs common in both HO and SynComCol-0 (panel c) showed highest fold enrichment for immunity-associated GO terms. GNSR genes present in the subset of 213 DEGs common in both HO and SynComCol-0 are marked in red in panel b. a-e, n = 3 biologically independent plant samples per condition.

References

    1. Paasch BC, He SY. Toward understanding microbiota homeostasis in the plant kingdom. PLoS Pathog. 2021;17:e1009472. doi: 10.1371/journal.ppat.1009472. - DOI - PMC - PubMed
    1. Sohrabi R, Paasch BC, Liber J, He SY. Phyllosphere microbiome. Annu. Rev. Plant Biol. 2023;74:539–568. doi: 10.1146/annurev-arplant-102820-032704. - DOI - PubMed
    1. Bulgarelli D, Schlaeppi K, Spaepen S, van Themaat EVL, Schulze-Lefert P. Structure and functions of the bacterial microbiota of plants. Annu. Rev. Plant Biol. 2013;64:807–838. doi: 10.1146/annurev-arplant-050312-120106. - DOI - PubMed
    1. Lundberg DS, et al. Defining the core Arabidopsis thaliana root microbiome. Nature. 2012;488:86–90. doi: 10.1038/nature11237. - DOI - PMC - PubMed
    1. Müller DB, Vogel C, Bai Y, Vorholt JA. The plant microbiota: systems-level insights and perspectives. Annu. Rev. Genet. 2016;50:211–234. doi: 10.1146/annurev-genet-120215-034952. - DOI - PubMed

Publication types