. 2023 Nov;18(11):1319-1326.
doi: 10.1038/s41565-023-01471-7. Epub 2023 Aug 17.

Programmable multispecific DNA-origami-based T-cell engagers

Affiliations

Programmable multispecific DNA-origami-based T-cell engagers

Klaus F Wagenbauer et al. Nat Nanotechnol. 2023 Nov.

Abstract

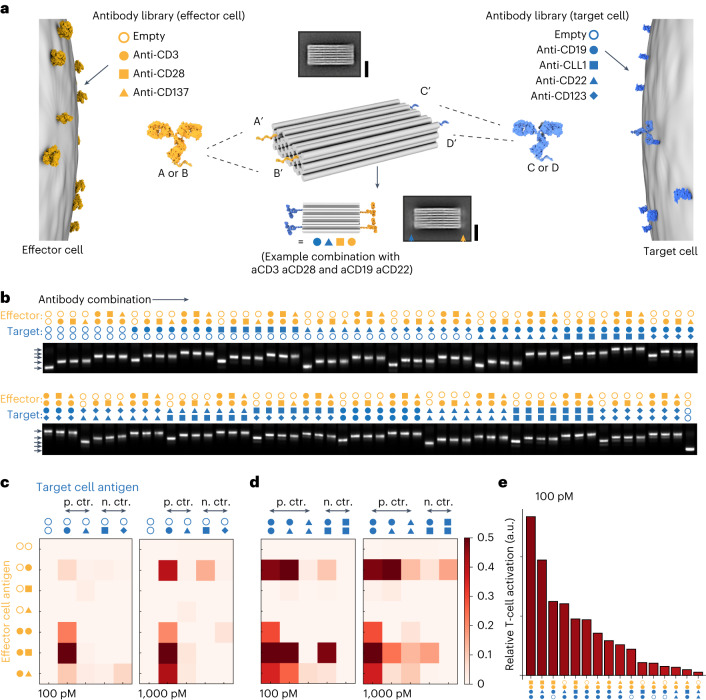
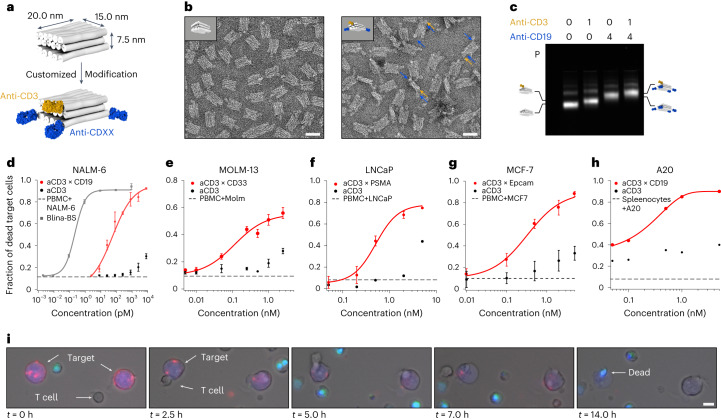
Multispecific antibodies have emerged as versatile therapeutic agents, and therefore, approaches to optimize and streamline their design and assembly are needed. Here we report on the modular and programmable assembly of IgG antibodies, F(ab) and scFv fragments on DNA origami nanocarriers. We screened 105 distinct quadruplet antibody variants in vitro for the ability to activate T cells in the presence of target cells. T-cell engagers were identified, which in vitro showed the specific and efficient T-cell-mediated lysis of five distinct target cell lines. We used these T-cell engagers to target and lyse tumour cells in vivo in a xenograft mouse tumour model. Our approach enables the rapid generation, screening and testing of bi- and multispecific antibodies to facilitate preclinical pharmaceutical development from in vitro discovery to in vivo proof of concept.


Conflict of interest statement

The Technical University of Munich has filed several patents listing K.F.W., J.J.F., B.K. and H.D. as the inventors. K.F.W., J.J.F., B.K. and H.D. are co-founders of Plectonic Biotech GmbH. S.K. has received honoraria from TCR2 Inc., Novartis, Miltenyi Biomedicines, BMS and GSK. S.K. and A.G. are inventors of several patents in the field of immuno-oncology (approved, S.K., PCT/EP2013/051351, PCT/EP2016/064195, PCT/EP2016/074644; pending, S.K., PCT/EP2020/056086; submitted, S.K. and A.G., EP21191376, EP 23 154 047.78; countries, Europe, USA, Canada). S.K. received license fees from TCR2 Inc. and Carina Biotech. S.K. received research support from Plectonic GmbH for parts of the work contained herein. S.K. received research support from TCR2 Inc. and Arcus Bioscience for work unrelated to the manuscript. A.G. received research support from Tabby Therapeutics for work unrelated to the manuscript. The remaining authors declare no competing interests.

Figures

Fig. 1
Fig. 1. Production and functional screening of 105 unique antibody combinations on a DNA chassis.
a, Schematic of a multispecific antibody chassis variant library created from a set of antibody–DNA conjugates. The symbols indicate the antibody, and the colour indicates the engaged cell type. Antibodies are covalently tagged with DNA handles with the sequences A, B, C or D, depending on the library, and the sequences are complementary to DNA handles on the chassis (centre). The chassis carries four DNA handles. Antibody chassis variants are produced by mixing the respective antibodies from the libraries with the DNA chassis. Variants are named by their antibody combination (the centre bottom shows an example combination). Two reference-free class averages calculated from single-particle TEM micrographs. Scale bar, 20 nm. The top average shows the platform without antibodies and the bottom average image shows the platform with four IgG antibodies, indicated by the orange and blue arrow heads pointing to the blurred additional signal in the average image. b, Montage of laser-scanned images of agarose gels on which 105 variants were electrophoresed that were incubated with different antibody combinations (as indicated by the symbols). The first and last lanes show a reference 5 MDa DNA origami object. c,d, T-cell activation was measured by using NFAT-luciferase Jurkat cell line in co-cultures with human ALL cell line NALM-6 in the presence of the indicated combinations (c,d). Relative T-cell activation (normalized to variants without target cell antibodies) of different variants for 100 pM and 1,000 pM DNA chassis concentrations. The icons in orange and blue indicate the respective antibodies used in the combination. e, Relative T-cell activation of the variants sorted for maximum activation according to the values in c and d at 100 pM. Source data
Fig. 2
Fig. 2. Programmable T-cell-mediated killing of target cells.
a, Schematic of a multispecific brick-shaped antibody carrier (chassis) with dimensions of 10.0 × 15.0 × 7.5 nm3. The grey cylinders represent DNA double helices, and the F(ab) fragments are coloured in orange (anti-CD3) and blue (representing a F(ab) fragment for antigens located on the target cells). b, Negatively stained TEM image of the small chassis (left) and negatively stained TEM image of the small chassis with 1× anti-CD3 and 2× anti-CD19 F(ab) fragments (right). Scale bar, 25 nm. The arrows in blue and yellow highlight the attached F(ab) fragments as an example. c, Laser-scanned image of an agarose gel on which different samples were electrophoresed. The samples were prepared with different F(ab) fragment combinations (as indicated by the numbers). P, pocket; icons highlight the different antibody chassis variants; 0-0, reference for the migration of platform only. dh, Cytotoxic T-cell-mediated target cell lysis assays. Fraction of dead target cells after 24 h as a function of PTE concentration in the assay (Supplementary Information). Effector (PBMC) and target cell ratio was chosen as 5:1. Red dots, multispecific T-cell-engaging variant with anti-CD3 and at least two target-specific F(ab) fragments for the respective cell line. Black dots, monospecific controls. Solid lines, Hill fit to the data. Dashed line, PBMC and target cells without PTE after 24 h. Grey squares, blinatumomab-biosimiliar (Blina-BS). The error bars to the data are standard deviations to the mean of three biological replicates. i, Live-cell fluorescence microscopy over 24 h of a mixture containing A20 cells (stained with CellTrace CSFE; blue) and splenocytes in a 1:5 ratio, and a variant (1× mu anti-CD3–4× mu anti-CD19) carrying a fluorescent tag (cyanine-5). A live–dead stain was used for the visualization of dead cells (SYTOX Orange; cyan). Scale bar, 2.5 µm. Source data
Fig. 3
Fig. 3. In vivo characterization of DNA-origami-based T-cell engager.
a, Schematic of the experimental procedure. NSG mice were administered the highlighted samples carrying a Cy7 dye via a tail-vein injection. Distribution of the administered sample was then continuously measured using an in vivo imaging platform (IVIS). Colour scheme, bispecific PTE with Cy7 (midnight; PTE-2×19-3), DNA oligo with Cy7 (mocha; Cy7 DNA), DNA origami chassis with Cy7 (dark red; Cy7 chassis) and vehicle (grey; PBS). b, IVIS fluorescent images of NSG mice over time. Left to right, samples as indicated in a. c, Fluorescence intensity of the bispecific (bluish), Cy7 DNA (brownish) and Cy7 chassis (reddish) samples as a function of time across different organs/regions. Data are mean ± standard error of mean (s.e.m.) from three independent measurements of n = 3 mice. d,e, IVIS fluorescence images of different organs and excreta extracted from n = 3 NSG mice. f,g, Fluorescence intensity in different organs and excreta. The background fluorescence of each organ was subtracted. Data are mean ± s.e.m. from n = 3 mice. Source data
Fig. 4
Fig. 4. Investigation of functionality of DNA-origami-based T-cell engagers in vivo.
a, Treatment schedule of binding and activation trials. Experimental procedure to measure the in vivo binding and activation behaviour on tumour (NALM-6) and T cells. Colour scheme: midnight blue, PTE-2×19-3; teal, PTE-3; mocha, PTE-2×19; red, chassis; violet, Blina-BS. Doses were between 10 and 15 pmol. NALM-6-GFP-luc, PBMC and samples were intravenously administered at the indicated time points. Three mice were injected per group. After 4 h, the mice were sacrificed and sample distribution in the bone marrow was analysed using flow cytometry. b,c, Mean fluorescence intensity (MFI) measurements (left) and representative histograms (right) of flow cytometric measurements of Cy5 fluorescence (b) or CD19-BV785 fluorescence (c) on NALM-6-GFP-luc cells (indicating Cy5-labelled PTE bound to the tumour cells). d,e, Measurement of CD69 fluorescence on either CD4+ (d) or CD8+ (e) T cells. In be, data are mean ± s.e.m. from n = 3 mice. f, Schematic of the long-term treatment with PTEs in vivo. g, Luminescence images of mice injected with luciferin to visualize NALM-6-GFP-luc tumour cells. The white cross indicates the mouse that was censored due to non-tumour-related toxicities. h, Quantification of bioluminescence measurements. For g and h, n = 5 mice per group; for h, mean ± s.e.m. is shown. For all the panels, statistical significance was calculated using ordinary one-way or two-way analysis of variance with Tukey’s multiple comparisons correction. Source data

References

    1. Rothemund PWK. Folding DNA to create nanoscale shapes and patterns. Nature. 2006;440:297–302. - PubMed
    1. Douglas SM, et al. Self-assembly of DNA into nanoscale three-dimensional shapes. Nature. 2009;459:414–418. - PMC - PubMed
    1. Han D, et al. DNA origami with complex curvatures in three-dimensional space. Science. 2011;332:342–346. - PubMed
    1. Benson E, et al. DNA rendering of polyhedral meshes at the nanoscale. Nature. 2015;523:441–444. - PubMed
    1. Dietz H, Douglas SM, Shih WM. Folding DNA into twisted and curved nanoscale shapes. Science. 2009;325:725–730. - PMC - PubMed