

Transcriptional profiling of canine osteosarcoma identifies prognostic gene expression signatures with translational value for humans
- PMID: 37591946
- PMCID: PMC10435536
- DOI: 10.1038/s42003-023-05208-z
Transcriptional profiling of canine osteosarcoma identifies prognostic gene expression signatures with translational value for humans
Abstract
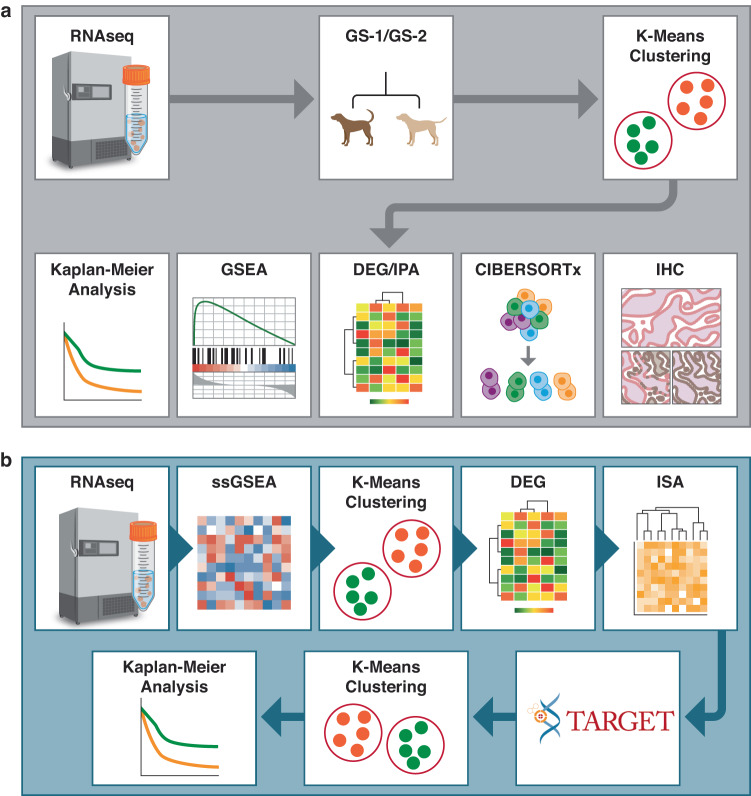
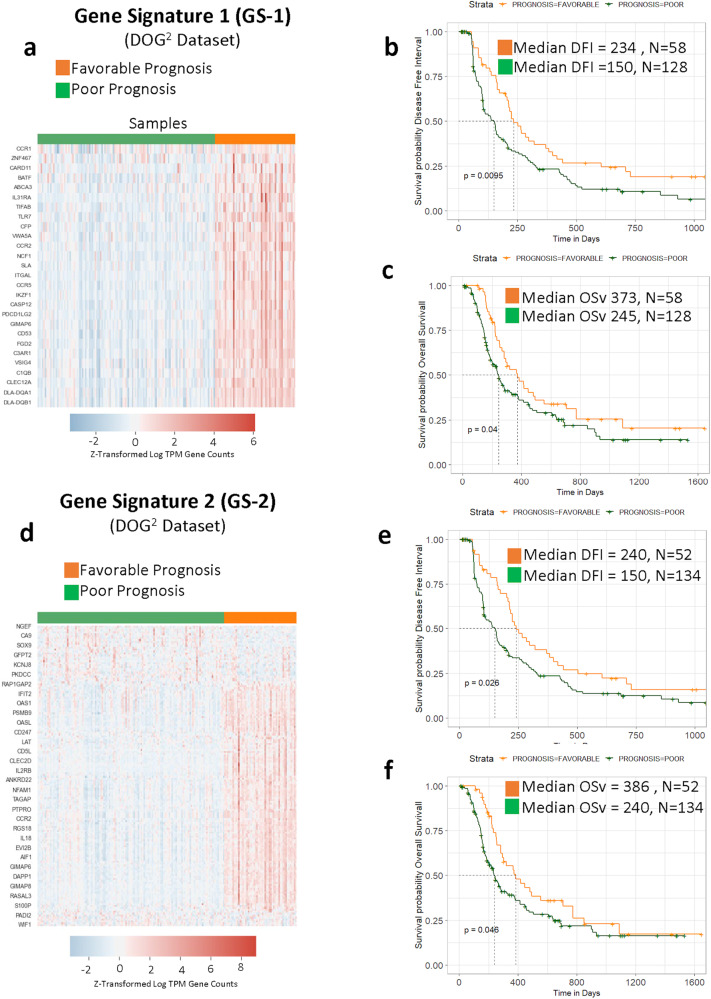
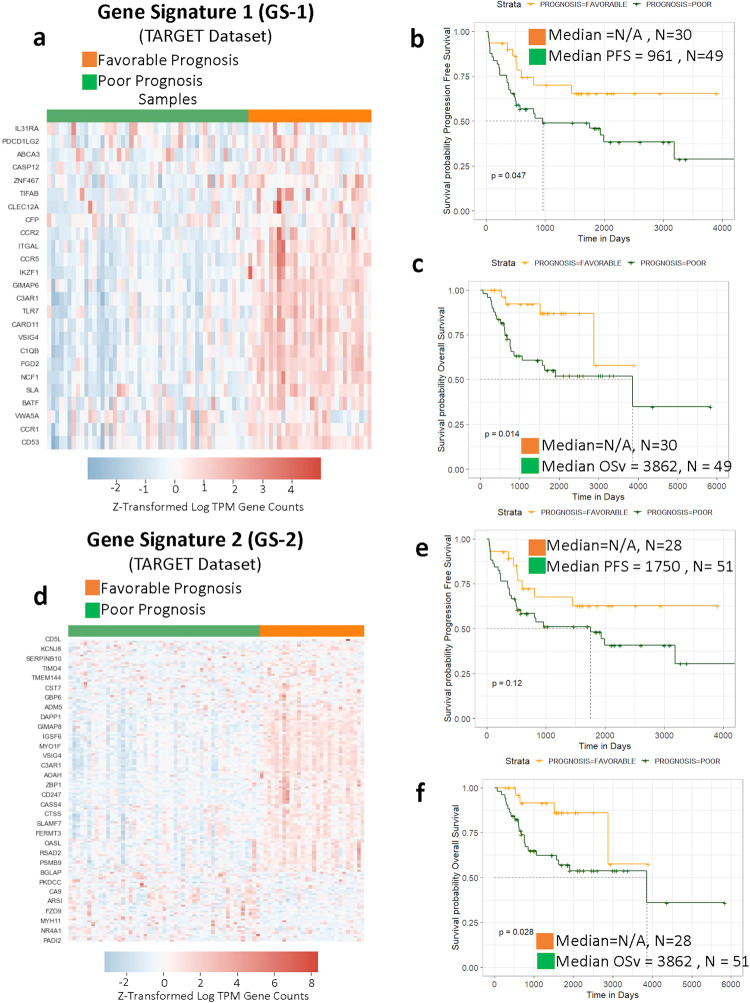
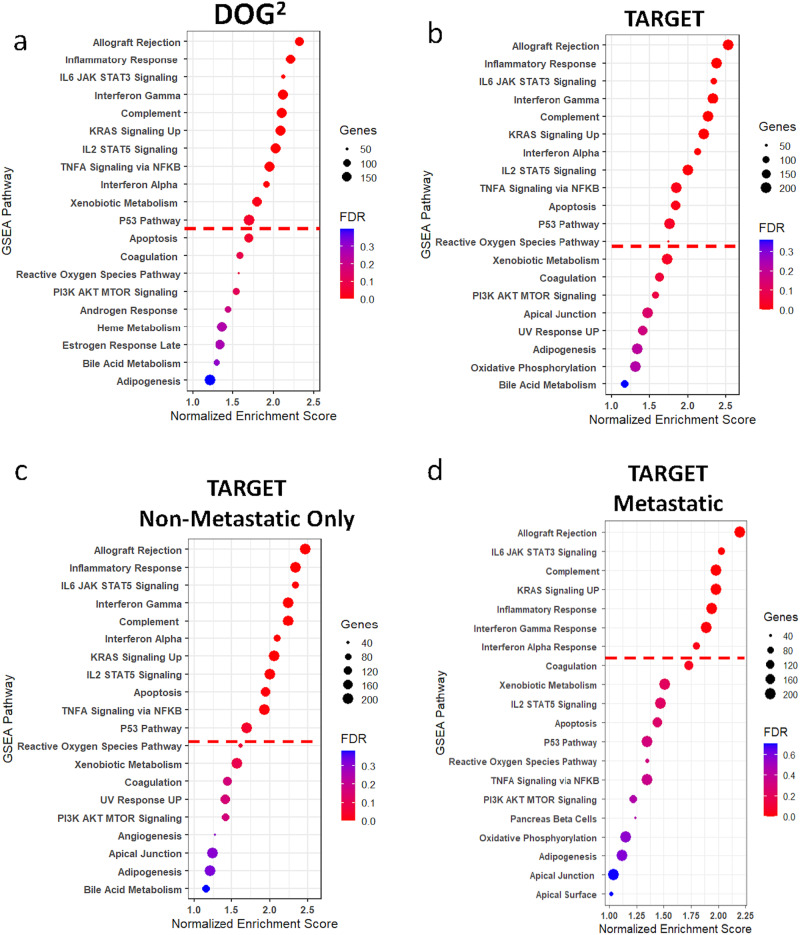
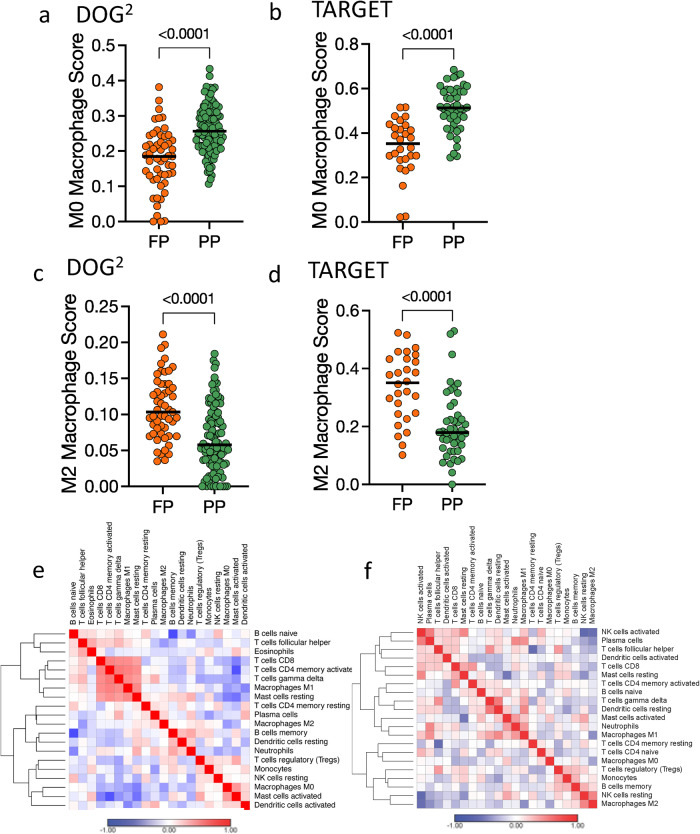
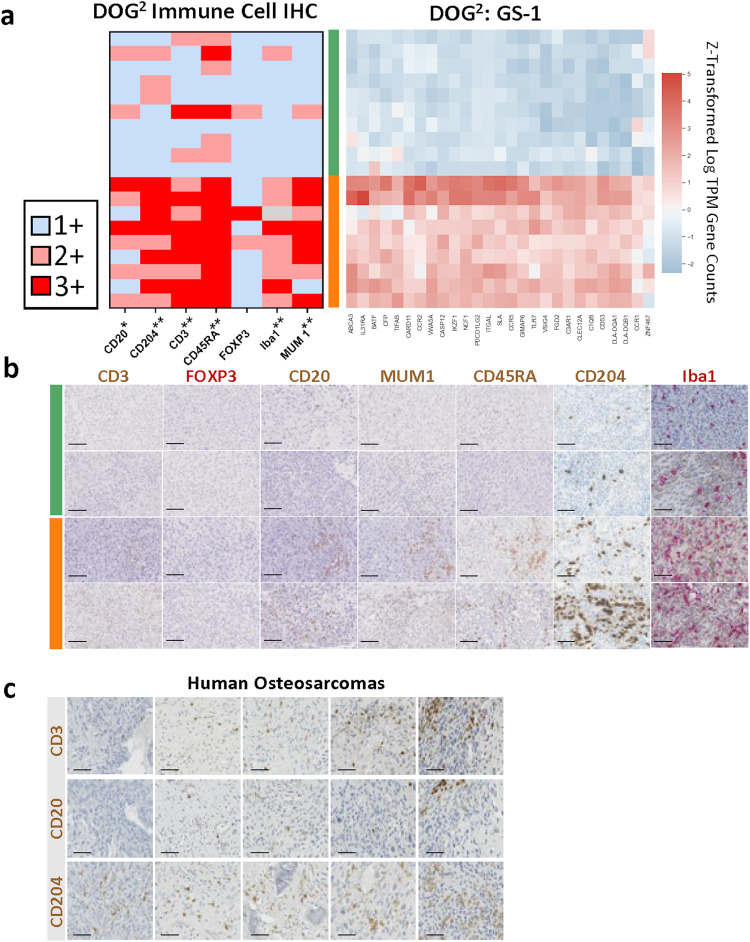
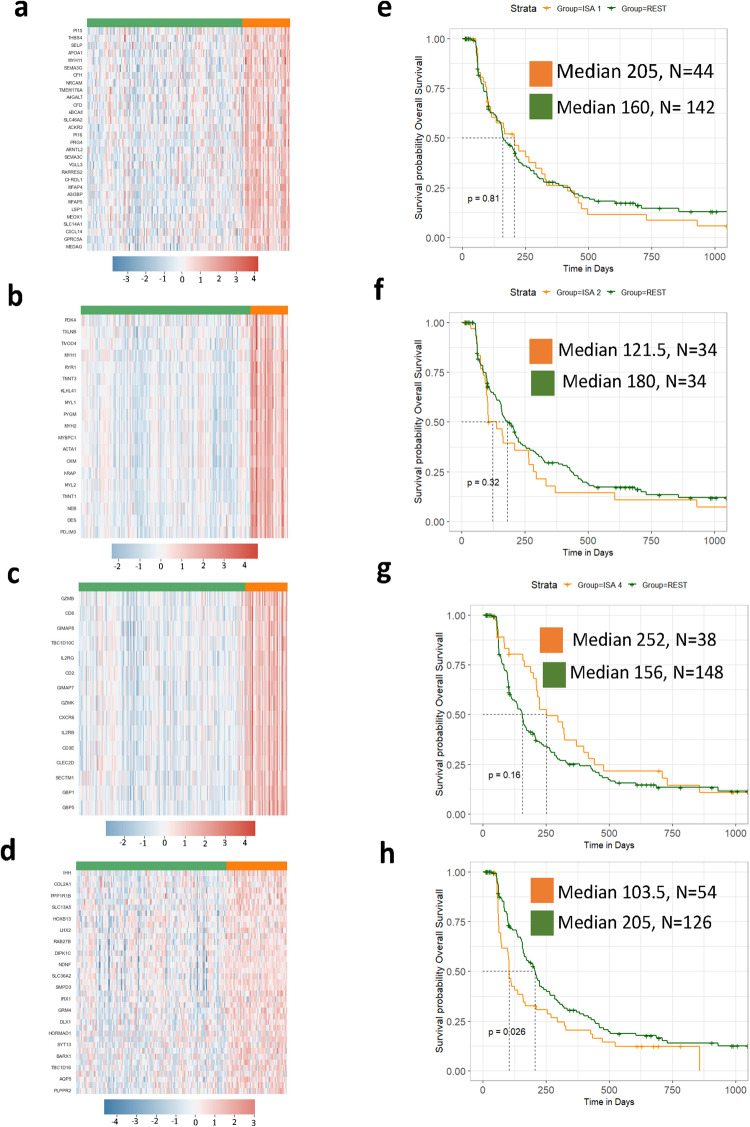
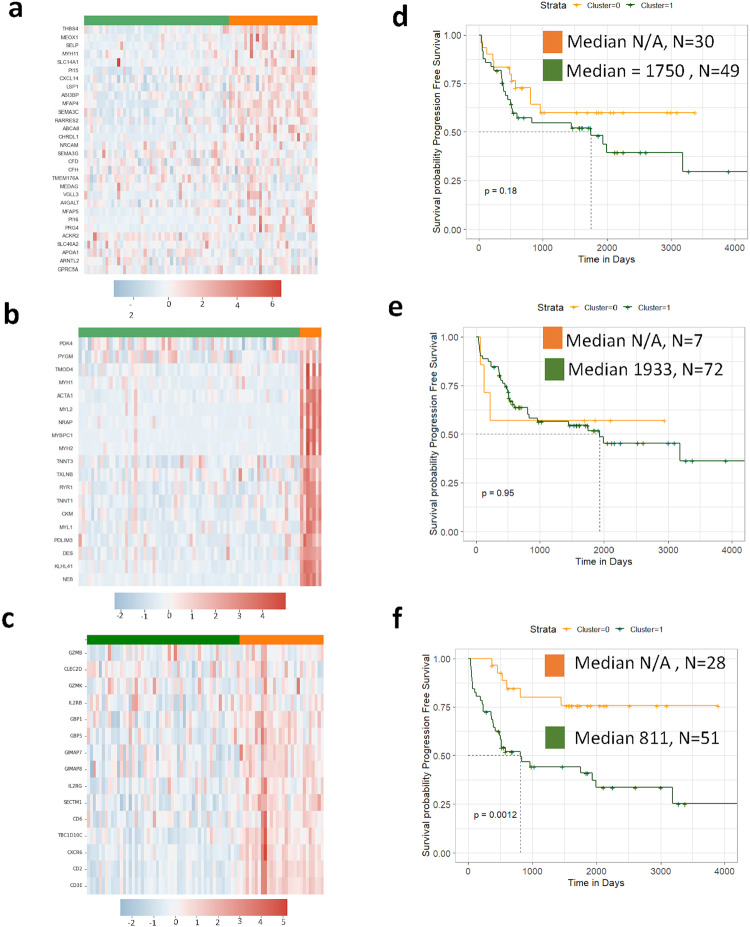
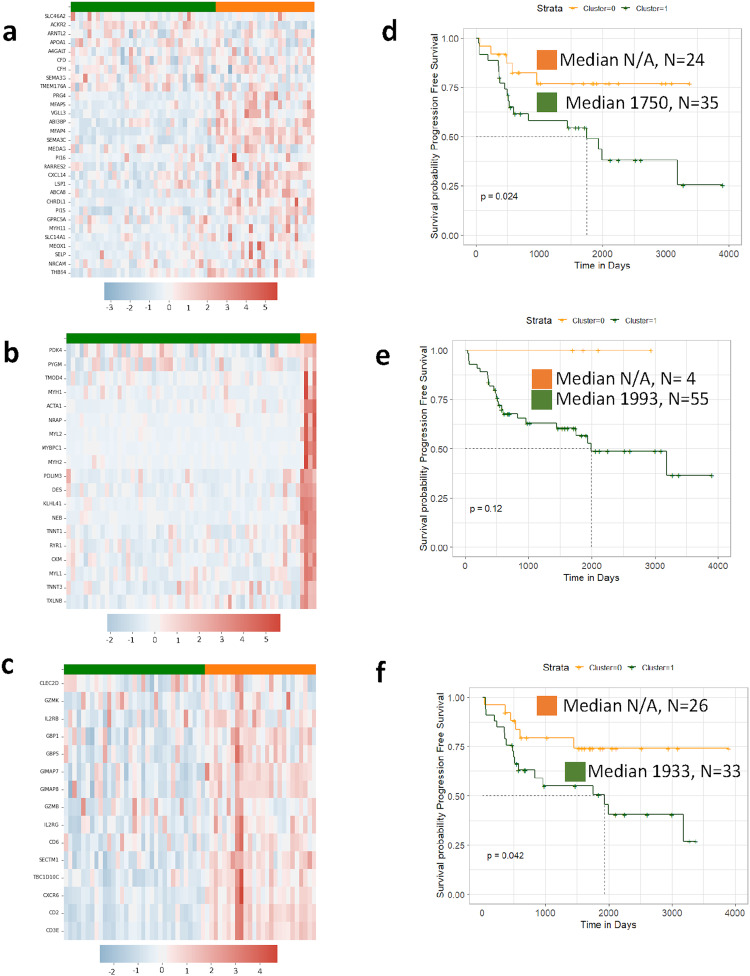
Canine osteosarcoma is increasingly recognized as an informative model for human osteosarcoma. Here we show in one of the largest clinically annotated canine osteosarcoma transcriptional datasets that two previously reported, as well as de novo gene signatures devised through single sample Gene Set Enrichment Analysis (ssGSEA), have prognostic utility in both human and canine patients. Shared molecular pathway alterations are seen in immune cell signaling and activation including TH1 and TH2 signaling, interferon signaling, and inflammatory responses. Virtual cell sorting to estimate immune cell populations within canine and human tumors showed similar trends, predominantly for macrophages and CD8+ T cells. Immunohistochemical staining verified the increased presence of immune cells in tumors exhibiting immune gene enrichment. Collectively these findings further validate naturally occurring osteosarcoma of the pet dog as a translationally relevant patient model for humans and improve our understanding of the immunologic and genomic landscape of the disease in both species.
© 2023. Springer Nature Limited.
Conflict of interest statement
The authors declare no competing interests.
Figures
Similar articles
-
Large-Scale Comparative Analysis of Canine and Human Osteosarcomas Uncovers Conserved Clinically Relevant Tumor Microenvironment Subtypes.Clin Cancer Res. 2024 Dec 16;30(24):5630-5642. doi: 10.1158/1078-0432.CCR-24-1854. Clin Cancer Res. 2024. PMID: 39412757 Free PMC article.
-
Characterization of canine osteosarcoma by array comparative genomic hybridization and RT-qPCR: signatures of genomic imbalance in canine osteosarcoma parallel the human counterpart.Genes Chromosomes Cancer. 2011 Nov;50(11):859-74. doi: 10.1002/gcc.20908. Epub 2011 Aug 11. Genes Chromosomes Cancer. 2011. PMID: 21837709
-
HES1, a target of Notch signaling, is elevated in canine osteosarcoma, but reduced in the most aggressive tumors.BMC Vet Res. 2013 Jul 1;9:130. doi: 10.1186/1746-6148-9-130. BMC Vet Res. 2013. PMID: 23816051 Free PMC article.
-
Canine osteosarcoma: a naturally occurring disease to inform pediatric oncology.ILAR J. 2014;55(1):69-85. doi: 10.1093/ilar/ilu009. ILAR J. 2014. PMID: 24936031 Review.
-
Comparative biology of human and canine osteosarcoma.Anticancer Res. 2007 Jan-Feb;27(1A):155-64. Anticancer Res. 2007. PMID: 17352227 Review.
Cited by
-
Directing B7-H3 chimeric antigen receptor T cell homing through IL-8 induces potent antitumor activity against pediatric sarcoma.J Immunother Cancer. 2024 Jul 23;12(7):e009221. doi: 10.1136/jitc-2024-009221. J Immunother Cancer. 2024. PMID: 39043604 Free PMC article.
-
Spatial Transcriptomics Advances the Use of Canine Patients in Cancer Research: Analysis of Osteosarcoma-Bearing Pet Dogs Enrolled in a Clinical Trial.Clin Cancer Res. 2025 Jul 15;31(14):2957-2962. doi: 10.1158/1078-0432.CCR-25-0687. Clin Cancer Res. 2025. PMID: 40392977
-
Establishment and Characterization of Cell Lines from Canine Metastatic Osteosarcoma.Cells. 2023 Dec 21;13(1):25. doi: 10.3390/cells13010025. Cells. 2023. PMID: 38201229 Free PMC article.
-
Bringing the Genomic Revolution to Comparative Oncology: Human and Dog Cancers.Annu Rev Biomed Data Sci. 2024 Aug;7(1):107-129. doi: 10.1146/annurev-biodatasci-102423-111936. Epub 2024 Jul 24. Annu Rev Biomed Data Sci. 2024. PMID: 38648188 Free PMC article. Review.
-
Clinical, pathologic and molecular findings in 2 Rottweiler littermates with appendicular osteosarcoma.Res Sq [Preprint]. 2024 Apr 11:rs.3.rs-4223759. doi: 10.21203/rs.3.rs-4223759/v1. Res Sq. 2024. PMID: 38659878 Free PMC article. Preprint.
References
-
- Jaffe N. Historical perspective on the introduction and use of chemotherapy for the treatment of osteosarcoma. Adv. Exp. Med. Biol. 2014;804:1–30. - PubMed
-
- Wedekind MF, Wagner LM, Cripe TP. Immunotherapy for osteosarcoma: where do we go from here? Pediatr. Blood Cancer. 2018;65:e27227. - PubMed
-
- Ling GV, Morgan JP, Pool RR. Primary bone rumors in the dog: a combined clinical, radiographic, and histologic approach to early diagnosis. J. Am. Vet. Med. Assoc. 1974;165:55–67. - PubMed
Publication types
MeSH terms
Grants and funding
LinkOut - more resources
Full Text Sources
Medical
Molecular Biology Databases
Research Materials
