. 2023 Sep;25(9):1346-1358.
doi: 10.1038/s41556-023-01210-z. Epub 2023 Aug 17.

KDM6A epigenetically regulates subtype plasticity in small cell lung cancer

Affiliations

KDM6A epigenetically regulates subtype plasticity in small cell lung cancer

Leslie Duplaquet et al. Nat Cell Biol. 2023 Sep.

Abstract

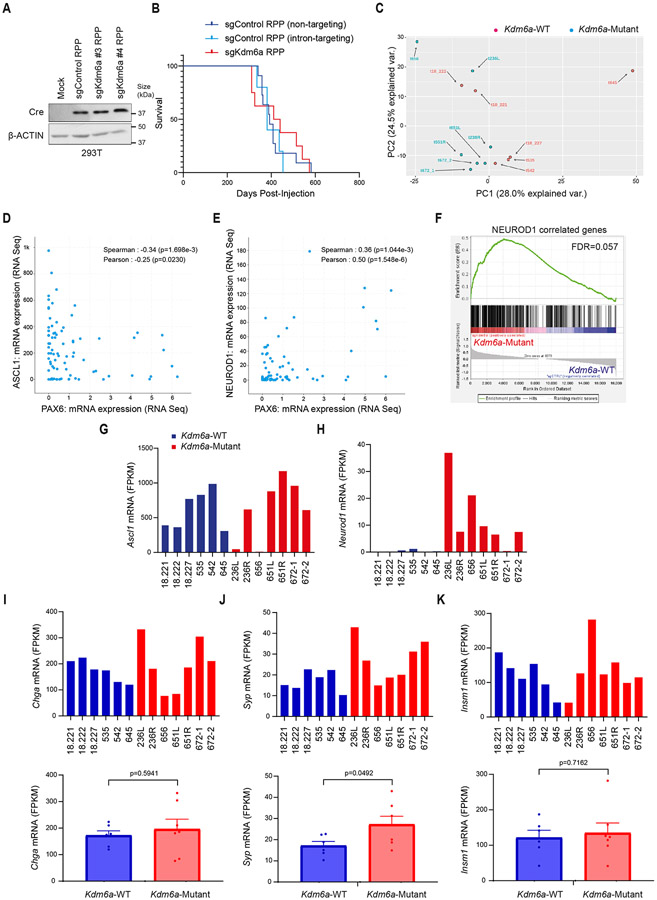
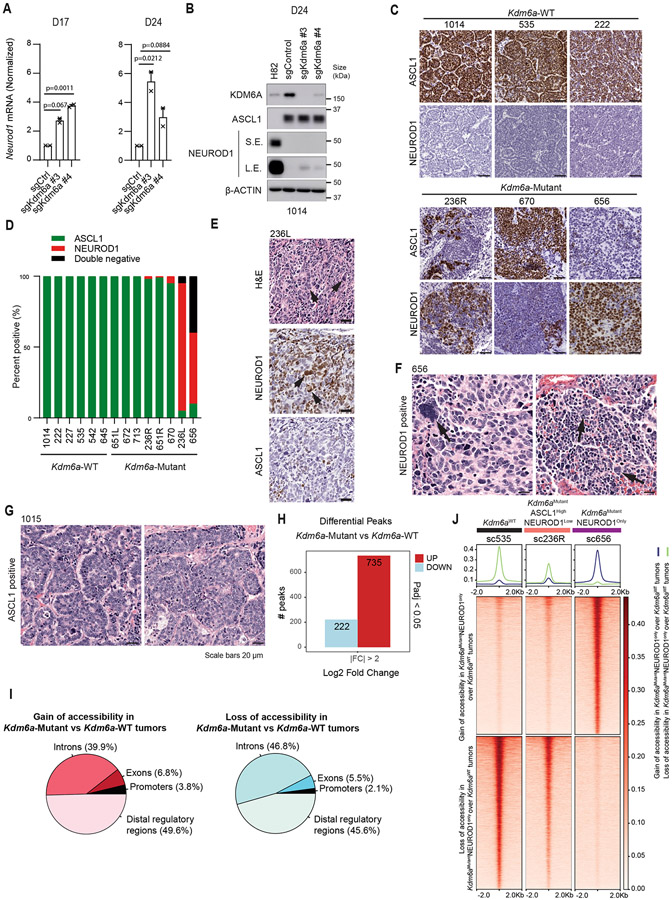
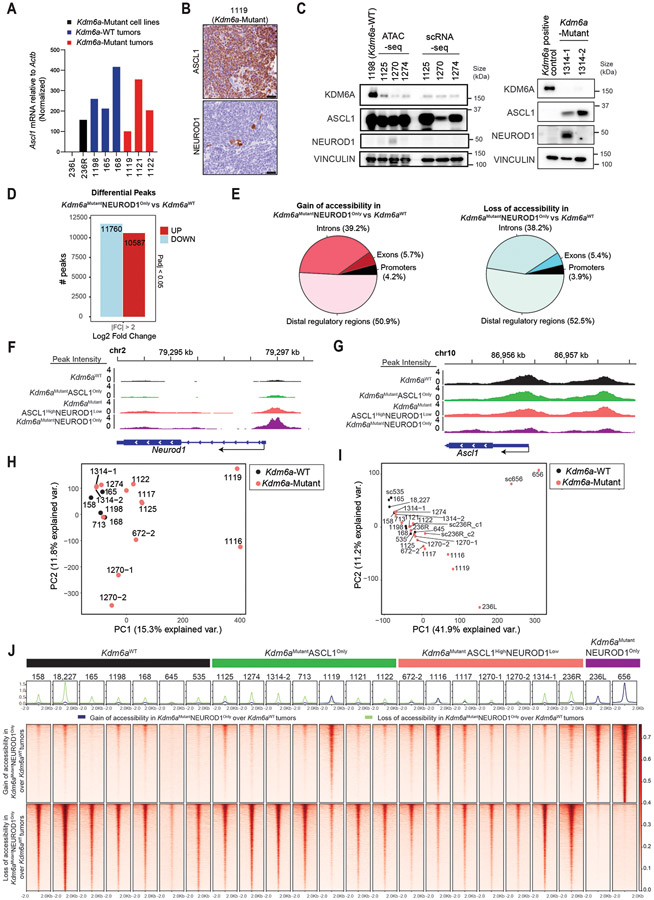
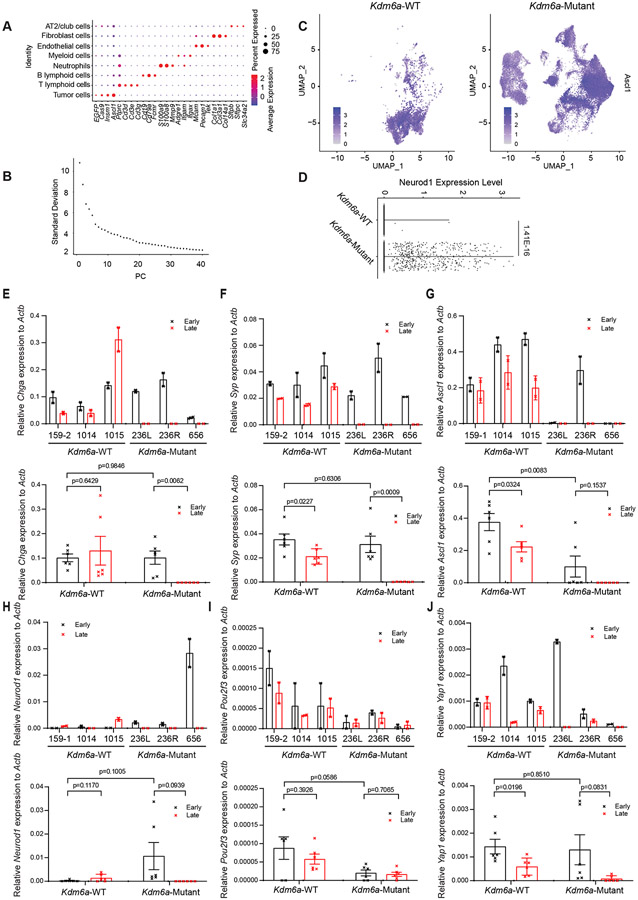
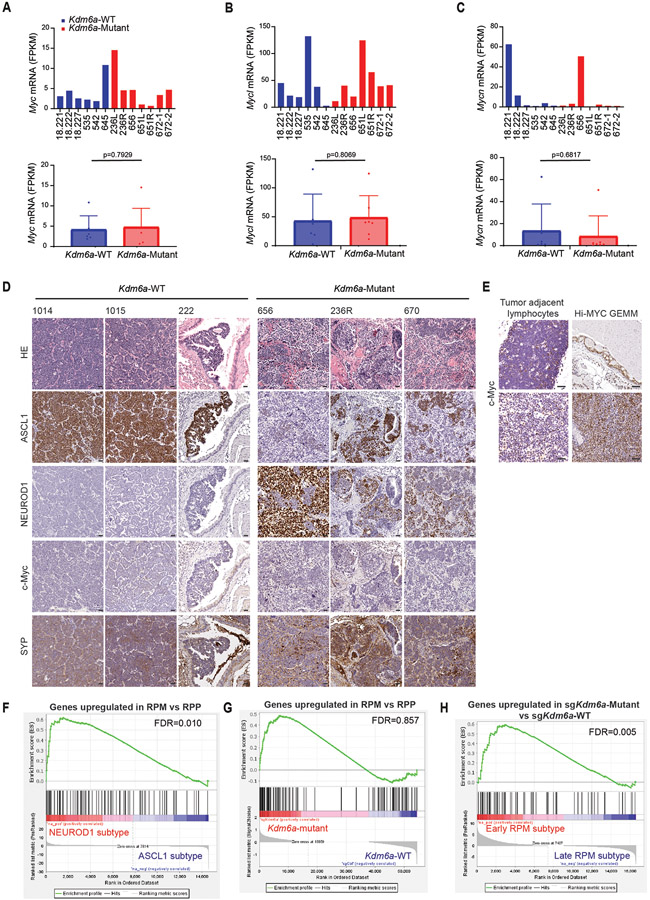
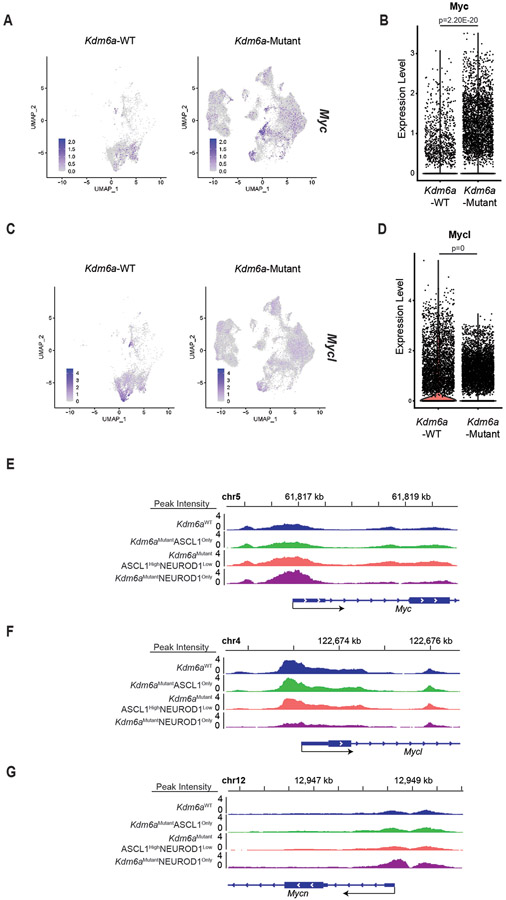
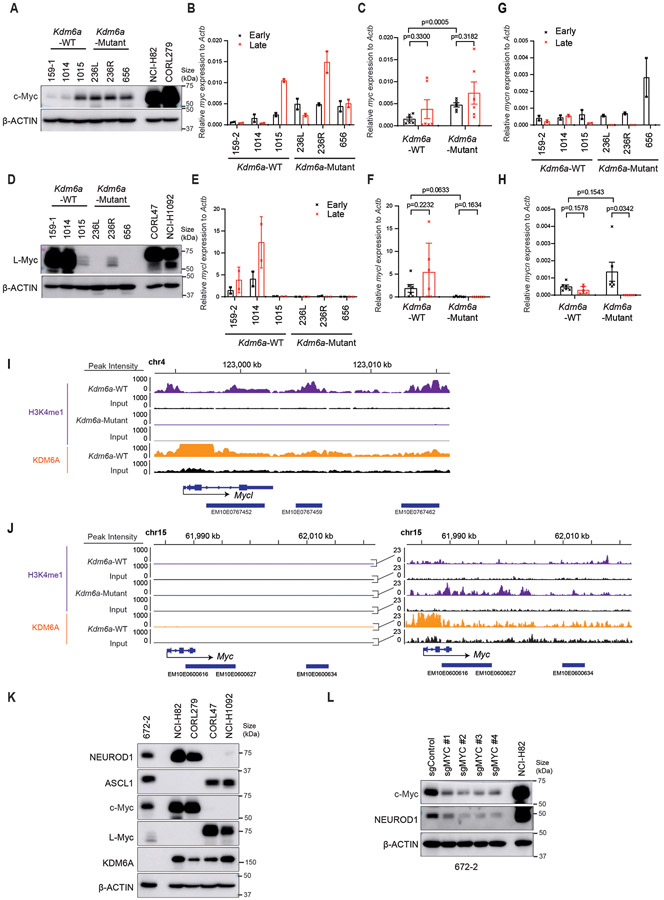
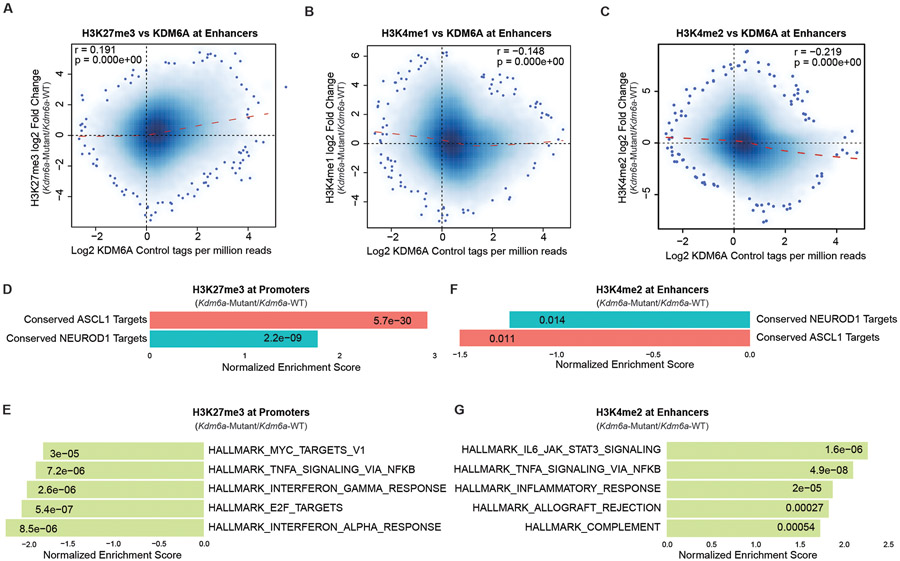
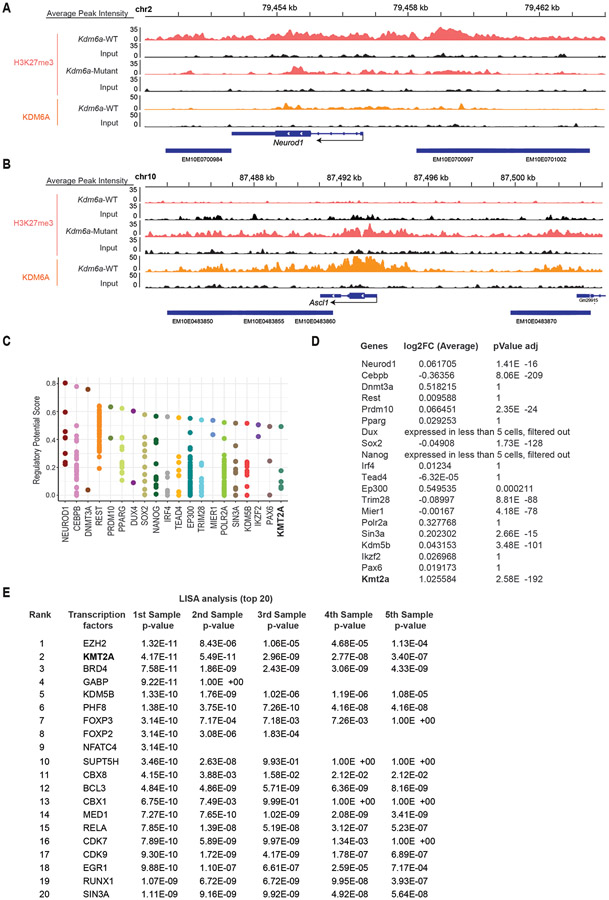
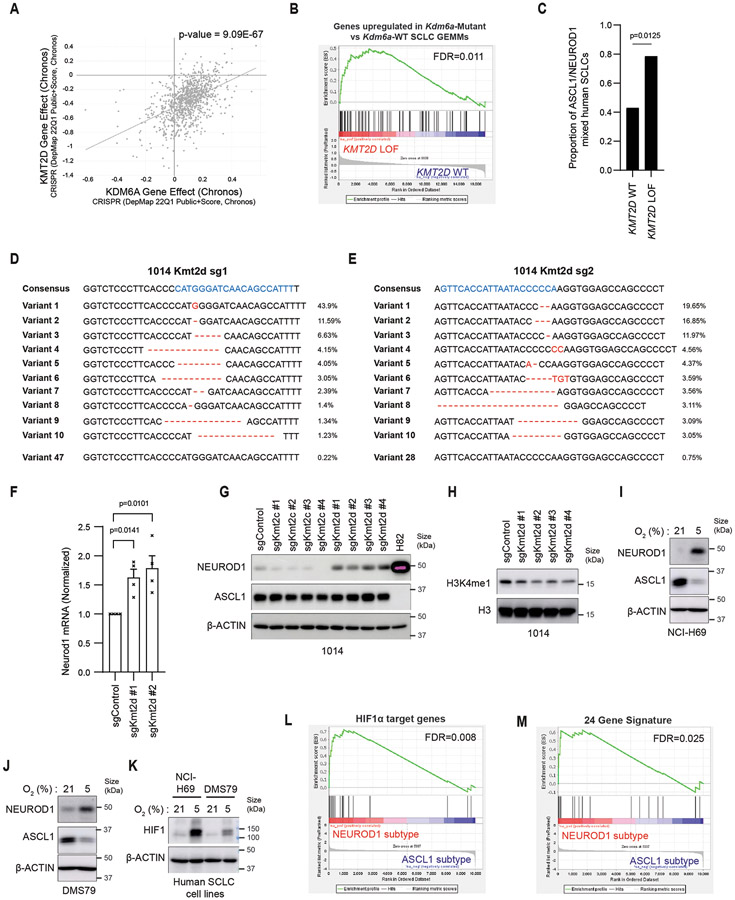
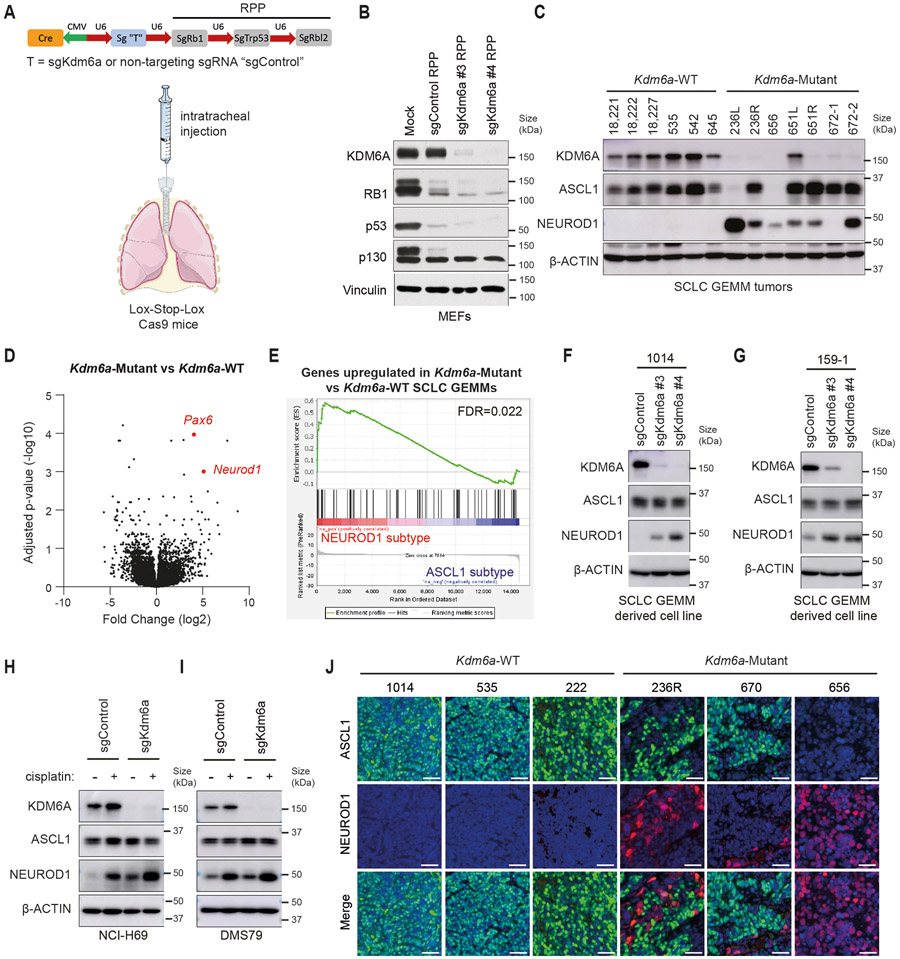
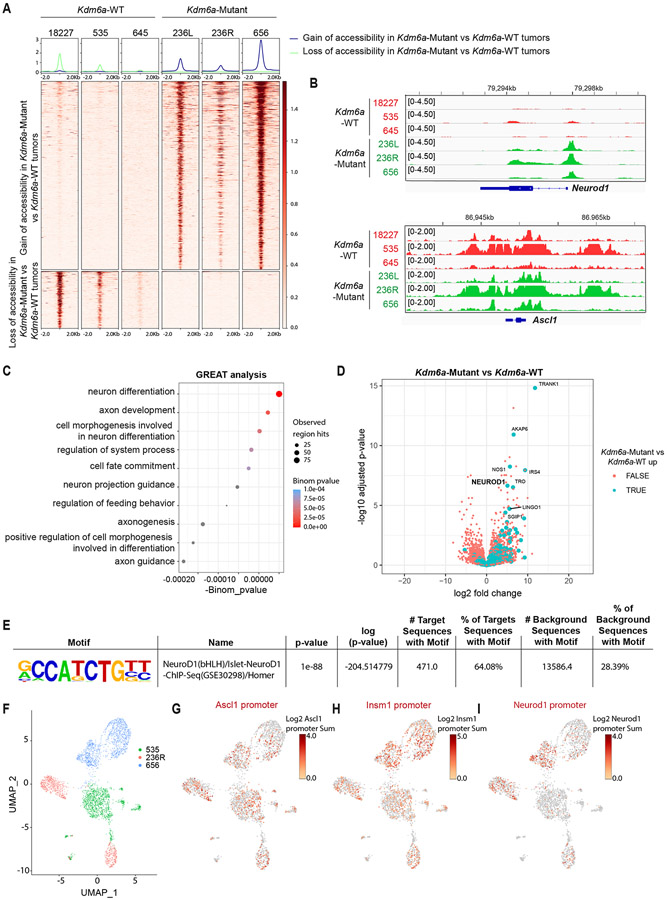
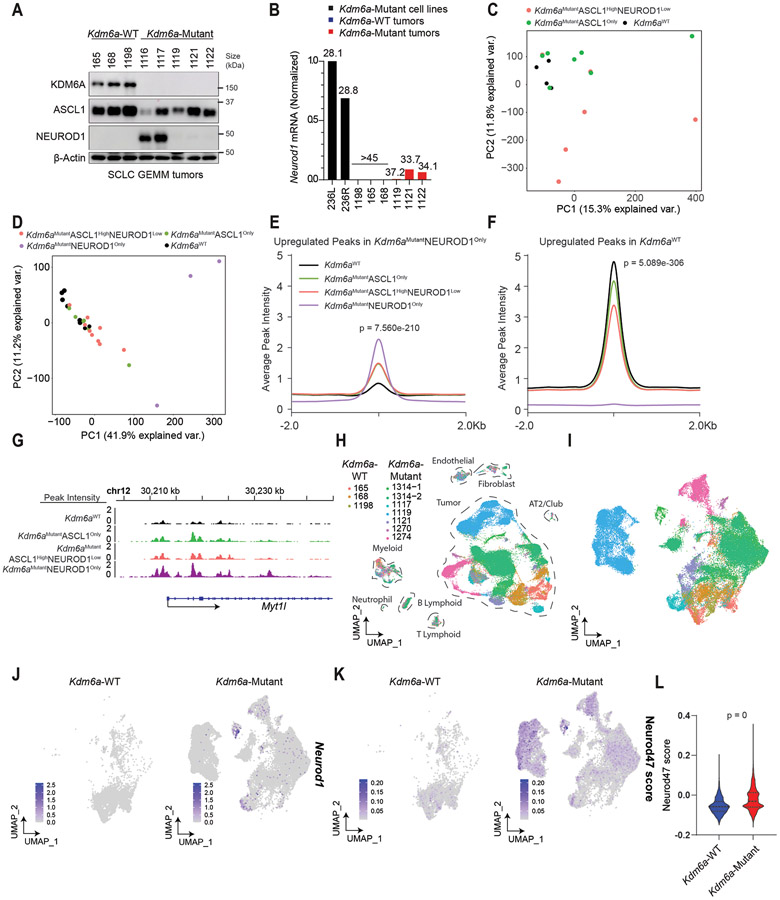
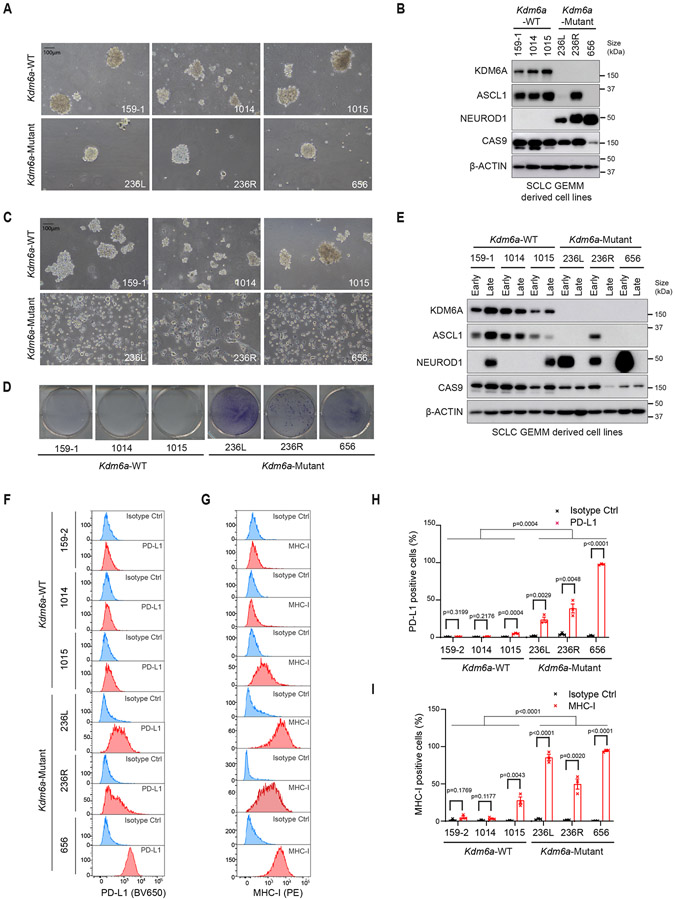
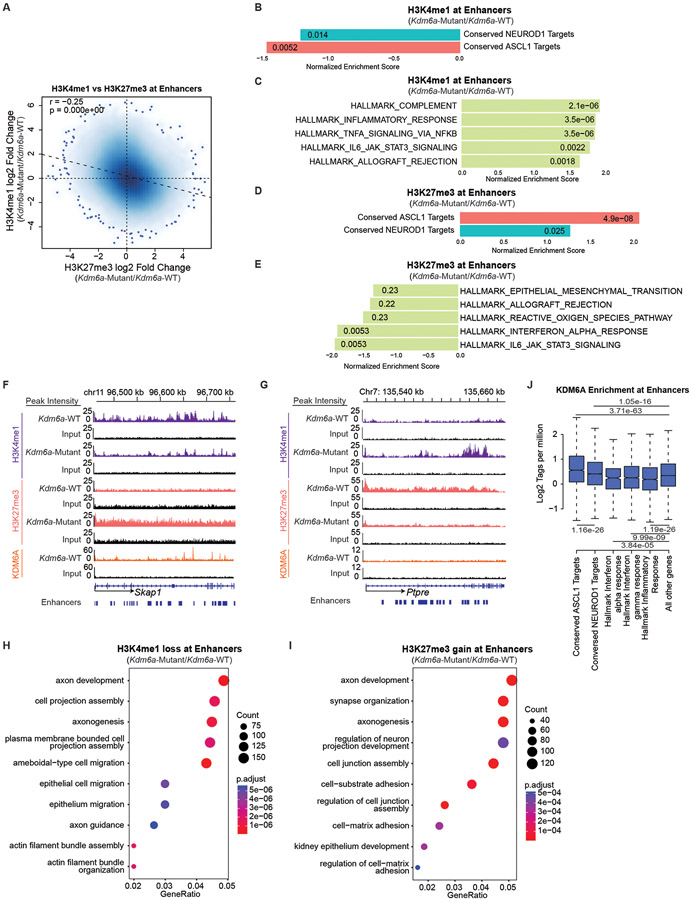
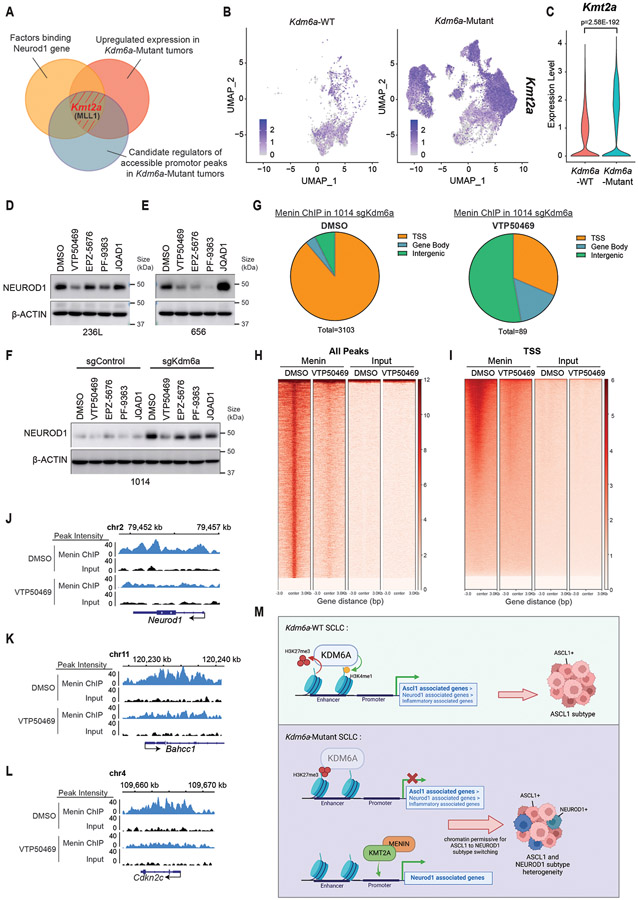
Small cell lung cancer (SCLC) exists broadly in four molecular subtypes: ASCL1, NEUROD1, POU2F3 and Inflammatory. Initially, SCLC subtypes were thought to be mutually exclusive, but recent evidence shows intra-tumoural subtype heterogeneity and plasticity between subtypes. Here, using a CRISPR-based autochthonous SCLC genetically engineered mouse model to study the consequences of KDM6A/UTX inactivation, we show that KDM6A inactivation induced plasticity from ASCL1 to NEUROD1 resulting in SCLC tumours that express both ASCL1 and NEUROD1. Mechanistically, KDM6A normally maintains an active chromatin state that favours the ASCL1 subtype with its loss decreasing H3K4me1 and increasing H3K27me3 at enhancers of neuroendocrine genes leading to a cell state that is primed for ASCL1-to-NEUROD1 subtype switching. This work identifies KDM6A as an epigenetic regulator that controls ASCL1 to NEUROD1 subtype plasticity and provides an autochthonous SCLC genetically engineered mouse model to model ASCL1 and NEUROD1 subtype heterogeneity and plasticity, which is found in 35-40% of human SCLCs.


Figures

Extended Data Fig. 1.
Extended Data Fig. 1.. KDM6A Inactivation in an Autochthonous SCLC Mouse Model Promotes NEUROD1 Expression Leading to SCLC Tumors that Express both ASCL1 and NEUROD1
(a) Immunoblot analysis of 293T cells infected with adenoviruses that encoded Cre recombinase and the indicated sgRNAs. (b) Kaplan-Meier survival analysis of LSL-Cas9 mice IT injected with the indicated adenoviruses. p=0.3447 for sgKdm6a RPP vs. sgControl RPP (non-targeting), p=0.2781 for sgKdm6a RPP vs. sgControl RPP (intron-targeting), p=0.3481 for sgControl RPP (non-targeting) vs. sgControl RPP (intron-targeting). n=11 mice sgControl RPP (non-targeting), n=5 mice sgControl RPP (intron-targeting), and n=8 mice (sgKdm6a#4 RPP). (c) Principal component analysis (PCA) of gene expression from RNA-seq data of 6 Kdm6a-WT SCLC mice tumors (18,221, 18,222, 18,227, 535, 542, 645) and 7 Kdm6a-Mutant SCLC mice tumors (236L, 236R, 656, 651L, 651R, 672-1, 672-2) in Fig. 1d. (d, e) mRNA expression of ASCL1 vs. PAX6 (D) or NEUROD1 vs. PAX6 (e) from publicly available RNA-seq data set of 81 human SCLC samples from George et al. Nature 2015. p-values are generated from cbioportal.org. (f) Gene set enrichment analysis (GSEA) of RNA-seq data (from Fig. 1d, Extended Data Fig. 1c) of NEUROD1 correlated genes (401 genes; see Borromeo et al. Cell Reports 2016, see Supplemental Table 2). FDR q-value calculated using GSEA is indicated. (g-k) mRNA expression from the RNA-seq data (from Fig. 1d) for Ascl1 (g), Neurod1 (h), Chromogranin A (i), Synaptophysin (j) and Insm1 (k) of individual Kdm6a-WT and Kdm6a-Mutant mouse SCLC tumors. For i, j, and k, lower graphs show average mRNA expression in Kdm6a-WT vs. Kdm6a-Mutant lung tumors (see Supplementary Table 2). For i,j,k, data are presented as mean values ± SEM. Statistical significance was calculated using unpaired, two-tailed students t-test and p-values are indicated on each figure panel. n=6 Kdm6a-WT tumors from independent mice and n=7 Kdm6a-Mutant tumors.
Extended Data Fig. 2.
Extended Data Fig. 2.. IHC and ATAC-seq Data from Kdm6a-Mutant vs. Kdm6a-WT Autochthonous SCLC tumors from Figs. 1&2
(a) RT-qPCR for Neurod1 at the times indicated after transduction of mouse SCLC cell lines derived from Kdm6a-WT mice (1014) with 2 independent Kdm6a sgRNAs or a non-targeting sgRNA (sgControl). Data are relative to Actb and then normalized to Neurod1 expression in sgControl sample. n=2 biological independent experiments. Data are presented as mean values ± SEM. Statistical significance was calculated using unpaired, two-tailed students t-test and p-values are indicated. (b) Immunoblot analysis of the cells from a 24 days after transduction. NCI-H82 cells, a human NEUROD1-high SCLC cell line, is used a positive control for NEUROD1 expression. (c) Immunohistochemistry (IHC) for ASCL1 and NEUROD1 from 3 Kdm6a-WT and 3 Kdm6a-Mutant mouse SCLC lung tumors. Scale Bar=50 μm. (d) Quantification of ASCL1-positive, NEUROD1-positive and ASCL1/NEUROD1-negative (double-negative) cells in Kdm6a-WT tumors (n=6 tumors) and Kdm6a-Mutant tumors (n=7 tumors) from the multiplex-IF data in Fig. 1j. (e) Representative H&E and IHC staining for NEUROD1 and ASCL1 of a Kdm6a-Mutant tumor (236L). (f,g) Representative H&E of a Kdm6a-Mutant tumor (656) (f) and a Kdm6a-WT tumor (1015) (g). For e and f, black arrows show enlarged nuclei of NEUROD1-positive cells with occasional multi-nucleated giant cells. Scale Bar=20 μm. (h) Bar graph of upregulated (red) and downregulated (blue) differential accessible peaks with LFC>2, pAdj<0.05 from ATAC-seq data in Fig. 2a in Kdm6a-Mutant vs Kdm6a-WT tumors. p-values are calculated using Wald test in DEseq2 and adjusted for multiple hypothesis testing. (i) Pie charts of genomic location of differential accessible peaks from a. (j) Heat maps of ATAC-seq read densities from pseudo-bulk analysis of scATAC-seq data from Fig. 2f showing gain (n=11,760 peaks) or loss (n=10,587) of accessibility of Kdm6aMutantNEUROD1Only vs Kdm6aWT SCLC tumors (see Extended Data Fig. 3d).
Extended Data Fig. 3.
Extended Data Fig. 3.. Analysis of Bulk ATAC-seq from Kdm6a-Mutant vs. Kdm6a-WT Tumors from Fig. 3
(a) RT-qPCR for Ascl1 mRNA expression relative to Actb and then normalized to Ascl1 expression in the 236L cell line of mouse SCLC lung tumors from Fig. 3a. (b) IHC for ASCL1 and NEUROD1 from the 1119 Kdm6a-Mutant mouse SCLC tumor showing rare NEUROD1-positive cells. Scale Bar= 50 μm. (c) Immunoblot analysis of SCLC lung tumors formed in an additional cohort of LSL-Cas9 mice injected with sgControl RPP (Kdm6a-WT) or sgKdm6a RPP (Kdm6a-Mutant) adenoviruses. For the immunoblot on the left, a separate piece of each tumor was used for bulk ATAC-seq and scRNA-seq experiments and hence immunoblots were run for each sample. Note that the piece of tumor 1270 used for ATAC-seq did show faint NEUROD1 expression while the 1270 sample used for scRNA-seq did not show any detectable NEUROD1 expression. This was likely related to heterogeneity within the tumor sample. (d) Bar graph of upregulated (red) and downregulated (blue) differential accessible peaks with LFC>2, pAdj<0.05 from ATAC-seq data used to identify accessibility changes in Kdm6aMutantNEUROD1Only tumors for analyses in Figs. 3e,f and hence differential accessibility analysis was performed comparing Kdm6aMutantNEUROD1Only tumors (236, 656) vs. Kdm6aWT SCLC tumors (158, 18227, 165, 1198, 168, 645, 535, sc535). p-values are calculated using Wald test in DEseq2 and adjusted for multiple hypothesis testing. (e) Pie charts of genomic location of differential accessible peaks from d. (f,g) Chromatin accessibility tracks for the average of each phenotype indicated (see Figs. 3c-g) at Neurod1 (f) or Ascl1 (g) from all ATAC-seq data from Fig. 3d. (h, i) PCA of all ATAC-seq data from Fig. 3c (h) and Fig. 3d (i) now classified by genotype (Kdm6a-Mutant vs. Kdm6a-WT) rather than phenotype. (j) Heat maps of ATAC-seq read densities from all bulk ATAC-seq data from Figs. 3d-f showing gain (n=11,760 peaks) or loss (n=10,587) of accessibility in Kdm6aMutantNEUROD1Only vs Kdm6aWT SCLC tumors (see Extended Data Fig. 3d) for all phenotypes indicated.
Extended Data Fig. 4.
Extended Data Fig. 4.. Additional scRNA-seq Data from Kdm6a-Mutant vs. Kdm6a-WT Tumors from Fig. 3 and Additional RT-qPCR Data from Tumor Derived Cell Lines from Fig. 4
(a) Dot plot showing the average expression of marker genes to identify immune cell subpopulations of all cells in Fig 3h. The size of the dot represents the percentage of cells expressing a particular gene while color represents the mean gene expression levels (blue is low and red is high). (b) Elbow plot showing the standard deviation associated with the top 40 PCs in the tumor population. (c) Feature plot of Ascl1 of all tumor cells from scRNA-seq data in Kdm6a-Mutant vs. Kdm6a-WT (see Fig. 3i). (d) Neurod1 violin plot using scRNA-seq data from Fig. 3j of tumor cells from Kdm6a-Mutant and Kdm6a-WT tumors. For d, non-parametric Wilcoxon rank sum test was used to generate a two-tailed p-value adjusted for multiple comparisons by Bonferroni correction. n=35,446 Kdm6a-Mutant and n=6,612 Kdm6a-WT tumor cells. Each individual dot represents a cell. (e-j) RT-qPCR for Chromogranin A (e), Synaptophysin (f), Ascl1 (g), Neurod1 (h) Pou2f3 (i) and Yap1 (j) mRNA expression in the early vs. late passage tumor-derived cell lines of individual Kdm6a-WT and Kdm6a-Mutant (upper graphs) or average mRNA expression in Kdm6a-WT vs. Kdm6a-Mutant cell lines (lower graphs). n=6 biological independent experiments for each genotype (2 biological independent experiments for each cell line). Data are presented as mean values ± SEM. Statistical significance was calculated using unpaired, two-tailed students t-test and p-values are indicated on each figure panel. For all t-tests comparing Kdm6a-Mutant vs. Kdm6a-WT cell lines, all early passage Kdm6a-Mutant were compared to all early passage Kdm6a-WT cell lines.
Extended Data Fig. 5.
Extended Data Fig. 5.. Comparison of Kdm6a-Mutant SCLC GEMM with the Myc-driven RPM SCLC GEMM using RNA-seq and IHC from tumors
(a-c) mRNA expression from the RNA-seq data (from Fig. 1d) for Myc (a), Mycl (b) and Mycn (c) of individual Kdm6a-WT and Kdm6a-Mutant mouse SCLC tumors (top) or combined tumors by genotype (bottom). See Supplementary Table 2. For a,b,c, data are presented as mean values ± SEM. Statistical significance was calculated using unpaired, two-tailed students t-test and p-values are indicated on each figure panel. n=6 Kdm6a-WT tumors from independent mice and n=7 Kdm6a-Mutant tumors. (d) H&E and IHC staining for ASCL1, NEUROD1, c-Myc and Synaptophysin from 3 Kdm6a-WT (1014, 1015, 222) and 3 Kdm6a-Mutant (656, 236R, 670) mouse SCLC lung tumors. Scale Bar=50 μm. (e) IHC staining for c-Myc from tumor adjacent lymphocytes and high c-Myc prostate cancer GEMM as positive control of c-Myc staining. Scale Bar=50 μm. (f-h) GSEA of genes upregulated in the RPM vs. RPP GEMM with publicly available scRNA-seq data from human SCLCs of the ASCL1 and NEUROD1 subtypes (see Methods) (f), or with RNA-seq data from Kdm6a-Mutant vs. Kdm6a-WT tumors from Fig. 1d (g), or using GSEA of genes upregulated in Kdm6a-Mutant tumors (see Fig. 1e) with late RPM vs. early RPM subtypes. FDR q-values from GSEA adjusted for multiple hypothesis testing are indicated.
Extended Data Fig. 6.
Extended Data Fig. 6.. Myc and Mycl mRNA Expression and Chromatin Accessibility in Kdm6a-Mutant vs. Kdm6a-WT Tumors
(a-d) Feature plots with violin plot of single cells from tumors for Myc (a,b) and Mycl (c,d) expression from scRNA-seq data from Fig. 3i. For b,d, non-parametric Wilcoxon rank sum test was used to generate two-tailed p-values adjusted for multiple comparisons by Bonferroni correction. n=35,446 Kdm6a-Mutant and n=6,612 Kdm6a-WT tumor cells. Each individual dot represents a cell. Minimum and maximum values defined the range of violin plot. (e-g) Chromatin accessibility tracks for the average of each phenotype indicated (see Figs. 3c-g) at Myc (e), Mycl (f) and Mycn (g) from all ATAC-seq data from Fig. 3d.
Extended Data Fig. 7.
Extended Data Fig. 7.. Analysis of c-Myc and L-Myc in Kdm6a-Mutant vs. Kdm6a-WT Tumor Derived Cell Lines
(a) Immunoblot analysis for c-Myc with a c-Myc antibody (Y69) in Kdm6a-WT and Kdm6a-Mutant SCLC cell lines cultured in ultra-low attachment flasks at late times (>2 months) after cell line generation. NCI-H82 and CORL279 human SCLC cell lines are included as benchmark controls for SCLCs with high c-Myc expression. (b, c) RT-qPCR for Myc mRNA expression in the early vs. late passage Kdm6a-WT and Kdm6a-Mutant tumor-derived cell lines shown as individual lines (b) or grouped by genotype (c). (d) Immunoblot analysis for L-Myc with a specific L-Myc antibody (Cell Signaling E3M5P) in Kdm6a-WT and Kdm6a-Mutant SCLC cell lines cultured in ultra-low attachment flasks at late times (>2 months) after cell line generation. CORL47 and NCI-H1092 human SCLC cell lines are included as benchmark controls for SCLC cell lines with high L-Myc expression. CORL47 and NCI-H1092 express the RLF-MYCL fusion and hence MYCL migrates at higher molecular weights compared to WT L-Myc. (e-h) RT-qPCR for Mycl (e,f) or Mycn (g,h) mRNA expression in the early vs. late passage Kdm6a-WT and Kdm6a-Mutant lines shown as individual lines (e,g) or grouped by genotype (f,h). For all RT-qPCR experiments, n=6 biological independent experiments for each genotype (2 biological independent experiments for each cell line). Data are presented as mean values ± SEM. Statistical significance was calculated using unpaired, two-tailed students t-test and p-values are indicated. For all t-tests comparing Kdm6a-Mutant vs. Kdm6a-WT cell lines, early passage Kdm6a-Mutant vs. Kdm6a-WT were compared. (I,j) Tracks of H3K4me1, and KDM6A ChIP-seq for Mycl (i), and Myc (j) from ChIP-seq data from Fig. 5. Each track is the sum of 2 Kdm6a-WT cell lines (1014, 159-1) and 2 Kdm6a-Mutant cell lines (236L,236R) peaks with their respective input. (k) Immunoblot analysis for c-Myc and L-Myc in a Kdm6a-Mutant SCLC cell line (672-2) using highly specific antibodies with benchmark controls above. (l) Immunoblot analysis of 672-2 cells transduced with 4 independent Myc sgRNAs or a non-targeting control (sgControl) acutely after transduction and puromycin selection.
Extended Data Fig. 8.
Extended Data Fig. 8.. Correlation and GSEA Analyses of KDM6A, H3K27me3, H3K4me1, and H3K4me2 ChIP-seq Data in Kdm6a-WT and Kdm6a-Mutant SCLC Primary Cell Lines
(a) Genome-wide correlation of log fold change in H3K27me3 ChIP-seq (Kdm6a-Mutant/Kdm6a-WT) vs. log fold change in KDM6A ChIP-seq at enhancers. (b) Genome-wide correlation of log fold change in H3K4me1 ChIP-seq (Kdm6a-Mutant/Kdm6a-WT) vs. log fold change in KDM6A ChIP-seq at enhancers. (c) Genome-wide correlation of log fold change in H3K4me2 ChIP-seq (Kdm6a-Mutant/Kdm6a-WT) vs. log fold change in KDM6A ChIP-seq at enhancers. For a-c, r Pearson correlation coefficient and p-value are indicated. p-values were calculated using a two-sided Pearson’s correlation test and are indicated. (d, e) Normalized Enrichment Score from GSEA of H3K27me3 ChIP-seq at transcription start sites of conserved ASCL1 target genes or conserved NEUROD1 target genes (d) or top 5 enriched Hallmarks (e) from the ChIP-seq data in Fig. 5. (f, g) Normalized Enrichment Score from GSEA of H3K4me2 ChIP-seq at enhancers of conserved ASCL1 target genes or conserved NEUROD1 target genes (f) or top 5 enriched Hallmarks (g) from the ChIP-seq data in Fig. 5. For d-g, p-values were generated by GSEA using a permutation test adjusted for multiple hypothesis testing using the Benjamini-Hochberg correction. Adjusted p-values are indicated.
Extended Data Fig. 9.
Extended Data Fig. 9.. NEUROD1 Expression after KDM6A Inactivation is Partially Mediated by KMT2A
(a,b) Tracks of H3K27me3 and KDM6A ChIP-seq of Neurod1 (a) and Ascl1 (b) from ChIP-seq data from Fig. 5. Each track is the sum of the peaks of: 2 Kdm6a-WT tumor-derived cell lines for Kdm6a-WT (1014, 159-1) and 2 Kdm6a-Mutant tumor-derived cell lines for Kdm6a-Mutant (236L, 236R) with their respective input. (c) Cistrome analysis of transcription factors and chromatin regulators of Neurod1 gene in human hg38 (http://dbtoolkit.cistrome.org/) within 10 kilobases of the Neurod1 gene. (d) Pseudo-bulk differentially expressed gene (DEG) analysis from the scRNA-seq data in Fig. 3i in Kdm6a-Mutant vs Kdm6a-WT tumors cells of the genes in c. Non-parametric Wilcoxon rank sum test was used and p-values adjusted for multiple hypothesis testing are shown. (e) List of the top 20 candidate regulators of accessible peaks determined by LISA analysis of the 100 top differentially accessible peaks at TSSs with LFC>1 sorted by ascending p-value in Kdm6a-Mutant vs. Kdm6a-WT using ATAC-seq data from Fig. 2a (see Supplementary Table 8, tab 1 for complete list).
Extended Data Fig. 10.
Extended Data Fig. 10.. Analyses of KMT2D Loss or Hypoxia with NEUROD1 Expression in SCLC
(a) Correlation of KDM6A dependency vs. KMT2D depedency across hundreds of cancer cell lines. KMT2D is the #1 co-dependency with KDM6A (p-value=9.09x10−67 calculated using dependency map). (b) GSEA using publicly available datasets of human SCLCs with KMT2D LOF mutations or KMT2D WT using genes upregulated in Kdm6a-Mutant vs. Kdm6a-WT SCLC GEMMs (see Fig. 1d). FDR q-value generated using GSEA, adjusted for multiple-hypothesis testing, is indicated. (c) Proportion of mixed ASCL1 and NEUROD1 human SCLCs from RNA-seq data from 3 independent data sets,, (see methods) in SCLCs with KMT2D LOF mutations vs. KMT2D WT. Fisher’s exact test was used to generate p-value. For b,c, n=14 KMT2D LOF, n=142 KMT2D WT. See also Supplementary Table 9. (d, e) CRISPR amplicon sequencing of 1014 Kdm6a-WT cells transduced with 2 independent Kmt2d sgRNAs. sgRNA sequences are in blue and gene editing is in red. (f) RT-qPCR for Neurod1 in 1014 Kmt2d knockout cells in d,e 3 weeks after transduction. Data are relative to Actb and then normalized to Neurod1 expression in the sgControl (non-targeting) cell line. n=4 biological replicates and error bars represent mean ± SEM. Statistical significance was calculated using unpaired, two-tailed students t-test and p-values are indicated. (g,h) Immunoblot (g) and histone blot (h) analyses in 1014 cells transduced with 4 independent Kmt2c and Kmt2d sgRNAs or a non-targeting control (sgControl) 30 days post-transduction. (i,j) Immunoblot analysis of NEUROD1 and ASCL1 expression of (i) NCI-H69 and (j) DMS79 ASCL1-positive human SCLC cells cultured under 5% or 21% O2 for 7 days. (k) Immunoblot analysis for HIF1α protein of cells lines in i,j. (l, m) GSEA analysis of scRNA-seq from human ASCL1 or NEUROD1 SCLC tumors using (l) HIF1α target gene list or (m) 24 genes induced by hypoxia (see methods) (see Supplemental Table 10). FDR q-value adjusted for multiple hypothesis testing is indicated. Model-based Analysis of Single Cell Transcriptomics (MAST) was used to generate the GSEA expression profile.
Fig. 1.
Fig. 1.. KDM6A Inactivation in an Autochthonous SCLC Mouse Model Promotes NEUROD1 Expression Leading to SCLC Tumors that Express both ASCL1 and NEUROD1
(a) Schematic of the adenovirus used for intratracheal injection (IT) into the lungs of lox-stop-lox (LSL)-Cas9 mice to generate autochthonous SCLC tumors that are Kdm6a inactivated or Kdm6a wild-type (WT). RPP=sgRb1, sgTrp53, sgRbl2; sg “T”=sgKdm6a or sgControl (non-targeting sgRNA). (b) Immunoblot analysis of MEFs expressing Cas9 infected with the sgControl RPP, sgKdm6a #3 RPP or sgKdm6a #4 RPP adenoviruses as indicated. (c) Immunoblot analysis of SCLC lung tumors formed in LSL-Cas9 mice injected with sgControl RPP (Kdm6a-WT) or sgKdm6a RPP (Kdm6a-Mutant) adenoviruses. (d) Volcano plot of differential expression analysis from RNA-seq data comparing Kdm6a-Mutant vs. Kdm6a-WT from tumors in c. n=7 Kdm6a-Mutant tumors, n=6 Kdm6a-WT tumors. FDR p-values adjusted for multiple comparisons after log transformation are shown. Neurod1 and one of its target genes Pax6 are highlighted in red. (e) Gene set enrichment analysis (GSEA) of RNA-seq data from ASCL1 and NEUROD1 human SCLC tumors of the upregulated genes in Kdm6a-Mutant vs Kdm6a-WT GEMMs (see Supplementary Table 2). FDR q-value adjusted for multiple comparisons is indicated. (f, g) Immunoblot analysis of two mouse SCLC cell lines derived from Kdm6a-WT mice 1014 (f) and 159-1 (g) transduced with 2 independent Kdm6a sgRNAs or a non-targeting control (sgControl) and maintained in culture for 30 days post-transduction. (h, i) Immunoblot analysis of two human ASCL1-positive SCLC cell lines, NCI-H69 (h) and DMS79 (i), nucleofected with Cas9 RNP containing a Kdm6a sgRNA or a non-targeting control (sgControl). Cells were then treated with cisplatin (1 μM) or DMSO for 3 days. (j) Multiplexed immunofluorescence for ASCL1 and NEUROD1 from 3 Kdm6a-WT and 3 Kdm6a-Mutant mouse SCLC lung tumors indicated. Scale Bar= 50 μm.
Fig. 2.
Fig. 2.. KDM6A Inactivation Increases Chromatin Accessibility at the Neurod1 Promoter in Autochthonous SCLC Mouse Tumors
(a) Heat maps of ATAC-seq read densities of upregulated (n=735) and downregulated (n=222) peaks near promoters in Kdm6a-Mutant (236L, 236R, 656) vs. Kdm6a-WT (18227, 535, 645) mouse SCLC lung tumors. (b) Tracks of ATAC-seq data at Neurod1 (top) and Ascl1 (bottom) promoters from the Kdm6a-WT (red) and Kdm6a-Mutant (green) mouse SCLC tumors indicated. (c) Genomic Regions Enrichment of Annotations Tool (GREAT) analysis of ATAC-seq data (from a) of the changes in Kdm6a-Mutant tumors vs. Kdm6a-WT tumors. Binomial p-values were calculated using GREAT. (d) Volcano plot of differential expression analysis from RNA-seq data from Fig. 1 comparing Kdm6a-Mutant tumors vs. Kdm6a-WT tumors. TRUE/FALSE analysis indicates if ATAC-seq differential peaks have matched nearby gene. p-values are calculated using Wald test in DEseq2 and were adjusted for multiple hypothesis testing. (e) HOMER Motif Enrichment analysis from ATAC-seq data from a showing that the Neurod1 motif is the top enriched regulatory motif in Kdm6a-Mutant tumors vs. Kdm6a-WT tumors (see Supplementary Table 3, tab 4 for complete HOMER Motif enrichment list). p-values are calculated using binomial test in HOMER2. (f) Uniform Manifold Approximation and Projection (UMAP) of single-cell ATAC-seq data of all cells from three independent tumors from 3 independent mice. n=1252 cells from Kdm6a-WT tumor in green (535), n=830 cells and n=1258 cells from 2 Kdm6a-Mutant tumors from independent mice in red (236R) and blue (656). (g-i) Chromatin accessibility at Ascl1 promoter (g), Insm1 promoter (h) and Neurod1 promoter (i) from single-cell ATAC-seq data from f.
Fig. 3.
Fig. 3.. Kdm6a Inactivation Alters Chromatin Accessibility and mRNA Expression for ASCL1 to NEUROD1 Subtype Switching
(a) Immunoblot analysis of an additional cohort of SCLC lung tumors from LSL-Cas9 mice IT injected with sgControl RPP or sgKdm6a RPP adenoviruses. (b) RT-qPCR for Neurod1 from tumors from a where NEUROD1 protein was undetectable. Ct values of each sample are indicated on top. (c) PCA of all chromatin accessibility peaks from ATAC-seq data of 4 Kdm6aWT SCLC tumors, 7 Kdm6aMutantASCL1Only SCLC tumors, and 6 Kdm6aMutantASCL1HighNEUROD1Low SCLC tumors from the 2nd cohort of mice. (d) PCA of differential chromatin accessibility peaks in Kdm6aMutantNEUROD1Only vs. Kdm6aWT SCLC tumors (see Extended Data Fig. 3d) from both bulk and pseudo-bulk sc-ATAC-seq data of all tumors: 7 Kdm6aWT SCLC tumors, 7 Kdm6aMutantASCL1Only SCLC tumors, 7 Kdm6aMutantASCL1HighNEUROD1Low SCLC tumors, and 2 Kdm6aMutantNEUROD1Only SCLC tumors. For tumors in c,d, see Supplementary Table 4. (e, f) Average peak intensity at all peaks upregulated in Kdm6aMutantNEUROD1Only vs. Kdm6aWT (e) or upregulated in Kdm6aWT vs. Kdm6aMutantNEUROD1Only (f) for all tumors in d classified by phenotype. Legend in e also applies to f. p-values for e,f indicates comparisons among the 4 groups. p-values are calculated using Anderson-Darling k-sample test in R package “kSamples”. (g) Average chromatin accessibility tracks for each phenotype at the NEUROD1 target gene Myt1l from ATAC-seq data from d. (h) UMAP of all cells from scRNA-seq of the 10 autochthonous SCLC lung tumors indicated [3 Kdm6a-WT, 7 Kdm6a-Mutant including 5 Kdm6aMutantASCL1Only and 2 Kdm6aMutantASCL1HighNEUROD1Low). n=48,651 total cells. Cell types were determined based on representative marker expression (Extended Data Fig. 4a). (I) UMAP of all tumor cells from the scRNA-seq from h. (j,k) Feature plots of Neurod1 (j) or the Neurod47_score (k). (l) Neurod47_score violin plot from k. For l, non-parametric Wilcoxon rank sum test was used to generate a two-tailed p-value. n=35,446 Kdm6a-Mutant and n=6612 Kdm6a-WT tumor cells. Minimum and maximum values define the range of violin plot. Dotted lines represent median and upper and lower quartiles.
Fig. 4.
Fig. 4.. KDM6A Inactivation Accelerates Plasticity Between SCLC Subtypes
(a) Representative brightfield images and (b) immunoblot analysis of cell lines derived from Kdm6a-WT or Kdm6a-Mutant SCLC mouse lung tumors cultured in ultra-low attachment flasks at early times (<1 month) after the cell lines were generated (see Methods). (c) Representative brightfield images from cells in a and b after being maintained in ultra-low attachment flasks for 2 months in culture (late passage). (d) Crystal violet staining of late passage Kdm6a-WT or Kdm6a-Mutant cell lines plated on tissue culture treated 6-well plates for 48 hours. (e) Immunoblot analysis of cell lines shown in a and c comparing ASCL1 and NEUROD1 protein levels in early vs. late passage tumor-derived cell lines (see Methods). (f-i) Histograms (f,g) and quantification (h,i) of flow cytometry analysis for cell surface expression of PD-L1 (BV650) (f, h) and MHC class I (H2-Db) (PE) (g, i) in the late passage Kdm6a-WT and Kdm6a-Mutant cell lines. For f-i, n=3 biological independent experiments. Data are presented as mean values ± SEM. Statistical significance was calculated using unpaired, two-tailed students t-test and p-values are indicated on each figure panel. For all t-tests in h,i comparing all Kdm6a-Mutant vs. Kdm6a-WT cell lines, t-test compares all late passage Kdm6a-Mutant vs. all late passage Kdm6a-WT. Scale Bar=100 μm.
Fig. 5.
Fig. 5.. KDM6A Binds and Regulates Neuroendocrine Genes to Maintain a Chromatin State Permissive for the ASCL1 Subtype
(a) Genome-wide correlation of log fold change in H3K4me1 ChIP-seq (Kdm6a-Mutant/Kdm6a-WT) vs. log fold change in H3K27me3 ChIP-seq (Kdm6a-Mutant/Kdm6a-WT) at enhancers. See Supplementary Figs. 2&3. For a, r=Pearson correlation coefficient. p-value was calculated using a two-sided Pearson’s correlation test. (b, c) Normalized Enrichment Score from GSEA of H3K4me1 ChIP-seq at enhancers of conserved ASCL1 target genes or conserved NEUROD1 target genes (b) or top 5 enriched Hallmarks (c) from the ChIP-seq data in a. (d, e) Normalized Enrichment Score from GSEA of H3K27me3 ChIP-seq at enhancers of conserved ASCL1 or NEUROD1 target genes (d) or top 5 depleted Hallmarks (e) from the ChIP-seq data in a. (f, g) Tracks of H3K4me1, H3K27me3, and KDM6A ChIP-seq at the ASCL1 target gene Skap1 (f) or an inflammatory gene Ptpre (g) showing changes representative of the analyses in b-e. Each track is the peak sum of: 2 Kdm6a-WT tumor-derived cell lines for Kdm6a-WT (159-1,1014) and 2 Kdm6a-Mutant tumor-derived cell lines for Kdm6a-Mutant (236L,236R) with their respective input. (h,i) Gene ontology (GO) analysis of enhancers that lose H3K4me1 (h) or gain H3K27me3 (i) in Kdm6a-Mutant/Kdm6a-WT. For h,i, p-values were generated by GSEA using a permutation test adjusted for multiple hypothesis testing using the Benjamini-Hochberg correction. Adjusted p-values are indicated. (j) Boxplot of genome-wide KDM6A ChIP-seq enrichment at enhancers of ASCL1 conserved targets, NEUROD1 conserved targets, and inflammatory genes vs. all other genes. For j, indicated p-values are calculated using unpaired, two-sided, Mann-Whitney U tests adjusted for multiple hypothesis testing. n=2,958 enhancers (ASCL1), n=9,217 enhancers (NEUROD1), n=567 enhancers (Interferon α), n=2,220 enhancers (Interferon γ), n=2,442 enhancers (Inflammatory), n=191,064 enhancers (Other) from 2 biological independent replicates. The center line is the median, the lower and upper bounds represent 25% and 75% rank and the whiskers indicate 1.5 times the interquartile range. For all experiments, H3K4me1 and H3K27me3 ChIP-seq is from 2 independent Kdm6a-Mutant cell lines (236L,236R) and 2 independent Kdm6a-WT cell lines (1014,159-1). KDM6A ChIP-seq is from 2 independent Kdm6a-WT cell lines (1014,159-1). Also see Supplementary Table 7.
Fig. 6.
Fig. 6.. NEUROD1 Induction after KDM6A Inactivation is Partially Mediated by KMT2A
(a) Venn diagram of factors binding NEUROD1 (orange), upregulated expression in Kdm6a-Mutant tumors (red), and candidate regulators of accessible peaks at promoters in Kdm6a-Mutant tumors (blue). (b,c) Kmt2a feature plot (b) and violin plot (c) using scRNA-seq data from Fig. 3i of tumor cells from Kdm6a-Mutant and Kdm6a-WT tumors. For c, non-parametric Wilcoxon rank sum test was used to generate a two-tailed p-value adjusted for multiple comparisons by Bonferroni correction. Minimum and maximum values define the range of violin plot. n=35,446 Kdm6a-Mutant and n=6612 Kdm6a-WT tumor cells. (d-f) Immunoblot analysis of 236L (d) and 656 (e) Kdm6a-Mutant tumor derived cells lines or 1014 Kdm6a isogenic cells from Fig. 1f (f) treated with inhibitors that block the function of epigenetic modifiers that normally maintain gene expression including VTP50469 (Menin/MLL1 inhibitor, 500 nM), EPZ-5676 (DOT1L inhibitor, 1 μM), PF-9363 (KAT6A/KAT6B inhibitor, 100 nM), JQAD1 (EP300 degrader, 500 nM) or DMSO for 6 days. (g) Pie charts of Menin ChIP-seq data showing peak distributions throughout the genome of 1014 cells with Kdm6a CRISPR inactivation treated with VTP50469 (500 nM) or DMSO for 5 days. (h, i) Genome wide rank-ordered heat map of Menin ChIP signal at all peaks (h) or across promoters (TSS −3kB/+3kB) (i). A second replicate of the Menin-ChIP experiment in shown in Supplementary Fig. 5. (j-l) Menin ChIP-seq tracks at Neurod1 (j) and two canonical Menin target genes Bahcc1 (k) and Cdkn2c (l). (m) Schematic of the role of KDM6A in SCLC subtype plasticity. When KDM6A is present, KDM6A binds enhancers to increase H3K4 mono-methylation (H3K4me1) and decrease H3K27 tri-methylation (H3K27me3) maintaining a chromatin state most permissive for the ASCL1 subtype. When KDM6A is inactivated, ASCL1 subtype genes lose H3K4me1 and gain H3K27me3 at enhancers and chromatin becomes less permissive for the ASCL1 subtype. Upon KDM6A inactivation, KMT2A (MLL1) expression is upregulated and KMT2A/Menin binds the NEUROD1 promoter to promote NEUROD1 expression resulting in SCLC tumors with heterogenous ASCL1 and NEUROD1 expression. This figure was created with BioRender.com and publication license has been obtained.

Comment in

References

    1. Kalemkerian GP et al. Small cell lung cancer. J Natl Compr Canc Netw 11, 78–98 (2013). - PMC - PubMed
    1. Rudin CM, Brambilla E, Faivre-Finn C & Sage J Small-cell lung cancer. Nat Rev Dis Primers 7, 3, doi: 10.1038/s41572-020-00235-0 (2021). - DOI - PMC - PubMed
    1. Rudin CM et al. Molecular subtypes of small cell lung cancer: a synthesis of human and mouse model data. Nat Rev Cancer 19, 289–297, doi: 10.1038/s41568-019-0133-9 (2019). - DOI - PMC - PubMed
    1. George J. et al. Comprehensive genomic profiles of small cell lung cancer. Nature 524, 47–53, doi: 10.1038/nature14664 (2015). - DOI - PMC - PubMed
    1. Peifer M. et al. Integrative genome analyses identify key somatic driver mutations of small-cell lung cancer. Nat Genet 44, 1104–1110, doi: 10.1038/ng.2396 (2012). - DOI - PMC - PubMed

References for Methods

    1. DuPage M, Dooley AL & Jacks T Conditional mouse lung cancer models using adenoviral or lentiviral delivery of Cre recombinase. Nat Protoc 4, 1064–1072, doi: 10.1038/nprot.2009.95 (2009). - DOI - PMC - PubMed
    1. Subramanian A. et al. Gene set enrichment analysis: a knowledge-based approach for interpreting genome-wide expression profiles. Proc Natl Acad Sci U S A 102, 15545–15550, doi: 10.1073/pnas.0506580102 (2005). - DOI - PMC - PubMed
    1. Yang L. et al. Validation of a hypoxia related gene signature in multiple soft tissue sarcoma cohorts. Oncotarget 9, 3946–3955, doi: 10.18632/oncotarget.23280 (2018). - DOI - PMC - PubMed
    1. Benita Y. et al. An integrative genomics approach identifies Hypoxia Inducible Factor-1 (HIF-1)-target genes that form the core response to hypoxia. Nucleic Acids Res 37, 4587–4602, doi: 10.1093/nar/gkp425 (2009). - DOI - PMC - PubMed
    1. Bankhead P. et al. QuPath: Open source software for digital pathology image analysis. Sci Rep 7, 16878, doi: 10.1038/s41598-017-17204-5 (2017). - DOI - PMC - PubMed

Publication types