. 2023 Sep;42(38):2841-2853.
doi: 10.1038/s41388-023-02806-3. Epub 2023 Aug 17.

ASCL2 induces an immune excluded microenvironment by activating cancer-associated fibroblasts in microsatellite stable colorectal cancer

Affiliations

ASCL2 induces an immune excluded microenvironment by activating cancer-associated fibroblasts in microsatellite stable colorectal cancer

Dan Zhang et al. Oncogene. 2023 Sep.

Abstract

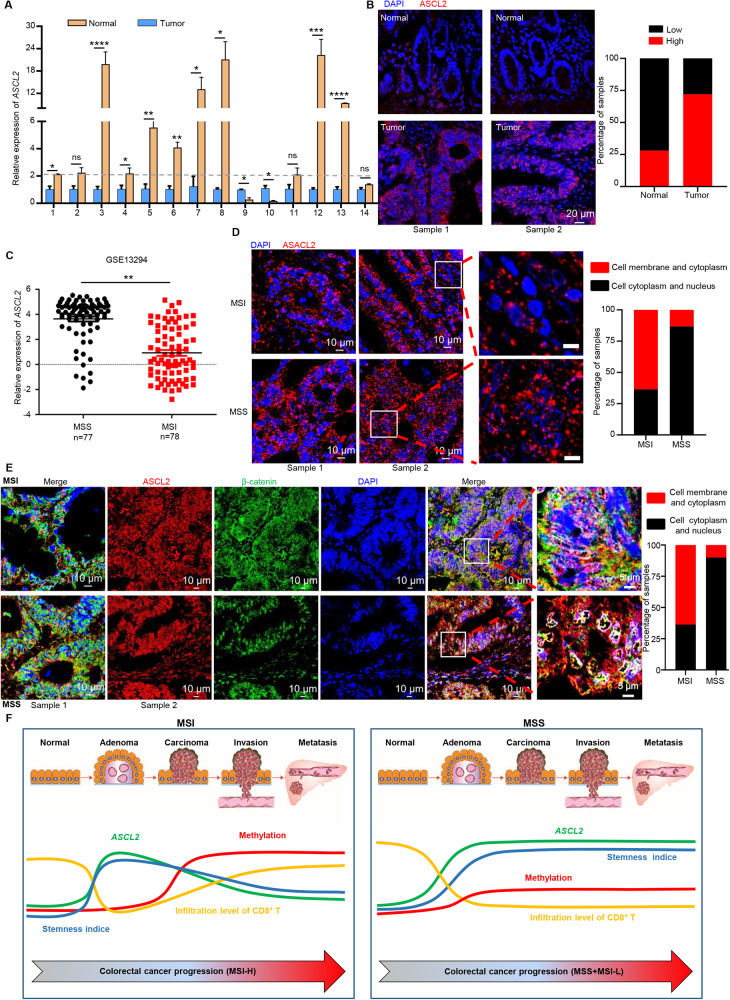
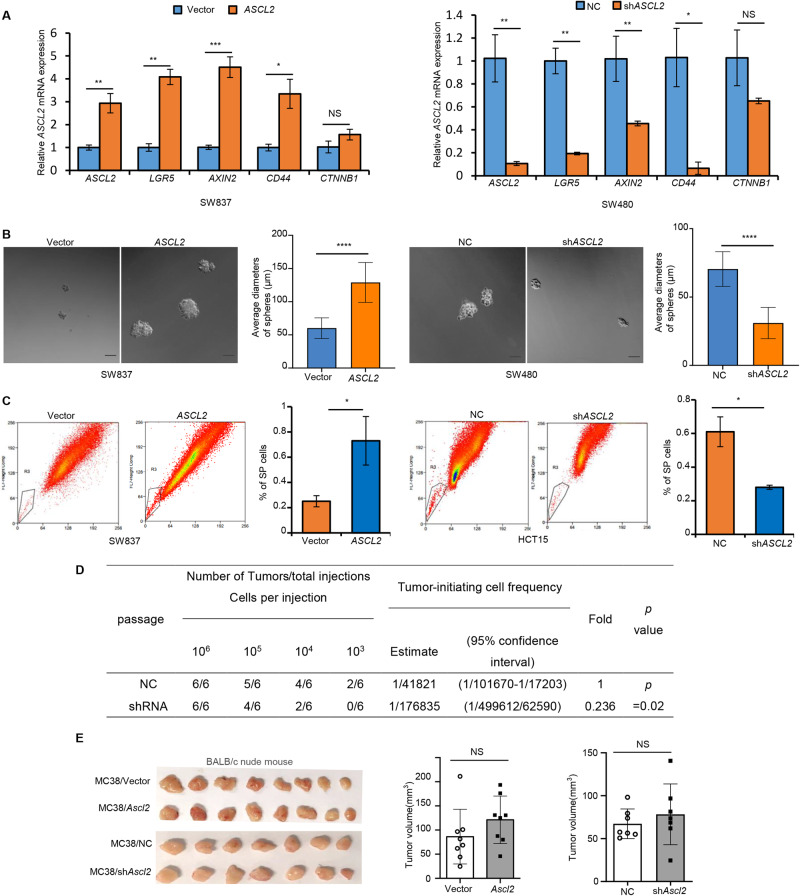
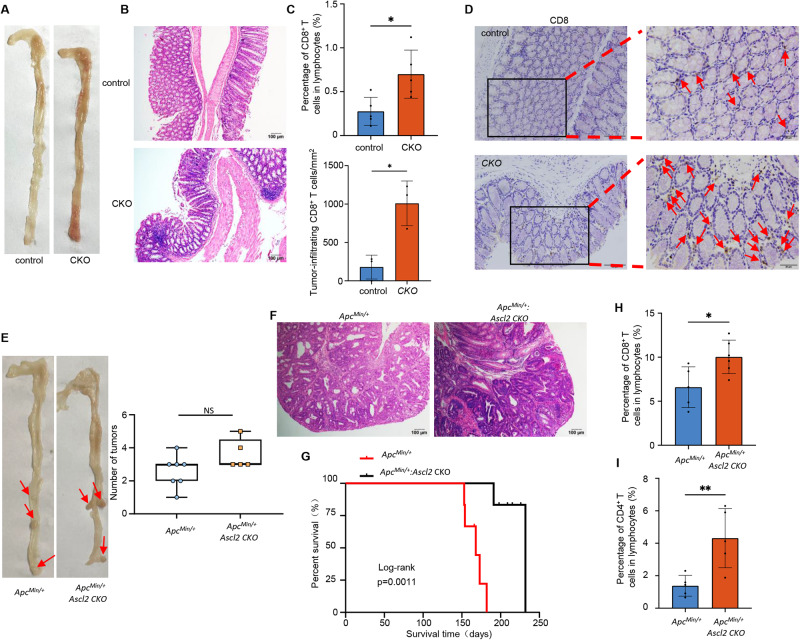
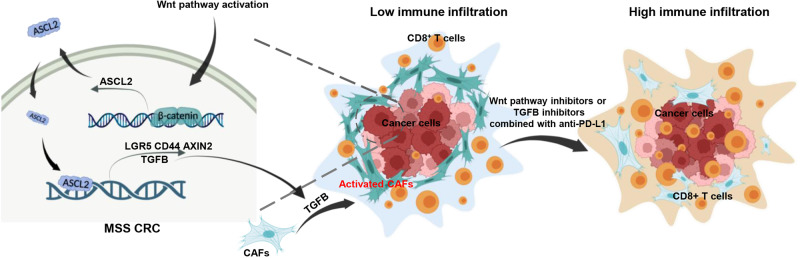
Proficient mismatch repair or microsatellite stable (pMMR/MSS) colorectal cancers (CRCs) are vastly outnumbered by deficient mismatch repair or microsatellite instability-high (dMMR/MSI-H) tumors and lack a response to immune checkpoint inhibitors (ICIs). In this study, we reported two distinct expression patterns of ASCL2 in pMMR/MSS and dMMR/MSI-H CRCs. ASCL2 is overexpressed in pMMR/MSS CRCs and maintains a stemness phenotype, accompanied by a lower density of tumor-infiltrating lymphocytes (TILs) than those in dMMR/MSI CRCs. In addition, coadministration of anti-PD-L1 antibodies facilitated T cell infiltration and provoked strong antitumor immunity and tumor regression in the MC38/shASCL2 mouse CRC model. Furthermore, overexpression of ASCL2 was associated with increased TGFB levels, which stimulate local Cancer-associated fibroblasts (CAFs) activation, inducing an immune-excluded microenvironment. Consistently, mice with deletion of Ascl2 specifically in the intestine (Villin-Cre+, Ascl2 flox/flox, named Ascl2 CKO) revealed fewer activated CAFs and higher proportions of infiltrating CD8+ T cells; We further intercrossed Ascl2 CKO with ApcMin/+ model suggesting that Ascl2-deficient expression in intestinal represented an immune infiltrating environment associated with a good prognosis. Together, our findings indicated ASCL2 induces an immune excluded microenvironment by activating CAFs through transcriptionally activating TGFB, and targeting ASCL2 combined with ICIs could present a therapeutic opportunity for MSS CRCs.


Conflict of interest statement

The authors declare no competing interests.

Figures

Fig. 1
Fig. 1. There are two distinct expression patterns of ASCL2 in MSS and MSI-H CRCs.
A Expression of ASCL2 mRNA in the 14 pairs of CRC specimens. Error bars, mean ± SD; *p < 0.05, **p < 0.01, ***p < 0.001, ****p < 0.0001, NS no significance. B Representative IF images show low or high levels of anti-ASCL2 staining in CRC tissues and adjacent epithelium. Histograms represent the statistics of ASCL2 expression. Scale bar, 20 μm. C Expression of ASCL2 mRNA in the GSE13294 dataset (77 MSS CRC tumors and 78 MSI CRC tumors). **p < 0.01. D Representative immunofluorescence (IF) images indicating ASCL2 protein expression in 11 cases of MSI and 30 cases of MSS CRCs. Histograms represent statistics of major expression locations of ASCL2 in colorectal cancer cells. Scale bar, 10 and 5 μm (right). E Representative images of multiplexed immunofluorescence (mIF) showed the expression of ASCL2 and β-catenin in 10 cases of MSI and 10 cases of MSS CRCs. Green = β-catenin, red = ASCL2, blue = DAPI. Histogram represents statistics of major expression locations of ASCL2 and β-catenin in colorectal cancer cells. Scale bar, 10 and 5 μm (right). F ASCL2 expression pattern diagram. There are two distinct expression patterns of ASCL2 in MSS and MSI CRCs. The expression of ASCL2 is silenced by methylation in MSI CRCs, accompanied by decreased stemness index and increased abundance of CD8+ T cells infiltrating the tumor. In contrast, in MSS CRCs, the continuous activation of the Wnt signaling pathway leads to increased ASCL2 expression followed by a subsequently increased stemness index, resulting in decreased tumor-infiltrating CD8+ T cells.
Fig. 2
Fig. 2. ASCL2 expression maintains the stemness phenotype without affecting the proliferation of CRC cells.
A The mRNA levels of stem cell markers (AXIN2, LGR5, and CD44) and CTNNB1 were examined by RT‒PCR in CRC cells. B Single cells were cultured in stem cell medium for 14 days, and the diameters of at least 20 tumorospheres were counted. Histograms represent the statistics of tumorspheres average diameters. Scale bar, 50 μm. C SP cells in CRC cells were sorted by flow cytometry following Hoechst 33342 staining. Live tumor cells are shown separated by their emission of Hoechst blue (450/50 nm bandpass filter) and Hoechst red (670/30 nm bandpass filter). Histograms represent the statistics of the percentage of SP cells. D The frequencies of tumor-initiating cells were analyzed by extreme limiting dilution assays (ELDAs) in NOD/SCID mice (n = 6 mice per group). E MC38/Vector cells, MC38/Ascl2, MC38/NC and MC38/shAscl2 cells were injected subcutaneously into nude mice (n = 8, 8, 7 and 7 mice, respectively). Tumors were collected and measured after the mice were sacrificed. Histograms represent the statistics of tumor volume. All quantification analyses were shown as mean ± SD. *p < 0.05, **p < 0.01, ***p < 0.001, ****p < 0.0001, NS no significance.
Fig. 3
Fig. 3. ASCL2 induces an immune excluded microenvironment in CRCs in vivo.
A Representative images of mIF indicated the expression of ASCL2, CD8a, and α-SMA in MSI (n = 10) and MSS (n = 10) CRCs. Green = α-SMA, red = ASCL2, purple = CD8a. Scale bar, 100 μm. Box plot represents the quantification of tumor-infiltrating CD8+ T cells density in MSI (n = 10) and MSS (n = 10) tumors (multiple areas) at 10x objective lens. The middle bar, median; box, inter-quartile range; ****p < 0.0001. B MC38/Vector cells, MC38/ASCL2, MC38/NC and MC38/shASCL2 cells were injected subcutaneously into injecting C57BL/6 mice (n = 6). Histograms represent the statistics of tumor volume. Error bars, mean ± SD; ****p < 0.0001. C Subcutaneous tumors formed by MC38/NC and MC38/shAscl2 cells were taken to H&E staining. Scale bar, 50 μm (right). Histograms of tumor-infiltrated CD8+ T cells (D), CD4+ T cells (F), and CD11C+CD11B DCs (H) cells profiling using flow cytometry, immunohistochemistry (IHC) staining of CD8+ T cells (E) and CD4+ T cells (G) in a subcutaneous xenograft tumor model formed by MC38/NC and MC38/shAscl2 cells. The arrows indicate representative monitored immune cells. Histograms represent the quantification of tumor-infiltrating CD8+ T cells (E) and CD4+ T cells (G) density in mice tumors (multiple areas) at 20x objective lens. Scale bar, 20 and 10 μm (inset). Error bars, mean ± SD; *p < 0.05, **p < 0.01, ***p < 0.001, ****p < 0.0001. I Representative images of primary tumors in C57BL/6 mice (n = 6) formed by MC38/NC and MC38/shAscl2 cells in the orthotropic transplantation assay of the intestines. Histogram represents the statistics of tumor volume. Error bars, mean ± SD; *p < 0.05. J Histogram represents the statistics of percentage of CD8+ T cells in tumor-infiltrating lymphocytes using flow cytometry in the above orthotopic implantation mouse model formed by MC38/NC and MC38/shAscl2 cells. Error bars, mean ± SD; *p < 0.05. K Representative images of mIF for CD8 (red) and α-SMA (green) in orthotopic implantation tumor tissue. Scale bar, 100 and 25 μm (inset). Histogram represents the quantification of tumor-infiltrating CD8+ T cells density in the orthotopic implantation mouse model (multiple areas) at 10x objective lens. Error bars, mean ± SD; ****p < 0.0001.
Fig. 4
Fig. 4. ASCL2 CKO mice show enhanced inflamed immune microenvironment formation.
Representative images of macroscopic polyps (A) and H&E staining (B) in the Ascl2 CKO mice and control (Ascl2flox/flox) mice. Scale bar, 100 μm. C Histogram of infiltrating CD8+ T cells in the intestinal epithelium as assayed by flow cytometry in the Ascl2 CKO mice and control (Ascl2flox/flox) mice. Error bars, mean ± SD; *p < 0.05. D IHC staining of CD8+ T cells in the intestinal epithelium of the Ascl2 CKO mice and control mice. The arrow indicates representative monitored immune cells. Histogram represents the quantification of infiltrating CD8+ T cells in the intestinal epithelium of the CKO mice and control mice at 20x objective lens. Scale bar, 50 and 20 μm (right). Representative images of macroscopic polyps (E) and H&E staining (F) in the ApcMin/+ mice and ApcMin/+; Ascl2 CKO mice (n = 7 and 5 mice, respectively), as well as monitoring overall survival (n = 6) (G), determined by the Kaplan–Meier analysis (p < 0.05). Box plot represents the statistics of tumor numbers. Scale bar, 100 μm. The middle bar, median; box, inter-quartile range; NS no significance. Histograms of infiltrating CD8+ T cells (H) and CD4+ T (I) cells in the tumor tissue as assayed by flow cytometry in the ApcMin/+ mice and ApcMin/+; Ascl2 CKO mice. Error bars, mean ± SD; *p < 0.05.
Fig. 5
Fig. 5. Ascl2 promotes CRCs progression by inhibiting CD8+ T cell infiltration in the tumor microenvironment.
A The ratio of the tumor terminal volume to the initial volume after anti-PD-L1 treatment in the mouse CRC model formed by MC38/NC and MC38/shAscl2 cells. Error bars, mean ± SD; **p < 0.01, ***p < 0.001. B Representative images of IHC for CD8+ T cells in the mouse tumor treated with anti-PD-L1. Scale bar, 20 and 10 μm (inset). The arrows indicate representative monitored immune cells. Histogram represents the quantification of tumor-infiltrating CD8+ T cells in the mice (n = 3) at 20x objective lens. Error bars, mean ± SD; *p < 0.05, **p < 0.01. C Tumor-infiltrated CD8+ T cell profiling in the mouse CRC model treated with anti-PD-L1 by flow cytometry. Histogram represents the statistics of the percentage of CD8+ T cell in tumor-infiltrating lymphocytes. Error bars, mean ± SD; *p < 0.05, **p < 0.01, ****p < 0.0001. D The ratio of the tumor terminal volume to the initial volume with or without XAV939 treatment in the mouse CRC model formed by MC38/NC and MC38/shAscl2 cells. Error bars, mean ± SD; *p < 0.05. E Representative images of IHC for CD8+ T cells in the mouse tumor treated with XAV939. Scale bar, 20 and 10 μm (inset). Histogram represents the quantification of tumor-infiltrating CD8+ T cells in the mice (n = 3) at 20x objective lens. Error bars, mean ± SD; **p < 0.01. F Tumor-infiltrated CD8+ T cell profiling in the mouse CRC model treated with XAV939 by flow cytometry. Histogram represents the statistics of the percentage of CD8+ T cell in tumor-infiltrating lymphocytes. Error bars, mean ± SD; *p < 0.05.
Fig. 6
Fig. 6. ASCL2 induces CAFs activation to exclude CD8+ T cells by transcriptionally activating TGFB.
A Representative images of mIF for CD8 (purple) and α-SMA (green) in the ApcMin/+ mice and ApcMin/+; Ascl2 CKO mice tumor. Scale bar, 100 μm. Histogram represents the quantification of tumor-infiltrating CD8+ T cells density in mice tumors (multiple areas from 3 tumors) at 10x objective lens. The middle bar, median; box, inter-quartile range; ***p < 0.001. B Collagen deposition using Sirius red staining in the ApcMin/+ mice and ApcMin/+; Ascl2 CKO mice tumor. Scale bar, 50 μm. CF Caco-2 cells were transfected with shASCL2, and the supernatant was filtered and collected after 48 h, followed by coculture with human primary CAFs for 48 h. IL-6 production was measured by ELISA (C). The expression of αSMA (red) was detected by IF (D) and Western blot (E). The relative mRNA expressions of functional molecules CXCL12, TGFB, and HGF were detected by RT‒PCR (F). Error bars, mean ± SD; **p < 0.001. ****p < 0.0001. Scale bar, 100 and 50 μm. G CD8+ T cell migration assay diagram showed activated CD8+ T cells labeled with CFSE were indirectly cocultured with preformed 3D tumor spheroid (left and top). Based on the migration assay model, preformed 3D tumor spheroid was co-cultured with human primary CAFs (left and bottom), followed by activated CD8+ T cells labeled CSFE placed in the upper chamber and visualized by fluorescence microscopy (middle). Histogram represents the statistics of CD8+ T cells in the lower chamber (right). Scale bar, 50 μm. Error bars, mean ± SD; *p < 0.05, **p < 0.01, ****p < 0.001. H Schematic diagram of the TGFB promoter, the position of ASCL2 binding sites is indicated by yellow rectangles, and the mutated nucleotides of ASCL2 binding motif in TGFB promoter are highlighted in red. I ChIP was performed to analyze ASCL2 binding to the TGFB promoter. RT‒PCR experiment was performed with primers against the indicated area in the TGFB promoter. Error bars, mean ± SD; **p < 0.01. J Relative expression of WT or mutant TGFB promoter-driven luciferase reporters in ASCL2-overexpressing cells. Error bars, mean ± SD; **p < 0.01, ***p < 0.001. K Caco-2 cells were transfected with shASCL2 for 48 h before TGFB was assayed using ELISA. Error bars, mean ± SD; **p < 0.01. L Protein expression of TGFB in intestinal epithelial cells in indicated mice. α-Tubulin was used as a loading control.
Fig. 7
Fig. 7. Schematic representation of this study.
In MSS CRCs, abnormal activation of Wnt signaling pathway leads to increased expression of target gene ASCL2, resulting in enhanced stemness of CRC cells. Meanwhile, ASCL2 activates CAFs through transcriptional activation of TGFB, and CD8+ T cells are blocked from entering tumor cells by CAFs barriers, inducing an immune-excluded microenvironment.

Similar articles

Cited by

References

    1. Punt CJ, Koopman M, Vermeulen L. From tumour heterogeneity to advances in precision treatment of colorectal cancer. Nat Rev Clin Oncol. 2017;14:235–46. doi: 10.1038/nrclinonc.2016.171. - DOI - PubMed
    1. Li H, Courtois ET, Sengupta D, Tan Y, Chen KH, Goh JJL, et al. Reference component analysis of single-cell transcriptomes elucidates cellular heterogeneity in human colorectal tumors. Nat. Genet. 2017;49:708–18. doi: 10.1038/ng.3818. - DOI - PubMed
    1. Boland CR, Goel A. Microsatellite instability in colorectal cancer. Gastroenterology. 2010;138:2073–87.e2073. doi: 10.1053/j.gastro.2009.12.064. - DOI - PMC - PubMed
    1. Diaz LA, Jr, Shiu KK, Kim TW, Jensen BV, Jensen LH, Punt C, et al. Pembrolizumab versus chemotherapy for microsatellite instability-high or mismatch repair-deficient metastatic colorectal cancer (KEYNOTE-177): final analysis of a randomised, open-label, phase 3 study. Lancet Oncol. 2022;23:659–70. doi: 10.1016/S1470-2045(22)00197-8. - DOI - PMC - PubMed
    1. Chen L, Jiang X, Li Y, Zhang Q, Li Q, Zhang X, et al. How to overcome tumor resistance to anti-PD-1/PD-L1 therapy by immunotherapy modifying the tumor microenvironment in MSS CRC. Clin Immunol. 2022;237:108962. doi: 10.1016/j.clim.2022.108962. - DOI - PubMed

Publication types

Substances