. 2023 Sep;8(9):1653-1667.
doi: 10.1038/s41564-023-01449-0. Epub 2023 Aug 17.

Chikungunya virus cell-to-cell transmission is mediated by intercellular extensions in vitro and in vivo

Affiliations

Chikungunya virus cell-to-cell transmission is mediated by intercellular extensions in vitro and in vivo

Peiqi Yin et al. Nat Microbiol. 2023 Sep.

Abstract

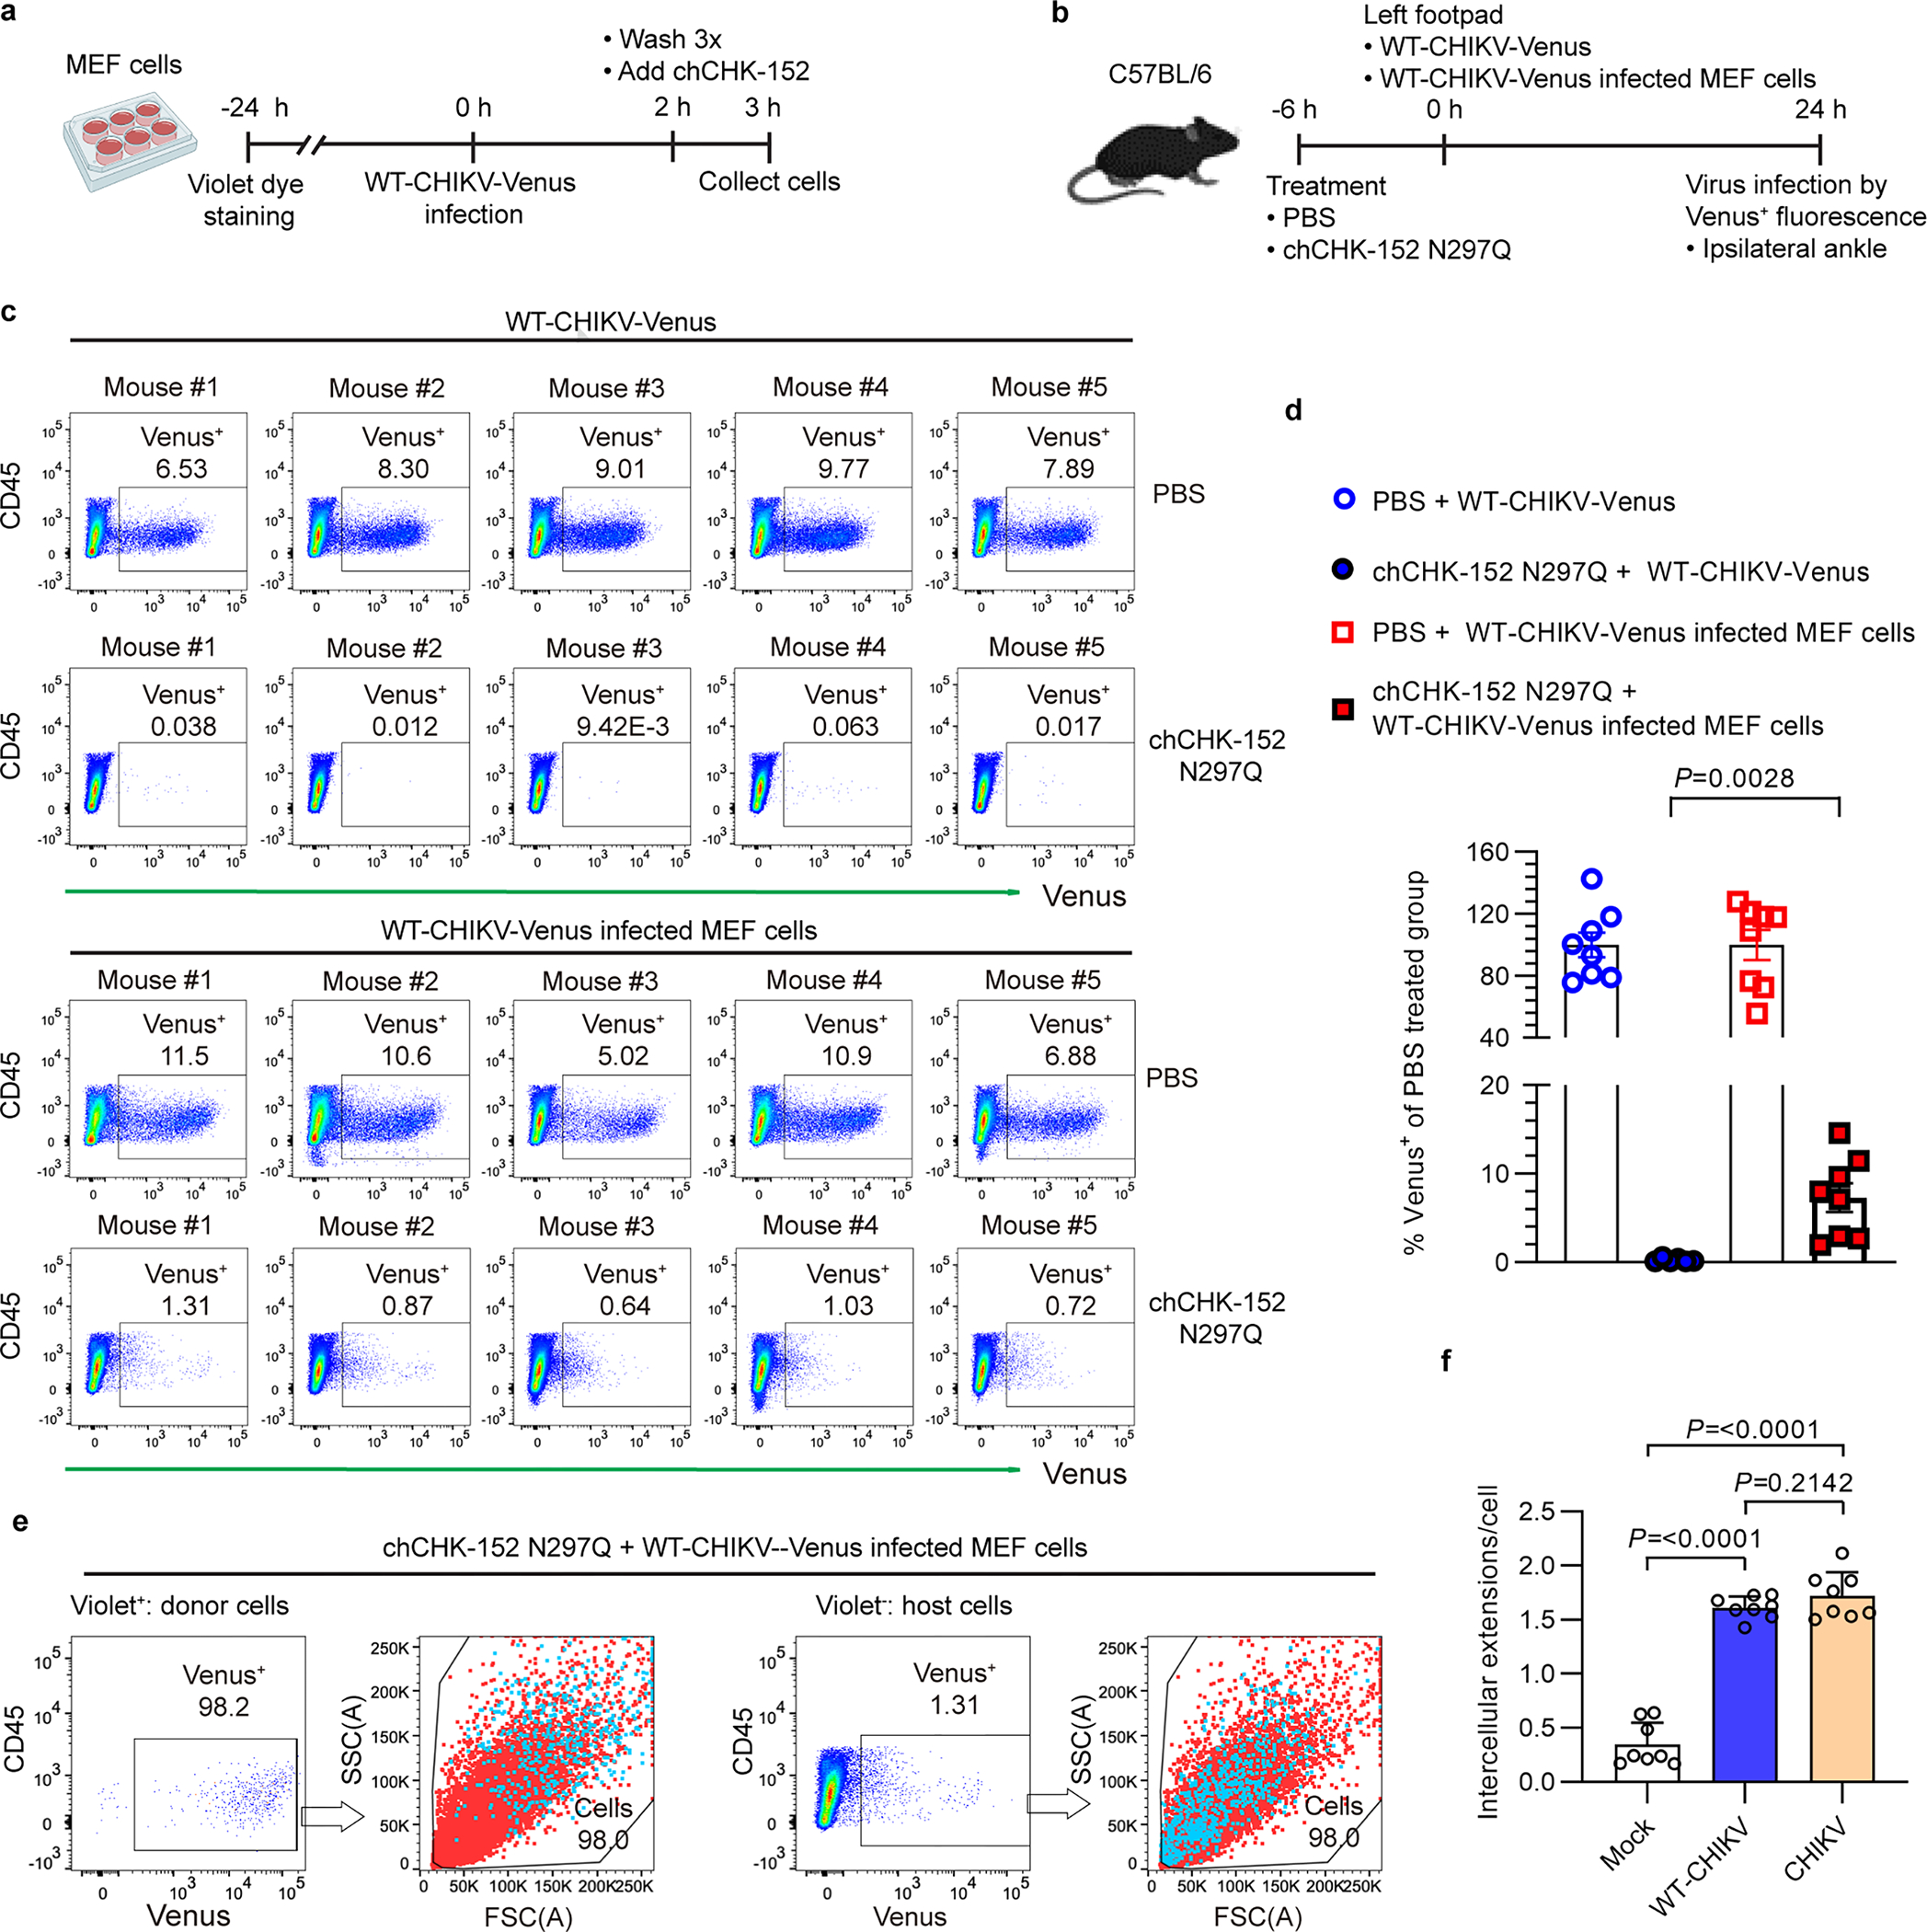
Chikungunya virus (CHIKV) has recently emerged to cause millions of human infections worldwide. Infection can induce the formation of long intercellular extensions that project from infected cells and form stable non-continuous membrane bridges with neighbouring cells. The mechanistic role of these intercellular extensions in CHIKV infection was unclear. Here we developed a co-culture system and flow cytometry methods to quantitatively evaluate transmission of CHIKV from infected to uninfected cells in the presence of neutralizing antibody. Endocytosis and endosomal acidification were critical for virus cell-to-cell transmission, while the CHIKV receptor MXRA8 was not. By using distinct antibodies to block formation of extensions and by evaluation of transmission in HeLa cells that did not form extensions, we showed that intercellular extensions mediate CHIKV cell-to-cell transmission. In vivo, pre-treatment of mice with a neutralizing antibody blocked infection by direct virus inoculation, while adoptive transfer of infected cells produced antibody-resistant host infection. Together our data suggest a model in which the contact sites of intercellular extensions on target cells shield CHIKV from neutralizing antibodies and promote efficient intercellular virus transmission both in vitro and in vivo.


Conflict of interest statement

Competing interests: P.Y., B.J.D., J.J.W., A.S.K., B.W., K.T., T. C., M. L., T.E.M. and M.K. report no competing interests. J.R.L is a paid consultant for Celdara Medical, LLC. M.S.D. is a consultant for Inbios, Vir Biotechnology, Senda Biosciences, Ocugen, Moderna, and Immunome. The Diamond laboratory has received unrelated funding support in sponsored research agreements from Vir Biotechnology, Moderna, Generate Biomedicine, and Emergent BioSolutions.

Figures

Extended Data Fig. 1.
Growth properties of CHIKV and CHIKV-GFP in MEF cells.
Extended Data Fig. 2.
Infection of MEF or U-2 OS target cells in the presence of mAb DEN-4G2 or chCHK-152.
Extended Data Fig. 3.
Effect of Bafilomycin or Dyngo-4a on ILE formation.
Extended Data Fig. 4.
Characterization of inducible Rab5 U-2 OS cell lines.
Extended Data Fig. 5.
ILE formation in U-2 OS-tetherin cell lines.
Extended Data Fig. 6.
MAb E10–18 does not inhibit free virus infection of target cells.
Extended Data Fig. 7.
E1-K61T-G64S escapes chCHK-166 inhibition of ILE formation.
Extended Data Fig. 8.
CHK-152 N297Q pre-treatment can block CHIKV infection in ipsilateral ankle.
Extended Data Fig. 9.
FACS gating strategies for Fig. 6.
Extended Data Fig. 10.
ILE formation in primary joint cells infected with CHIKV ex vivo.
Fig. 1.
Fig. 1.. Cell-to-cell transmission promotes CHIKV infection in cell culture.
a, mAb chCHK-152 neutralizes CHIKV and CHIKV-GFP. Viruses were incubated with the indicated concentrations of mAb chCHK-152 or the negative control mAb DEN-4G2 for 1 h at 37°C. Neutralization was determined by FFA on MEF cells. Data shown represent the mean ± S.D. of 3 independent experiments. b, Visualization of ILE in the presence of mAb chCHK-152. MEF cells were infected with CHIKV-GFP (MOI=0.5) for 2 h or mock-infected, then cultured in complete medium +/− 20 μg/mL of chCHK-152 for 9 h. Cells were permeabilized and immunostained to detect E2/E1 proteins (red, pseudo color) and tubulin (green, pseudo color). The GFP reporter channel is not shown. White arrowheads indicate ILE. Bar = 20 μm. c, ILE formation is not affected by chCHK-152. MEF cells were infected and treated as in panel 1b, and ILE in infected cells were quantitated based on positive staining for E2/E1 and tubulin, contact with a neighboring cell, and length ≥10 μm. Mean ± S.D. of 3 independent experiments (shown as points), each with n > 130 infected cells. d, Antibody-resistant cell-to-cell transmission. “Producer” MEF cells were infected with CHIKV-GFP at MOI=10, incubated at 37°C for 2 h, and washed to remove extracellular virus. “Target” MEF cells were prestained with CMRA dye, plated onto producer cells in the presence of chCHK-152 as indicated, and co-cultured for 12 h. The co-culture media were collected and the cells were fixed and analyzed by flow cytometry. A representative example of 3 independent experiments is shown. e, Quantitation of target cell infection. The fraction of target cells infected (Q2/(Q1+Q2)) was quantitated in samples prepared as in panel 1d. Mean ± S.D of 3 independent experiments (shown as points). f, Infectious virus in the co-culture media was quantitated by infectious center assay (ICA). Mean ± S.D. of 3 independent experiments (shown as points). Statistical significance in panels c, e, and f was calculated by unpaired two-tailed t-tests.
Fig. 2.
Fig. 2.. Role of MXRA8 and the endocytic pathway in cell-to-cell transmission.
a, Cell surface expression of MXRA8 in MEF or MEF-MXRA8-KO cells measured by flow cytometry. Representative example of 3 independent experiments. b, Infectivity of CHIKV-GFP, CHIKV or SINV in MEF or MEF-MXRA8-KO cells by ICA, normalized to 108 IC/mL on MEF cells. Mean ± S.D of 3 independent experiments (shown as points). c, Visualization of ILE in MEF and MEF-MXRA8-KO cells. Cells were infected with CHIKV-GFP (MOI=0.5, based on Fig. 2b) for 11 h and ILE visualized as in Fig. 1b. White arrowheads indicate ILE. Bar = 20 μm. d, ILE are independent of MXRA8. Cells were infected as in panel 2c and ILE in infected cells quantitated as in Fig. 1c. Data shown represent the mean ± S.D. of 3 independent experiments (shown as points), each with n > 130 infected cells. e, Cell-to-cell transmission is independent of MXRA8. MEF producer cells were infected as in Fig. 1d, and MEF or MEF-MXRA8-KO cells were used as target cells. After co-culture for 12 h in the presence of 5 μg/ml chCHK-152 or a control mAb DEN-4G2, the cells were analyzed by flow cytometry. Mean ± S.D. of 3 independent experiments (shown as points). f, Dyngo-4a inhibits CHIKV infection. U-2 OS cells were pretreated with Dyngo-4a or DMSO vehicle for 1 h, infected with CHIKV-GFP (MOI=0.5), cultured for 12 h in the presence (12h) or absence of inhibitor (pretreat), and analyzed by flow cytometry. Mean ± S.D of 3 independent experiments (shown as points). g, Dyngo-4a inhibits CHIKV cell-to-cell transmission. Target U-2 OS cells were pretreated with Dyngo-4a or DMSO for 1 h, then co-cultured for 12h with CHIKV-GFP-infected producer cells and analyzed, as in 2e. Mean ± S.D of 3 independent experiments (shown as points). h, Dominant-negative Rab5 inhibits CHIKV infection. U-2 OS cell lines inducibly-expressing Rab5-WT or Rab5-DN were incubated +/− doxycycline (dox) for 16 h, infected with CHIKV (MOI=1) for 1 h, cultured in media containing 20 mM NH4Cl for 12 h, and primary infection quantitated by flow cytometry. Mean ± S.D of 3 independent experiments (shown as points). i, Dominant-negative Rab5 inhibits CHIKV cell-to-cell transmission. Target U-2 OS cell lines inducibly-expressing Rab5-WT or Rab5-DN were incubated +/− doxycycline for 16 h, then co-cultured with CHIKV-infected producer cells for 12 h and analyzed, as in 2e. Mean ± S.D of 4 independent experiments (shown as points). j, Bafilomycin A1 inhibits CHIKV infection. U-2 OS cells were pretreated with Bafilomycin A1 for 1 h, infected with CHIKV-GFP (MOI=1), cultured for 12 h in the presence (12h) or absence (pretreat) of inhibitor, and analyzed by flow cytometry. Mean ± S.D of 3 independent experiments (shown as points). k, Bafilomycin A1 inhibits CHIKV cell-to-cell transmission. Target U-2 OS cells were pretreated with Bafilomycin A1 or DMSO for 1 h, then co-cultured with CHIKV-GFP-infected producer cells for 12 h and analyzed, as in 2e. Mean ± S.D of 3 independent experiments (shown as points). Statistical significance in panels b and d-k was determined using unpaired two-tailed multiple t-tests.
Fig. 3.
Fig. 3.. Tetherin expression inhibits CHIKV cell-to-cell transmission.
a, Parental U-2 OS or U-2 OS cells inducibly-expressing WT- or L-tetherin were incubated with doxycycline (dox) for 16 h, surface-stained with anti-tetherin mAb, and analyzed by flow cytometry. Representative example of 3 independent experiments. b, The indicated U-2 OS cells were incubated with or without doxycycline for 16 h and infected with CHIKV-GFP (MOI=10) for 10 h. Infectious virus release was measured by ICA. Mean ± S.D. of 3 independent experiments (shown as points). c, ILE are independent of tetherin. The indicated U-2 OS cells were incubated with or without doxycycline for 16 h, infected with CHIKV-GFP (MOI=0.5) for 11 h, and ILE in infected cells quantitated as in Fig. 1c. Data shown represent the mean ± S.D. of 3 independent experiments (shown as points), each with n > 130 infected cells. d, Tetherin inhibits CHIKV cell-to-cell transmission. The indicated U-2 OS producer cells were incubated with or without doxycycline for 16 h, infected with CHIKV-GFP (MOI=10), and co-cultured with U-2 OS cells (target cells) for 12 h in the presence of 5 μg/mL DEN-4G2 or chCHK-152 mAb. The fraction of target cells infected was determined by flow cytometry. Mean ± S.D of 3 independent experiments (shown as points). Statistical significance of panels b-d was calculated using unpaired two-tailed multiple t-tests.
Fig. 4.
Fig. 4.. Properties of CHIKV infection in HeLa cells.
a, Infectivity of CHIKV-GFP and CHIKV on U-2 OS, HeLa-MXRA8 or HeLa cells was determined by ICA. Data were normalized to 108 IC/mL on U-2 OS cells. Mean ± S.D. of 3 independent experiments (shown as points). b, Growth of CHIKV in U-2 OS or HeLa-MXRA8 cells. U-2 OS or HeLa-MXRA8 cells were infected with CHIKV (MOI=10) for 2 h, washed to remove virus, and virus production at the indicated times quantitated by ICA. The graphs represent the means and range of 2 independent experiments. c, Lack of ILE in HeLa-MXRA8 cells. U-2 OS and HeLa-MXRA8 cells were infected with CHIKV for 11 h, and ILE visualized as in Fig. 1b. White arrowheads indicate ILE. Bar = 20 μm. d, Quantitation of ILE in HeLa-MXRA8 cells. Samples infected as in panel 4c were quantitated as described in Fig. 1c. Data shown represent the mean ± S.D. of 3 independent experiments (shown as points), each with n > 130 infected cells. e, Lack of CHIKV cell-to-cell transmission in HeLa-MXRA8 cells. U-2 OS or HeLa-MXRA8 producer cells were infected with CHIKV (MOI=10) for 2 h, then co-cultured with their respective target U-2 OS or HeLa-MXRA8 cells, for 12 or 16 h in the presence of 5 μg/mL DEN-4G2 control or chCHK-152 mAb. Infection of target cells was determined by flow cytometry. Mean ± S.D of 3 independent experiments (shown as points). Statistical significance of panels a, d, e was calculated using unpaired two-tailed multiple t-tests.
Fig. 5.
Fig. 5.. Inhibition of ILE blocks cell-to-cell transmission.
a, Treatment with mAb chCHK-166 or E10–18 inhibits ILE. MEF cells were infected with CHIKV-GFP for 2 h, then cultured for 9 h in the presence of mAbs as indicated. ILE visualized as in Fig. 1b. White arrowheads indicate ILE. Bar = 20 μm. b, Dose dependence of ILE inhibition by mAb chCHK-166 or E10–18. Samples infected as in 5a were quantitated as in Fig. 1c. Mean ± S.D. of 3 independent experiments (shown as points), each with n > 130 infected cells. Statistical significance was calculated by unpaired two-tailed multiple t-tests. c, Binding of CHIKV mAbs to CHIKV-infected cells. MEF cells were infected with CHIKV-GFP (MOI=5) for 11 h, fixed, incubated with serial dilutions of mAbs, followed by ELISA. Mean of 3 independent experiments. d, Neutralization of CHIKV-GFP by the indicated mAbs (as in Fig. 1a). Mean ± S.D. of 3 independent experiments. e, chCHK-166 or mAb E10–18 inhibits cell-to-cell transmission. MEF producer cells were infected with CHIKV-GFP (MOI=10) for 2 h, washed, and co-cultured for 12 h with MEF target cells in the presence of 5 μg/mL chCHK-152 to inhibit free virus infection, plus additional mAbs as indicated. Infection of target cells was quantitated by flow cytometry. Mean ± S.D. of 3 independent experiments (shown as points). Statistical significance was calculated by unpaired two-tailed t-tests. f, Neutralization of CHIKV-GFP or CHIKV-GFP E1-K61T-G64S by the indicated mAbs was determined as in Fig. 1a. Mean ± S.D. of 3 independent experiments. g, mAb chCHK-166 does not bind to CHIKV E1-K61T-G64S-infected cells. MEF cells were infected with CHIKV-GFP E1-K61T-G64S (MOI=5) for 11 h, followed by ELISA as in Fig. 5c. Mean ± S.D. of 3 independent experiments. h, CHIKV E1-K61T-G64S escapes chCHK-166 inhibition of ILE formation. MEF cells were infected for 2 h then cultured in the presence of 20 ug/ml mAb chCHK-166 for 9 h. ILE were quantitated as in Fig. 1c. Mean ± S.D. of 3 independent experiments (shown as points), each with n > 130 infected cells. Statistical significance was calculated by unpaired two-tailed t-tests. i, CHIKV E1-K61T-G64S escapes chCHK-166 inhibition of cell-to-cell transmission. MEF producer cells were infected (MOI=10) for 2 h, washed, and co-cultured for 12 h with MEF target cells in the presence of 5 μg/mL chCHK-152 plus additional mAbs as indicated. Infection of target cells was quantitated by flow cytometry. Mean of 2 independent experiments (shown as points).
Fig. 6.
Fig. 6.. CHIKV cell-to-cell transmission in mice.
a, Experimental flow diagram of MEF infection. MEF cells were loaded with CellTrace-Violet (Violet), cultured 24 h, and inoculated with WT CHIKV-Venus. Cells were then washed, incubated for 1 hour with chCHK-152 at 5 μg/mL, and prepped for adoptive transfer. b, Experimental flow diagram of in vivo infection experiments. WT C57BL/6 mice were pretreated by i.p. injection with 100 μg of chCHK-152 N297Q or PBS. At 6 h post-treatment, previously infected MEF cells (see panel a) were adoptively transferred by s.c. injection of 106 cells per mouse into the left footpad. As a control group, mice were directly inoculated with 103 PFU WT CHIKV-Venus by s.c. injection into the left footpad. At 24 h post-cell transfer or inoculation, ipsilateral ankle tissues were harvested, single cell suspensions generated and stained for viability and CD45. Panels a, b created with BioRender.com. c, Representative flow plots showing host cell infection in mice that were pretreated with either PBS or chCHK-152 N297Q and then received 103 PFU of WT CHIKV-Venus (top two rows) or 106 WT CHIKV-Venus-infected MEF cells (lower two rows). All plots were gated on viable singlet CD45 cells. d, Frequency of Venus+ cells within the host CD45 Violet cell population. The PBS-treated controls from each group of mice were averaged and set to 100% (maximum Venus signal). The chCHK-152 N297Q-treated samples were averaged and graphed as %Venus+ as compared to the PBS Venus+ signal. Mean ± S.D. of two independent experiments (n = 6 for CHK-152 N297Q +103 PFU CHIKV-Venus group, n=8 for other 3 groups), with points showing the results from each mouse. e, Flow analysis of the Venus+ MEF vs. Venus+ host cells. Venus+ donor MEF cells (CD45Violet+) or Venus+ host cells (CD45Violet) were back-gated onto the FSC/SSC plot to compare size and internal complexity. f, ILE formation in primary joint cells. Single cells from ankle tissue of C57BL/6 mice were infected with CHIKV strain 181/25 or WT CHIKV strain AF15561 for 16 h. ILE were quantitated as described in Fig. 1c. Data shown represent the mean ± S.D. of 2 independent experiments, each with 4 mice, with points showing the results from each mouse. Total infected cells evaluated per condition > 130. Statistical significance of panels d and f was calculated by unpaired two-tailed t-test.

References

    1. Kuhn RJ in Fields Virology: Emerging Viruses-Volume 1 Vol. 1 (eds Howley PM & Knipe DM) Ch. 5, 170–193 (Lippincott Williams & Wilkins, 2021).
    1. Weaver SC, Winegar R, Manger ID & Forrester NL Alphaviruses: population genetics and determinants of emergence. Antiviral Res 94, 242–257 (2012). - PMC - PubMed
    1. Silva LA & Dermody TS Chikungunya virus: epidemiology, replication, disease mechanisms, and prospective intervention strategies. J Clin Invest 127, 737–749 (2017). - PMC - PubMed
    1. Baxter VK & Heise MT Immunopathogenesis of alphaviruses. Adv Virus Res 107, 315–382 (2020). - PMC - PubMed
    1. McCarthy MK, Davenport BJJ & Morrison TE Chronic Chikungunya Virus Disease. Curr Top Microbiol Immunol 435, 55–80 (2022). - PubMed

Publication types

Substances