

The identification of genes associated T-cell exhaustion and construction of prognostic signature to predict immunotherapy response in lung adenocarcinoma
- PMID: 37592010
- PMCID: PMC10435542
- DOI: 10.1038/s41598-023-40662-z
The identification of genes associated T-cell exhaustion and construction of prognostic signature to predict immunotherapy response in lung adenocarcinoma
Abstract
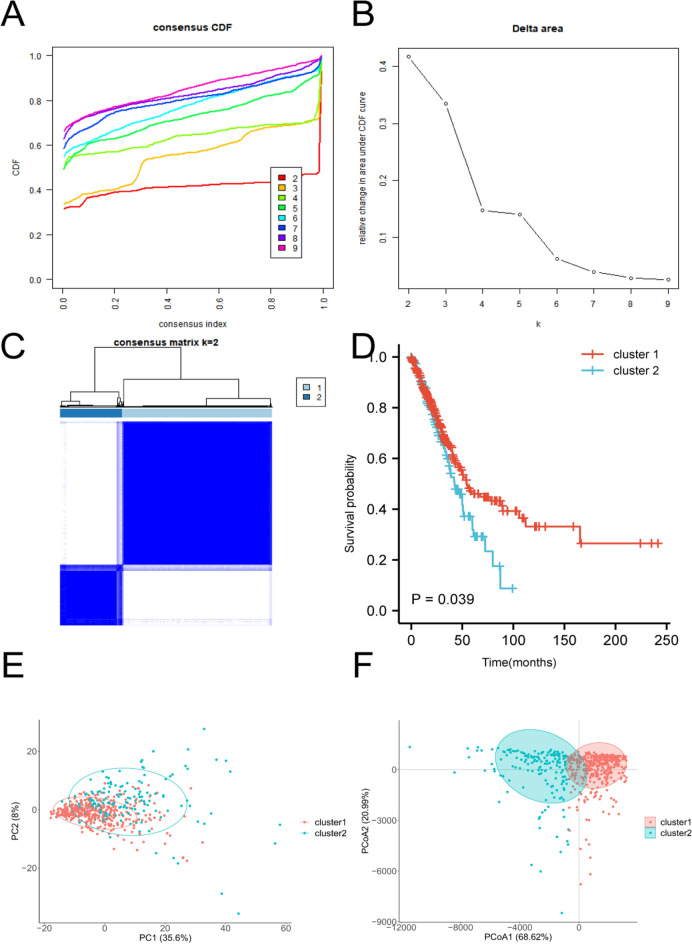
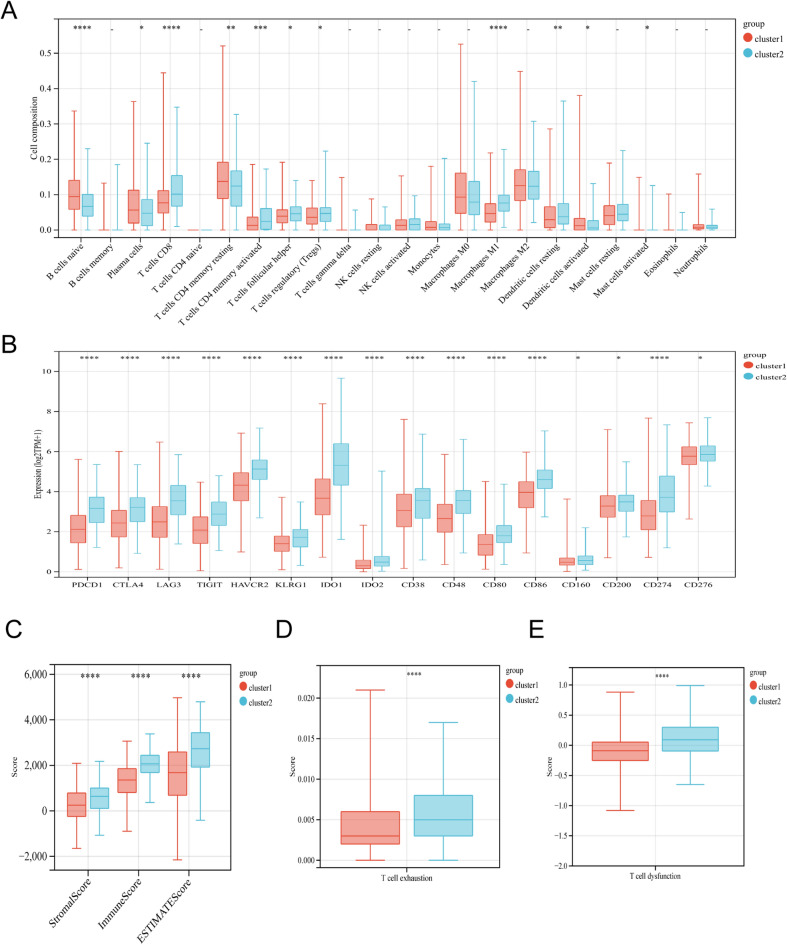
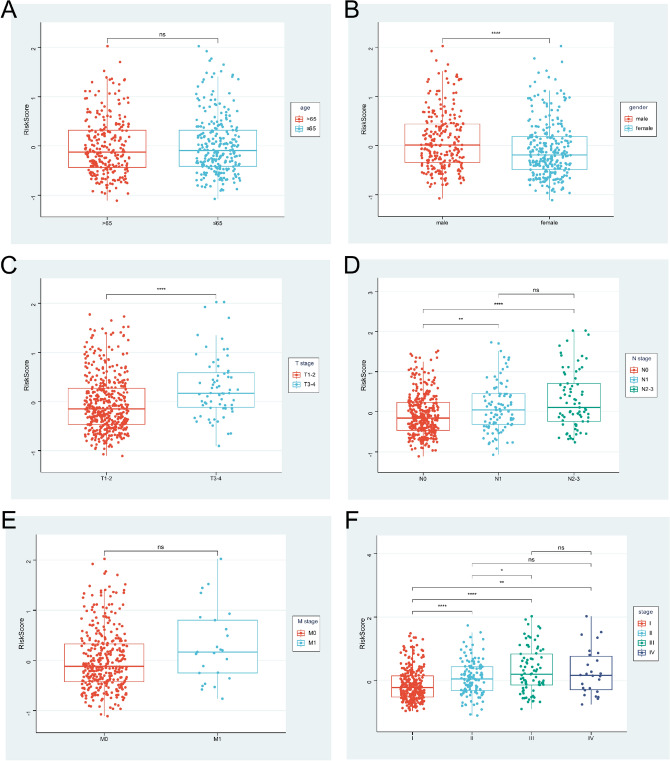
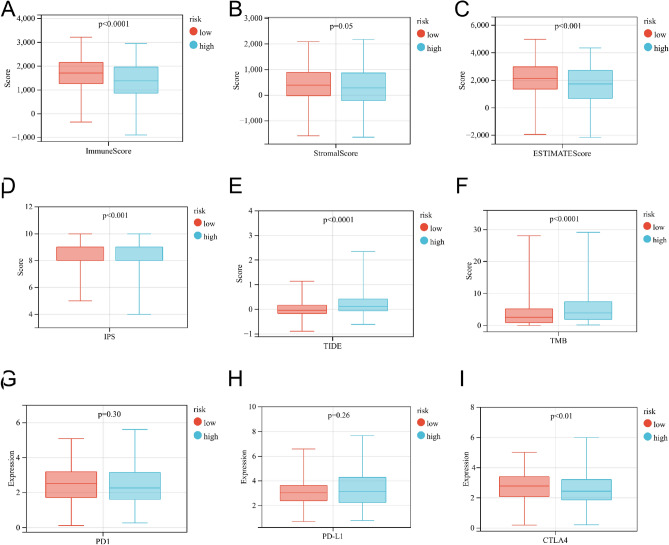
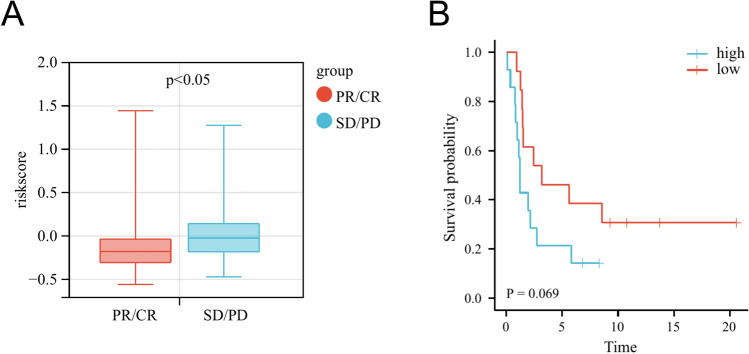
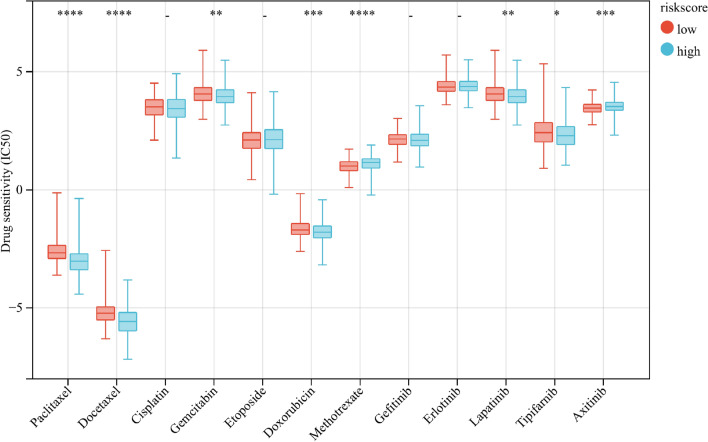
T-cell exhaustion (Tex) is considered to be a reason for immunotherapy resistance and poor prognosis in lung adenocarcinoma. Therefore, we used weighted correlation network analysis to identify Tex-related genes in the cancer genome atlas (TCGA). Unsupervised clustering approach based on Tex-related genes divided patients into cluster 1 and cluster 2. Then, we utilized random forest and the least absolute shrinkage and selection operator to identify nine key genes to construct a riskscore. Patients were classified as low or high-risk groups. The multivariate cox analysis showed the riskscore was an independent prognostic factor in TCGA and GSE72094 cohorts. Moreover, patients in cluster 2 with high riskscore had the worst prognosis. The immune response prediction analysis showed the low-risk group had higher immune, stromal, estimate scores, higher immunophenscore (IPS), and lower tumor immune dysfunction and exclusion score which suggested a better response to immune checkpoint inhibitors (ICIs) therapy in the low-risk group. In the meantime, we included two independent immunotherapy cohorts that also confirmed a better response to ICIs treatment in the low-risk group. Besides, we discovered differences in chemotherapy and targeted drug sensitivity between two groups. Finally, a nomogram was built to facilitate clinical decision making.
© 2023. Springer Nature Limited.
Conflict of interest statement
The authors declare no competing interests.
Figures


Similar articles
-
Combination of tumor mutation burden and immune infiltrates for the prognosis of lung adenocarcinoma.Int Immunopharmacol. 2021 Sep;98:107807. doi: 10.1016/j.intimp.2021.107807. Epub 2021 Jun 25. Int Immunopharmacol. 2021. PMID: 34175739
-
Identification of immune activation-related gene signature for predicting prognosis and immunotherapy efficacy in lung adenocarcinoma.Front Immunol. 2023 Jul 7;14:1217590. doi: 10.3389/fimmu.2023.1217590. eCollection 2023. Front Immunol. 2023. PMID: 37492563 Free PMC article.
-
Construction and validation of a prognostic model for lung adenocarcinoma based on endoplasmic reticulum stress-related genes.Sci Rep. 2022 Nov 18;12(1):19857. doi: 10.1038/s41598-022-23852-z. Sci Rep. 2022. PMID: 36400857 Free PMC article.
-
Development and validation of polyamines metabolism-associated gene signatures to predict prognosis and immunotherapy response in lung adenocarcinoma.Front Immunol. 2023 Jun 2;14:1070953. doi: 10.3389/fimmu.2023.1070953. eCollection 2023. Front Immunol. 2023. PMID: 37334367 Free PMC article.
-
Clinical Significance and Immunologic Landscape of a Five-IL(R)-Based Signature in Lung Adenocarcinoma.Front Immunol. 2021 Aug 23;12:693062. doi: 10.3389/fimmu.2021.693062. eCollection 2021. Front Immunol. 2021. PMID: 34497605 Free PMC article.
Cited by
-
AI-Driven Analysis Unveils Functional Dynamics of Müller Cells in Retinal Autoimmune Inflammation.bioRxiv [Preprint]. 2025 May 12:2025.02.28.640907. doi: 10.1101/2025.02.28.640907. bioRxiv. 2025. PMID: 40093069 Free PMC article. Preprint.
-
Translating premalignant biology to accelerate non-small-cell lung cancer interception.Nat Rev Cancer. 2025 May;25(5):379-392. doi: 10.1038/s41568-025-00791-1. Epub 2025 Feb 24. Nat Rev Cancer. 2025. PMID: 39994467 Review.
-
Alternative Strategies for Delivering Immunotherapeutics Targeting the PD-1/PD-L1 Immune Checkpoint in Cancer.Pharmaceutics. 2024 Sep 7;16(9):1181. doi: 10.3390/pharmaceutics16091181. Pharmaceutics. 2024. PMID: 39339217 Free PMC article. Review.
-
The Impact of Genetic Mutations on the Efficacy of Immunotherapies in Lung Cancer.Int J Mol Sci. 2024 Nov 7;25(22):11954. doi: 10.3390/ijms252211954. Int J Mol Sci. 2024. PMID: 39596025 Free PMC article. Review.
-
Identification of a novel ADCC-related gene signature for predicting the prognosis and therapy response in lung adenocarcinoma.Inflamm Res. 2024 May;73(5):841-866. doi: 10.1007/s00011-024-01871-y. Epub 2024 Mar 20. Inflamm Res. 2024. PMID: 38507067
References
-
- Siegel RL, Miller KD, Jemal A. Cancer statistics, 2020. CA Cancer J. Clin. 2020;70(1):7–30. - PubMed
-
- Rittmeyer A, Barlesi F, Waterkamp D, Park K, Ciardiello F, von Pawel J, Gadgeel SM, Hida T, Kowalski DM, Dols MC, et al. Atezolizumab versus docetaxel in patients with previously treated non-small-cell lung cancer (OAK): A phase 3, open-label, multicentre randomised controlled trial. Lancet. 2017;389(10066):255–265. - PMC - PubMed
-
- Gettinger SN, Horn L, Gandhi L, Spigel DR, Antonia SJ, Rizvi NA, Powderly JD, Heist RS, Carvajal RD, Jackman DM, et al. Overall survival and long-term safety of nivolumab (anti-programmed death 1 antibody, BMS-936558, ONO-4538) in patients with previously treated advanced non-small-cell lung cancer. J. Clin. Oncol. 2015;33(18):2004–2012. - PMC - PubMed
Publication types
MeSH terms
LinkOut - more resources
Full Text Sources
Medical
