. 2023 Oct;24(10):1698-1710.
doi: 10.1038/s41590-023-01599-7. Epub 2023 Aug 17.

Intrinsically disordered domain of transcription factor TCF-1 is required for T cell developmental fidelity

Affiliations

Intrinsically disordered domain of transcription factor TCF-1 is required for T cell developmental fidelity

Naomi Goldman et al. Nat Immunol. 2023 Oct.

Abstract

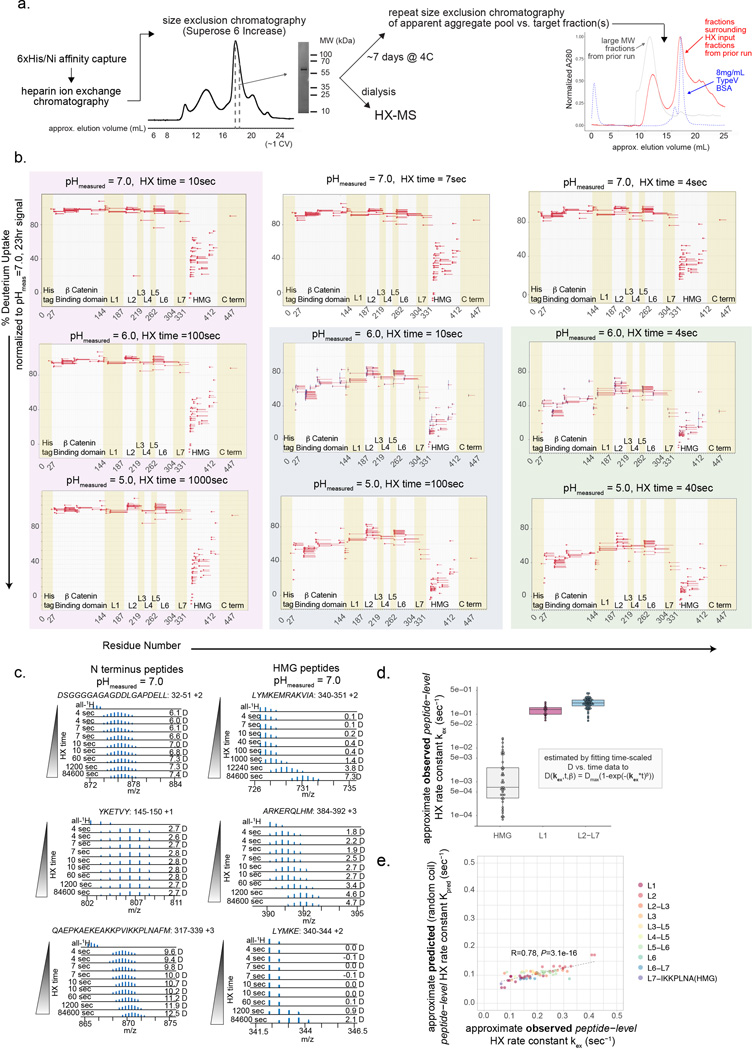
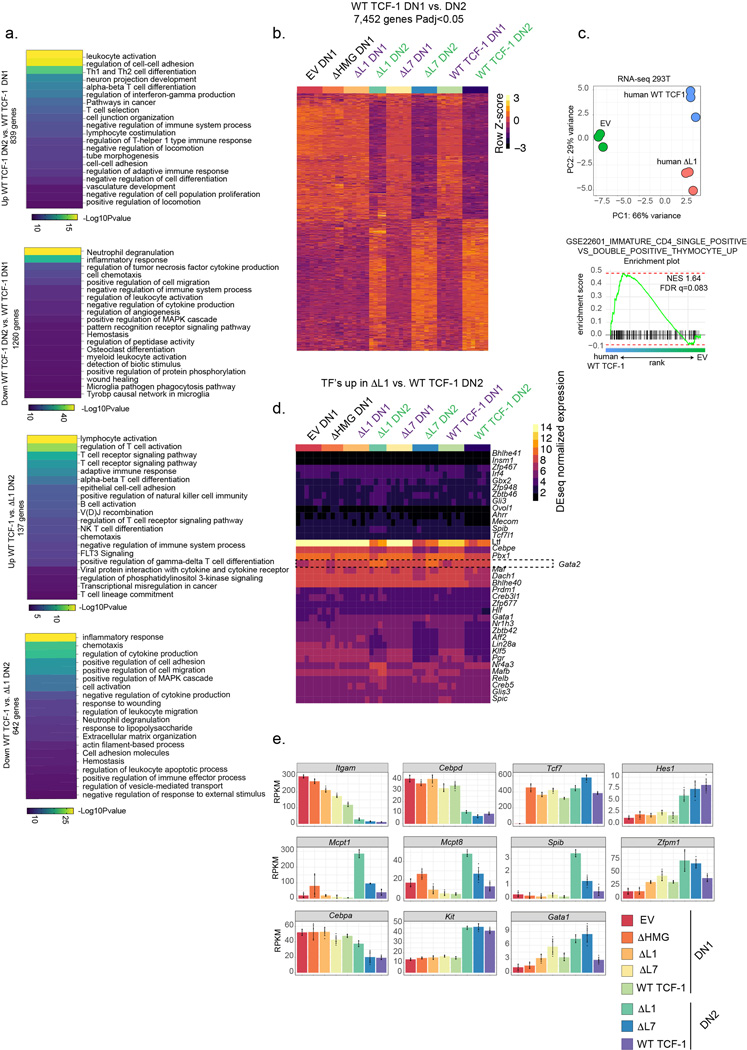
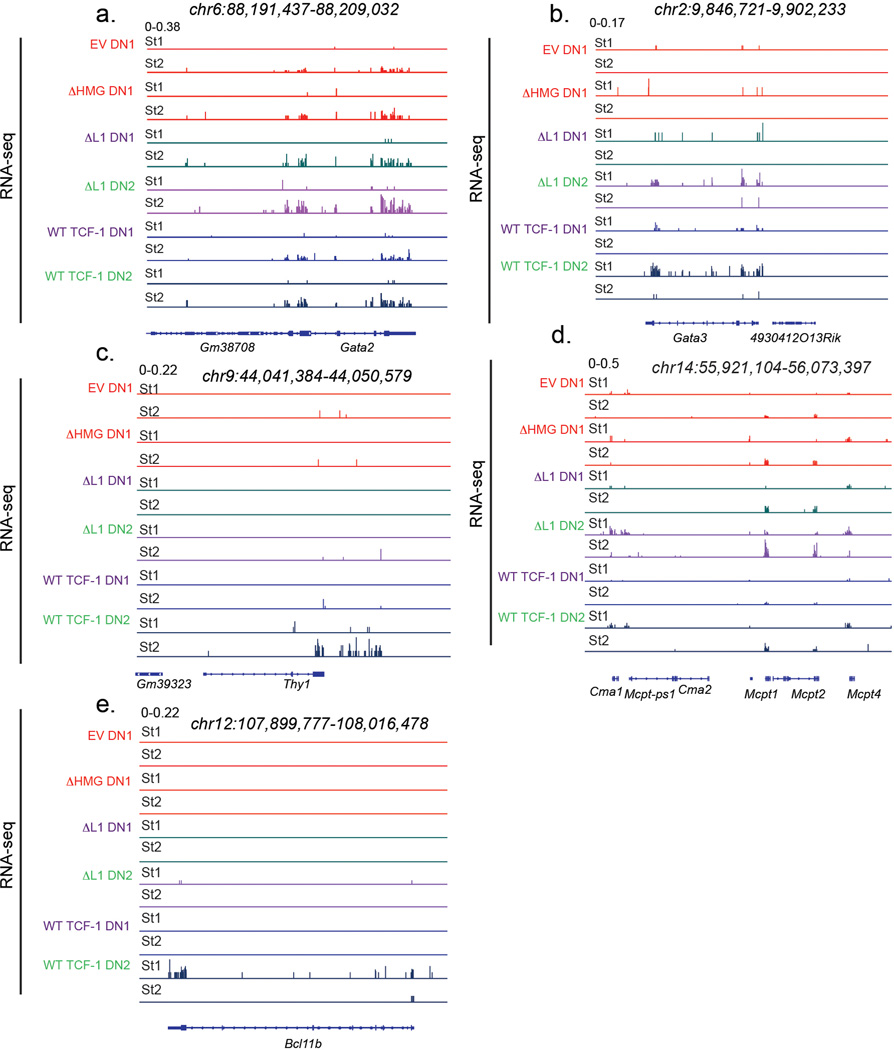
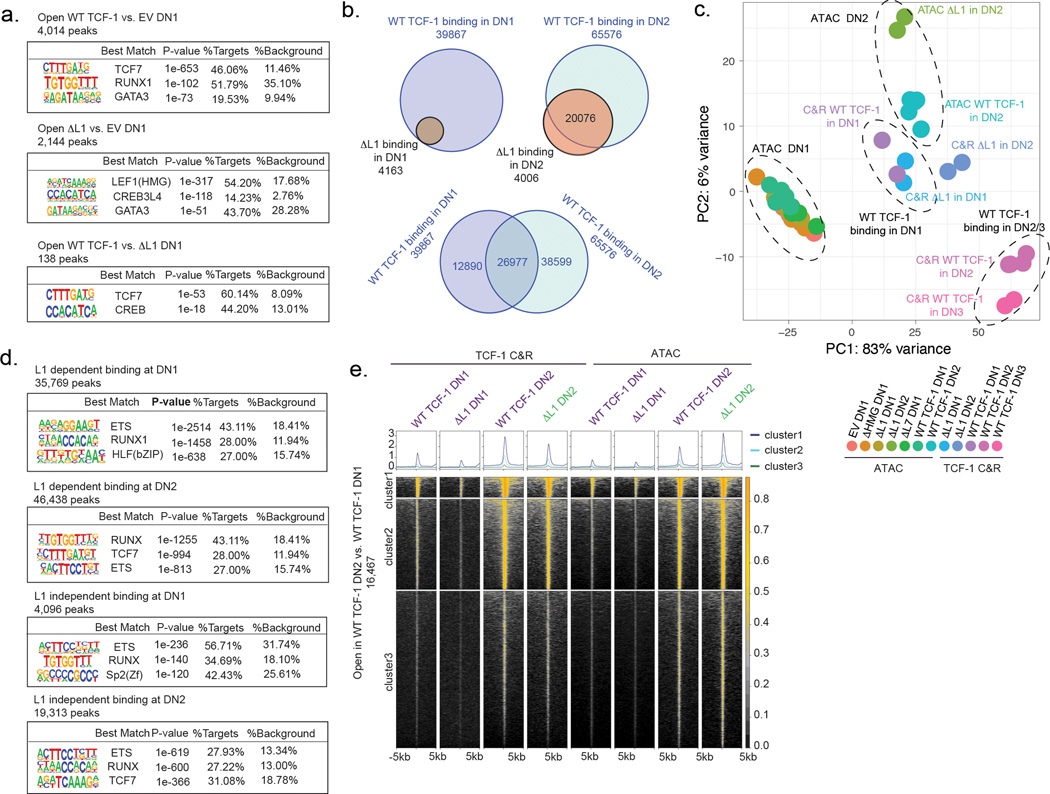
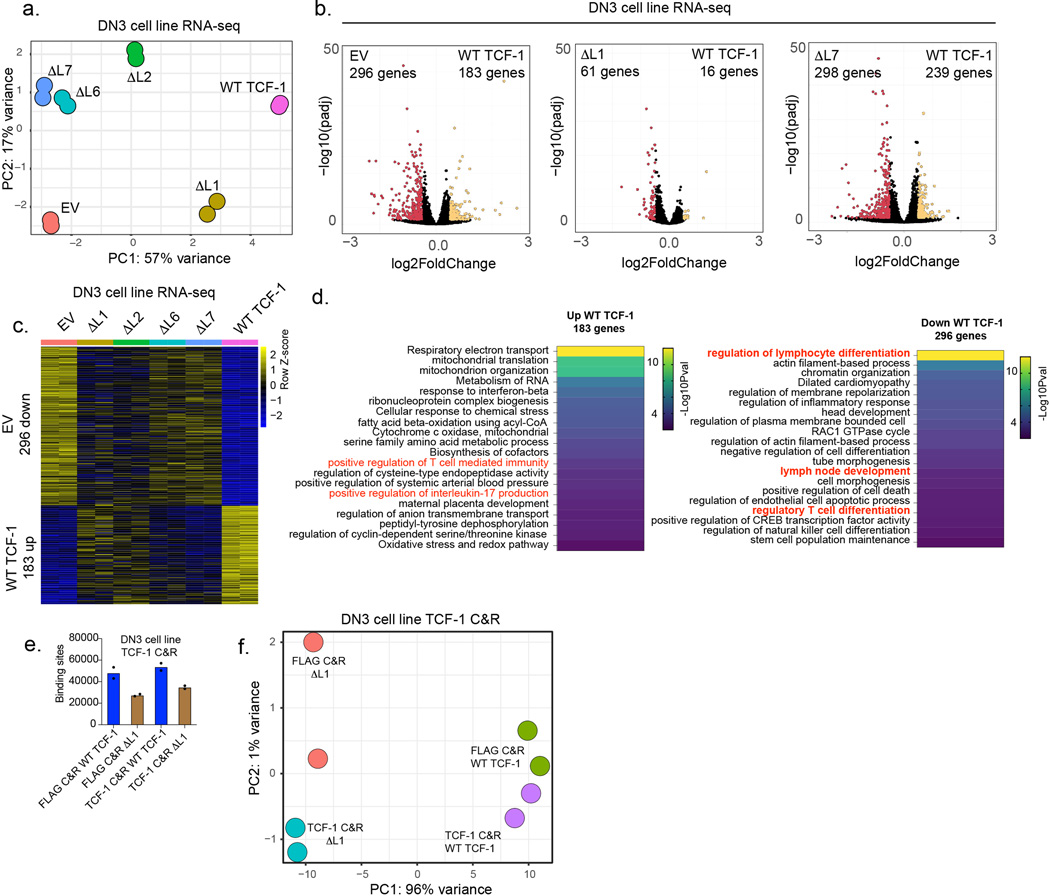
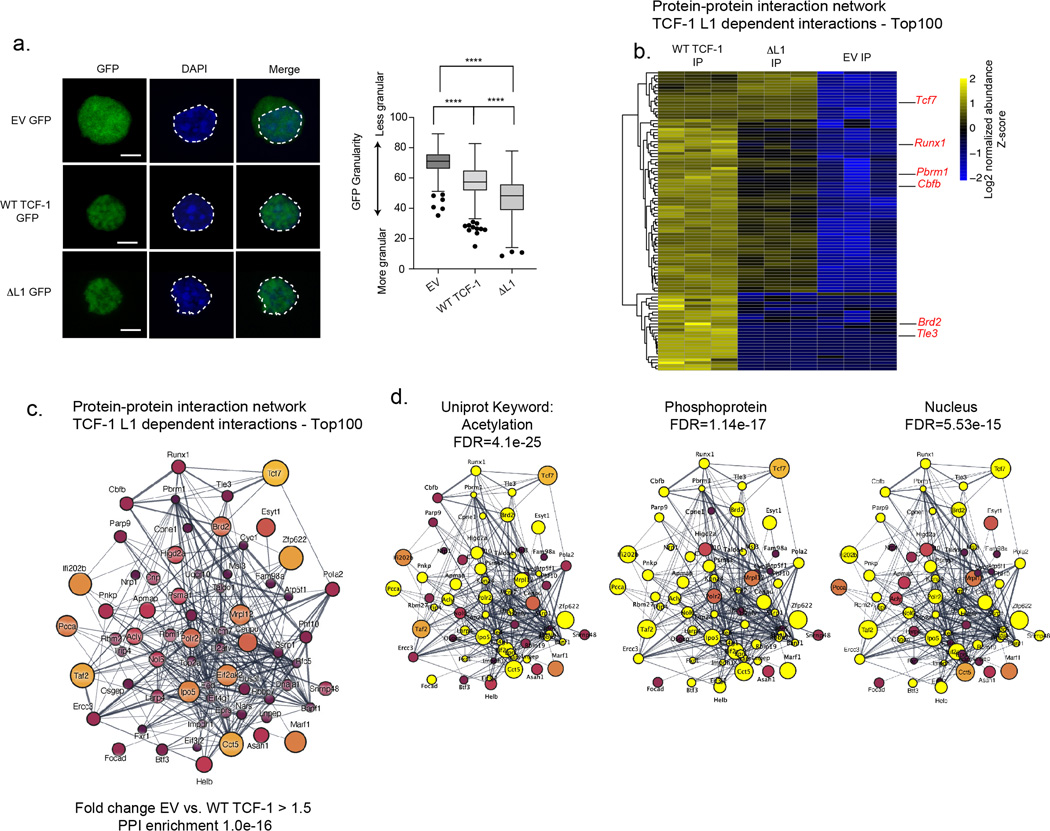
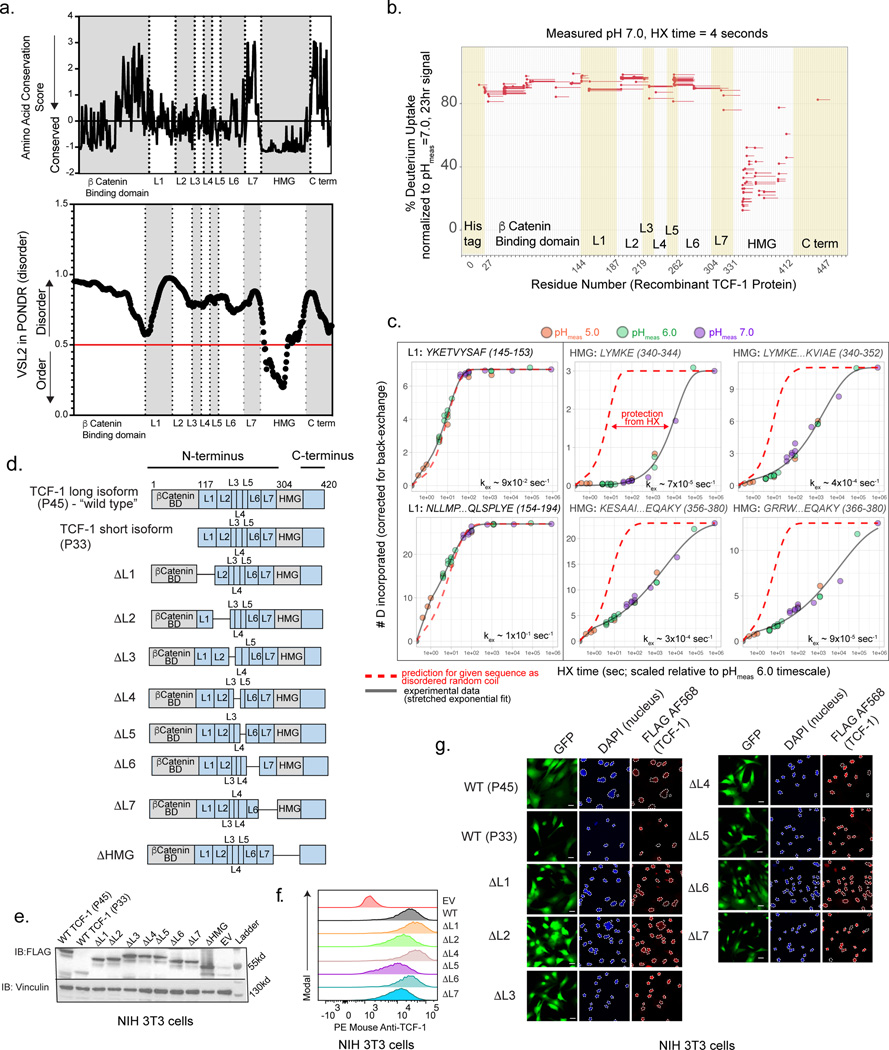
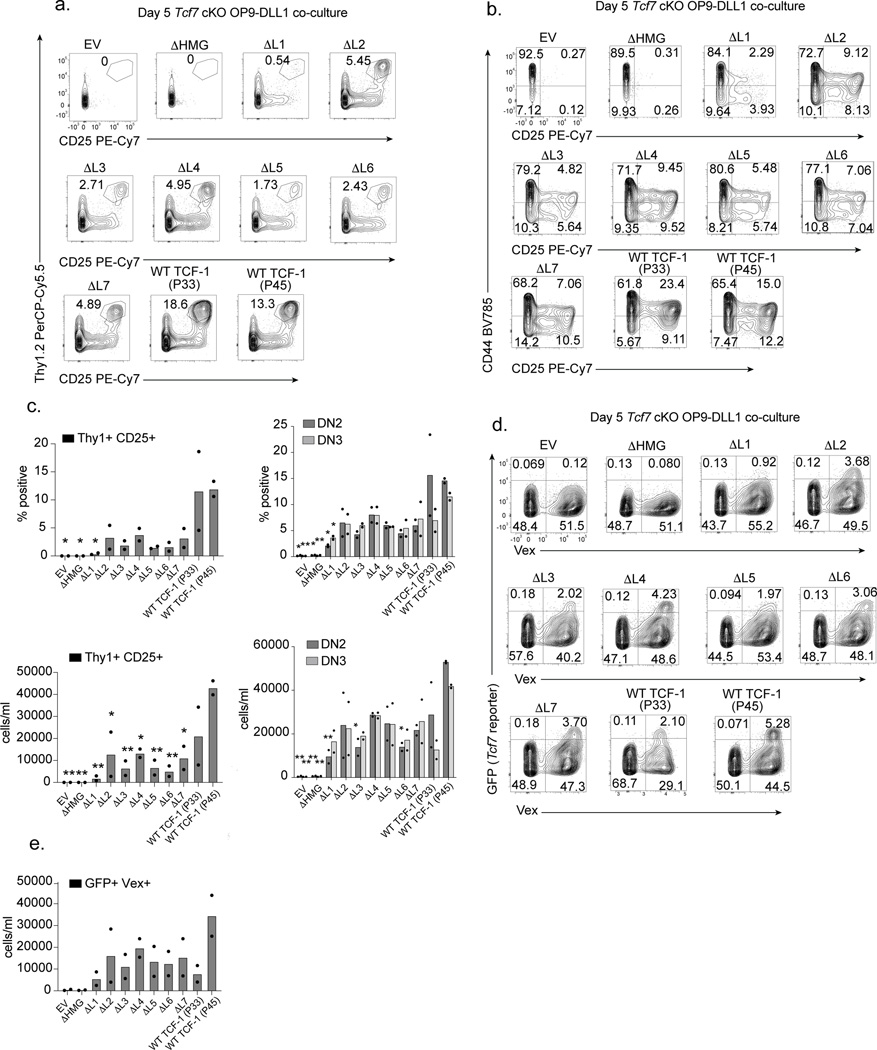
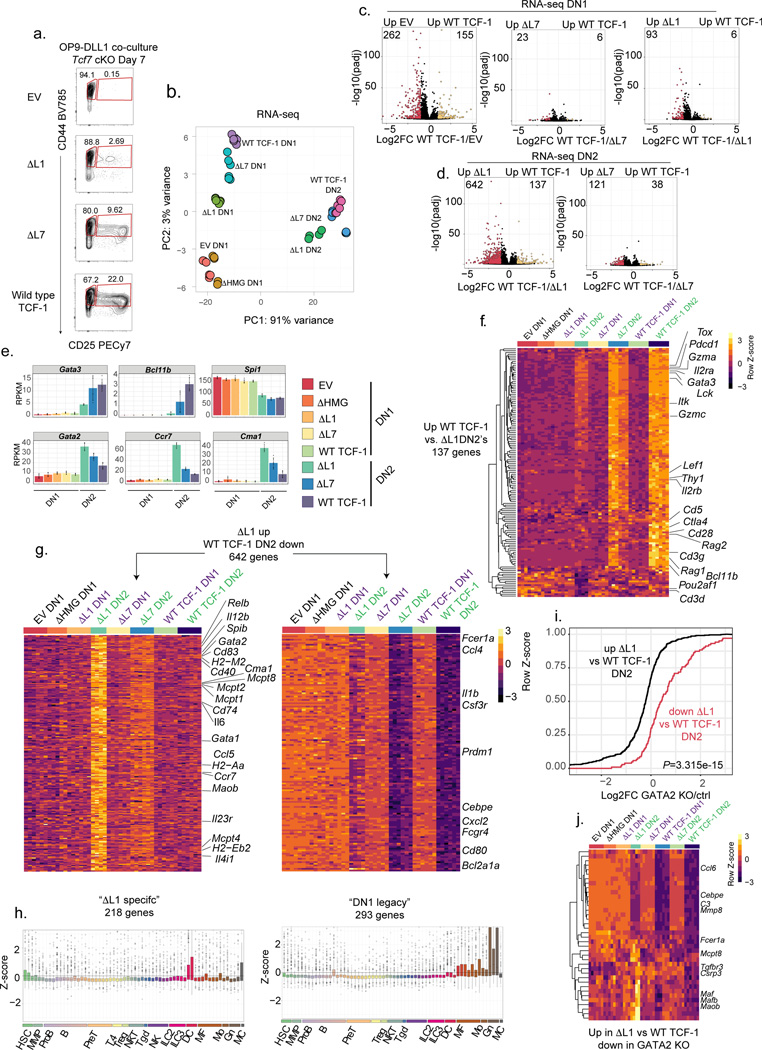
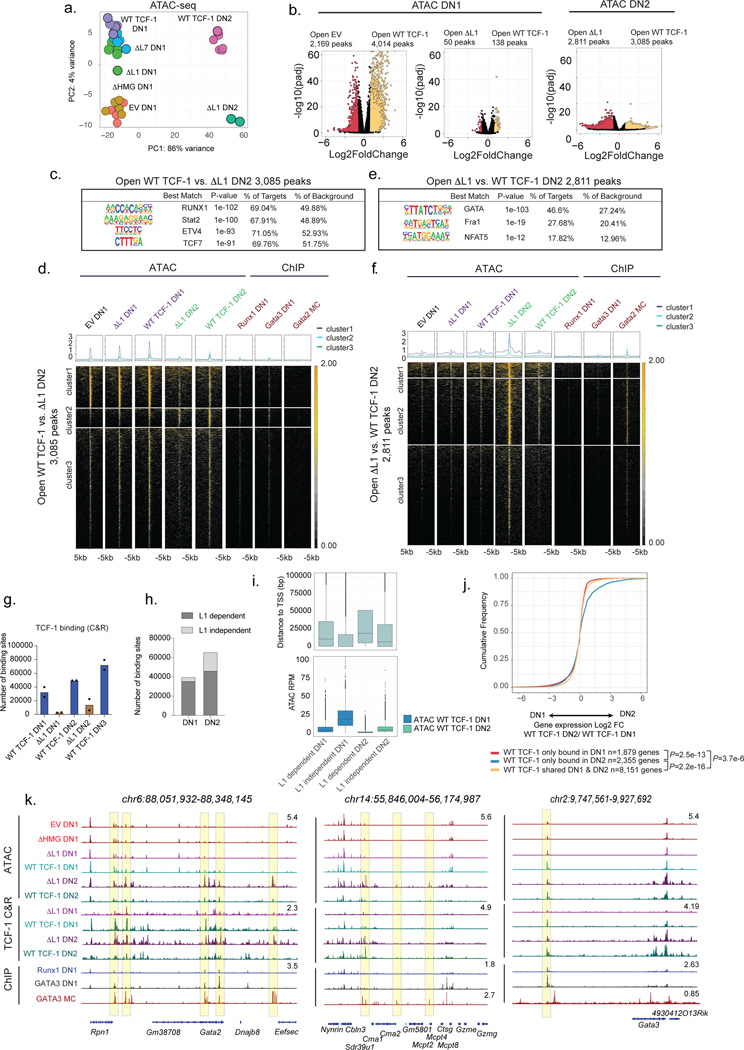
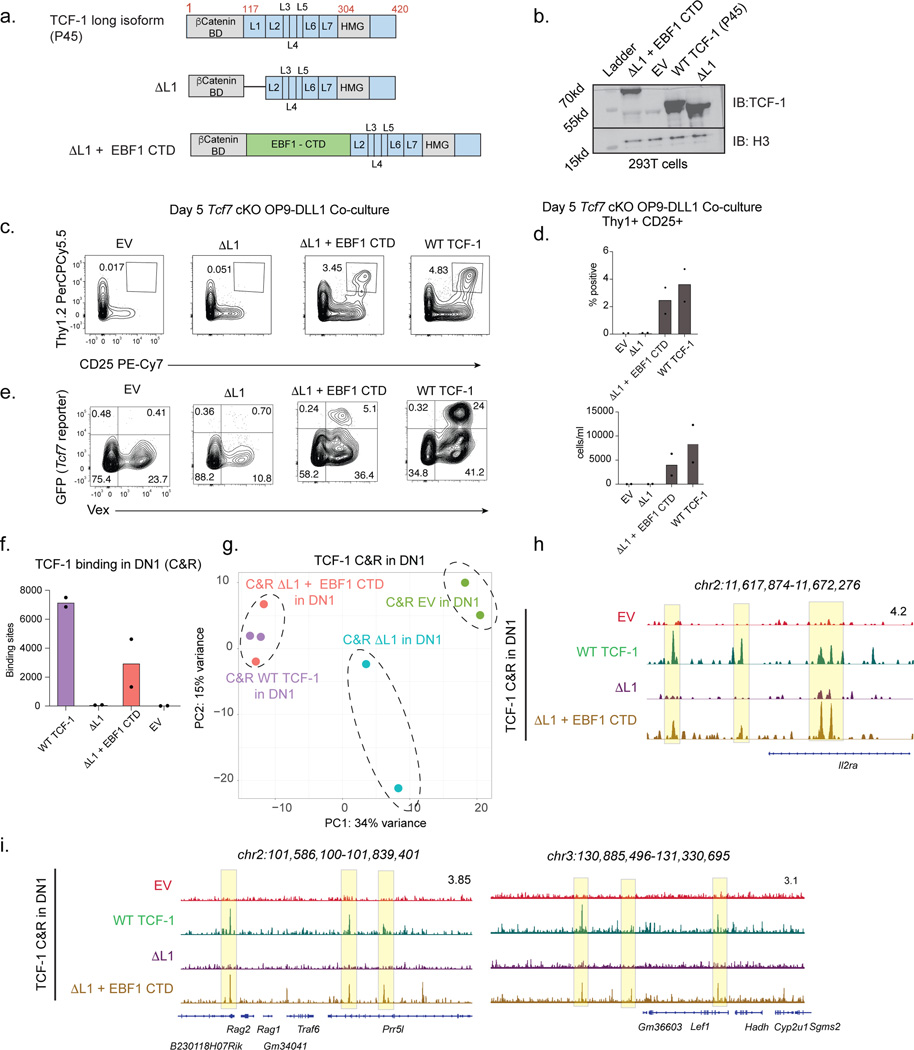
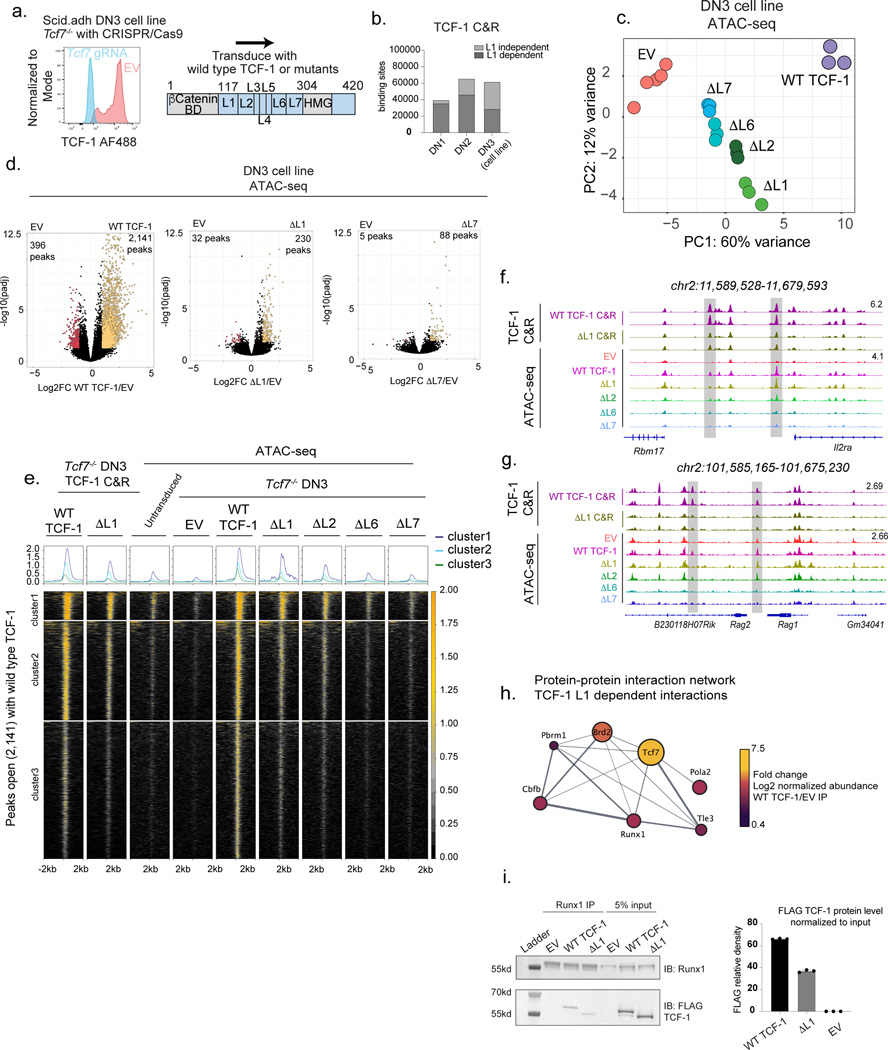
In development, pioneer transcription factors access silent chromatin to reveal lineage-specific gene programs. The structured DNA-binding domains of pioneer factors have been well characterized, but whether and how intrinsically disordered regions affect chromatin and control cell fate is unclear. Here, we report that deletion of an intrinsically disordered region of the pioneer factor TCF-1 (termed L1) leads to an early developmental block in T cells. The few T cells that develop from progenitors expressing TCF-1 lacking L1 exhibit lineage infidelity distinct from the lineage diversion of TCF-1-deficient cells. Mechanistically, L1 is required for activation of T cell genes and repression of GATA2-driven genes, normally reserved to the mast cell and dendritic cell lineages. Underlying this lineage diversion, L1 mediates binding of TCF-1 to its earliest target genes, which are subject to repression as T cells develop. These data suggest that the intrinsically disordered N terminus of TCF-1 maintains T cell lineage fidelity.


Conflict of interest statement

Competing Interests Statement

Other authors declare no competing interests.

Figures

Extended Data Fig. 1
Extended Data Fig. 1. The N terminus of TCF-1 is intrinsically disordered (related to Figure 1)
a) Summary of size exclusion chromatography purification of affinity- and ion exchange-purified recombinant TCF-1 protein expressed in E. coli. Chromatogram (left) displays measured A280 vs. elution volume for a representative injection of pooled ion exchange fractions (see Methods). Vertical dashed lines indicate approximate position of fractions pooled for analysis by HX-MS. Gel image displays SDS-PAGE analysis (stained with SYPRO Orange) of final protein input to HX-MS. Chromatogram (right) displays A280 vs. elution time for repeated analysis of indicated fractions from a prior Superose 6 Increase 10/300GL run during the initial purification. This repeated analysis suggests that the purified material is subject over time to some extent of aggregation that resembles the larger molecular weight (MW) population seen during the initial purification. b) Plots of normalized deuterium uptake (relative to measured deuterium content after 23hrs of H-to-D exchange) at each indicated measured sample pH (pHmeas) for each TCF-1 peptide observation at the indicated exchange times (different peptide charge states treated as separate observations). For observations with technical replicates (n=3 independent samples for pHmeas 6.0 4sec, 10sec), center line represents mean value with error bars correspond to standard deviation. Shaded columns indicated pHmeas and time conditions where approximately equivalent exchange is expected given the pH dependency of HX rates. c) Representative mass spectra of indicated peptide observations (generated using ExMS2). Relative to the all-1H sample (treated as HX time = 0sec), the change in m/z of each centroid distribution reflects the indicated change in mass due to deuterium incorporation. d) Time-scaled, back exchange-corrected deuterium content vs. time experimental data as in Fig. 1c was fit to a stretched-exponential function for each peptide across the indicated regions of TCF-1 (each datapoint is a unique peptide observation; different charge states treated as separate observations). Boxplots of estimated kex values are approximate estimates of observed peptide-level HX rate constants. Center line of box plots is median, limits are 1st and 3rd quartiles, and whiskers are maximum and minimum values. Peptide observations for which nonlinear least squares regression could not be achieved are not displayed. e) Comparison of approximate predicted (random coil) kpred vs. observed kex peptide-level HX rate constants across peptides from the L1-L7 regions of TCF-1. Values for kex are as in (d). Values for kpred were estimated from the stretched-exponential fitting approach using predicted deuterium content vs. time data calculated from the predicted residue-specific HX rate constants across each respective peptide sequence under the assumption of no protection from exchange (see methods). Pearson correlation coefficient and corresponding correlation P value are displayed (calculated in R). Peptide observations for which nonlinear least squares regression of either predicted or observed data could not be achieved are not displayed.
Extended Data Fig. 2
Extended Data Fig. 2. Loss of TCF-1’s L1 domain limits DN1 to DN2 transition (related to Figure 2)
a) Identification of Thy1+ CD25+ cells in OP9-DLL1 co-cultures of Tcf7 cKO cells transduced with empty vector (EV), WT TCF-1, or mutant TCF-1 (ΔL1–7) on day 13. Cells are pre-gated on SSC-A/FSC-A, Singlets, Live cell (Viability-), CD45+, Vex+ (transduced). b) Identification of DN1 (CD44+ CD25-), DN2 (CD44+CD25+), and DN3 (CD44- CD25+) cells in OP9-DLL1 co-cultures of Tcf7 cKO cells transduced with EV, WT TCF-1, or mutant TCF-1 (ΔL1–7) on day 13. Cells are pre-gated on SSC-A/FSC-A, Singlets, Live cell (Viability-), CD45+, Vex+ (transduced). c) Number and frequency of Thy1+ CD25+ cells (top) and DN2, and DN3 cells by CD44 and CD25 surface expression (bottom) in OP9-DLL1 co-cultures of Tcf7 cKO cells transduced with EV, WT TCF-1, or mutant TCF-1 (ΔL1–7) on day 13. Data are representative of at least 3 independent experiments; bars show mean from n=2 biologically independent animals, dots represent individual data points. P values are determined by one-way ANOVA followed by Dunnett’s multiple comparison test with WT TCF-1 (P45) as a control. *P ≤ 0.05, ** P ≤ 0.01, *** P ≤ 0.001, and **** P ≤ 0.001. d) Identification of DN1 (CD44- CD25-), DN2 (CD44+ CD25+), and DN3 (CD44- CD25+) cells in co-cultures of wild type (WT) ckit+ bone marrow (BM) progenitors transduced with WT TCF-1, EV, or mutant TCF-1 (ΔL1–7) (GFP+) on OP9-DLL1 cells at day 5. Cells are pre-gated on SSC-A/FSC-A, Singlets, Live cell (Viability-), and CD45+. e) Frequency of GFP+ (transduced) and GFP- (un-transduced) DN2 and DN3 cells in (D) (top). Analysis of ratio of GFP+ to GFP- Thy1+ CD25+ cells in (D) (middle). Frequency of GFP+ and GFP- Thy1+ CD25+ cells in (D) (bottom). Data are representative of at least 3 independent experiments; bars show the mean from n=2 biologically independent animals, dots represent individual data points. f) Identification of DN1 (CD44- CD25-), DN2 (CD44+ CD25+) and DN3 (CD44- CD25+) in WT ckit+ BM progenitors transduced with WT TCF-1, ΔL1, or EV (GFP+) cultured on OP9-DLL4 cells after 5 days. Cells are pre-gated on SSC-A/FSC-A, Singlets, Live cell (Viability-), and CD45+. g) Identification of DN1 (CD44+ CD25-), DN2 (CD44+ CD25+), and DN3 (CD44- CD25+) T cell progenitors in co-cultures of WT ckit+ BM progenitors transduced with WT TCF-1 (GFP+) and cultured on OP9-DLL1 cells (left) and OP9 controls cells (right) for 5 days. Cells are pre-gated on SSC-A/FSC-A, Singlets, Live cell (Viability-), and CD45+. h) Histogram depicting TCF-1 intracellular flow cytometry in Tcf7−/− progenitors un-transduced (Vex-) or transduced with WT TCF-1, ΔL1, or EV (Vex+) as well as WT TCF-1 sufficient CD25- or CD25+ progenitors. i) Frequency of B220+ Vex+ (transduced) cells in Tcf7 cKO OP9-DLL1 co-cultures at day 5 (left) and 13 (right). Bars represent mean frequency from n=2 biologically independent animals, dots represent individual data points. j) Number (left) and frequency (right) of CD11b+ CD25- cells at day 7 in Tcf7 cKO OP9-DLL1 co-cultures. Bars represent the mean values from n=2 biologically independent animals, dots represent individual data points.
Extended Data Fig. 3
Extended Data Fig. 3. GATA2 driven mast cell gene signature is unmasked in developing T cells lacking L1 (related to Figure 3)
a) Heatmaps depicting gene ontology enrichment in significantly differential gene sets (adjusted P<0.05, |Log2FoldChange|>1). P values are calculated using a hypergeometric test. b) Heatmap demonstrating differentially expressed genes (adjusted P <0.05) between wild type (WT) TCF-1 transduced DN1 and DN2s from Tcf7 cKO cells on OP9-DLL1 co-cultures at day 7. P-values are calculated by the Wald test and adjusted using the Benjamini and Hochberg method. c) Principle component plot of RNA-sequencing on 293T human cell line transduced with empty vector (EV), wild type (WT) human TCF-1, and an internal deletion mutant lacking the analogous L1 region of human TCF-1; human ΔL1 (upper panel). GSEA depicts the enrichment of genes in GSE22601_IMMATURE_CD4_SINGLE_POSITIVE VS_DOUBLE_POSITIVE_THYMOCYTE_UP gene set within genes upregulated in 293T cells with human TCF-1 vs. EV. d) Heatmap depicting transcription factors differentially upregulated in ΔL1 and WT TCF-1 transduced DN2s from Tcf7 cKO cells on OP9-DLL1 co-cultures at day 7 (adjusted P<0.05 and |Log2FoldChange|>1). P-values are calculated by the Wald test and adjusted using the Benjamini and Hochberg method. e) Bar plots depicting select gene expression (in RPKM) values in DN1 and DN2s from Tcf7 cKO cells on OP9-DLL1 co-cultures at day 7. Bars represent mean RPKM values, error bars represent Standard deviation (SD), and individual data points are represented with dots.
Extended Data Fig. 4
Extended Data Fig. 4. GATA2 driven mast cell transcriptional signature is unmasked in developing T cells lacking the L1 region of TCF-1 (related to Figure 3)
a-e. Representative genome browser views of counts per million normalized strand specific RNA-seq tracks at Gata2 (a.), Gata3 (b.), Thy1 (c.), Mcpt1/2/4 (d.) and Bcl11b loci (e).
Extended Data Fig. 5
Extended Data Fig. 5. The L1 domain of TCF-1 modulates binding and transcriptional outcomes in early T cell development independent of chromatin accessibility. (related to Figure 4)
a) SeqLogo depicting top enriched motifs from de novo HOMER motif analysis of differentially accessible peaks in WT vs. EV, ΔL1 vs. EV, and WT vs ΔL1 transduced DN1 and DN2s with non-differential peaks as background. P values are calculated using a hypergeometric test. b) Venn-diagram representing TCF-1 CUT&RUN experiments and associated unique and overlapping WT TCF-1 and ΔL1 binding events in DN1 and DN2s. c) Principal component analysis of TCF-1 CUT&RUN and chromatin accessibility measurements in DN1 and DN2s. Counts of ATAC-seq and TCF-1 binding in CUT&RUN measurements were generated across the union of all peaks across all ATAC-seq and CUT&RUN conditions. d) SeqLogo depicting top enriched motifs from de novo HOMER motif analysis of L1 dependent and independent binding events in DN1 and DN2s compared to randomly generated background. P values are calculated using a hypergeometric test. e) Heatmap depicting TCF-1 binding as measured by TCF-1 CUT&RUN and chromatin accessibility in DN1 and DN2s at differentially accessible peaks open in WT DN2 vs. DN1s.
Extended Data Fig. 6
Extended Data Fig. 6. Loss of the L1 domain of TCF-1 has limited effect on chromatin accessibility in committed T cells (related to Figure 6)
a) Principal component plot of RNA-sequencing on Tcf7−/− DN3 like Scid.adh cells transduced with empty vector (EV), wild type (WT) TCF-1, and internal deletion mutants: ΔL1, ΔL2, ΔL6, and ΔL7. b) Volcano plot demonstrating significantly differential genes comparing WT TCF-1 and EV (left), ΔL1 and WT TCF-1 (middle), and ΔL7 and WT TCF-1 (right) transduced Tcf7−/− DN3 cells. (adjusted P<0.05 and |Log2FoldChange|>1) P-values are calculated by the Wald test and adjusted using the Benjamini and Hochberg method. c) Heatmap depicting significantly up and down-regulated genes comparing WT TCF-1 and EV transduced Tcf7/− KO DN3 cells. (adjusted P <0.05 and |Log2FC|>1). P-values are calculated by the Wald test and adjusted using the Benjamini and Hochberg method. d) Pathway enrichment analysis of differential gene sets depicted in B. P values are calculated using a hypergeometric test. e) Quantification of number of WT TCF-1 and ΔL1 binding events profiled by TCF-1 and FLAG CUT&RUN in Tcf7/− KO DN3 cells. Bars represent mean number of binding sites from n=2 biologically independent samples. f) Principal component plot of WT TCF-1 and ΔL1 binding events as measured in E.
Extended Data Fig. 7
Extended Data Fig. 7. Proteomics measurements suggest the interaction between RUNX1 and TCF-1 is dependent on the L1 domain (related to Figure 6).
a) Representative immunofluorescence images depicting GFP tagged wild type (WT) TCF-1, ΔL1 mutant TCF-1 and empty vector (EV). DAPI staining of nuclei and overlay images are included (right). Boxplot of granularity of GFP signal in DN3 cells transduced with either EV, WT TCF-1 or ΔL1 fused with GFP. Granularity indicates the percentage of highest intensity elements of 8 pixels subtracted relative to the background (see methods). Cells with a more granular pattern or punctate localization are indicated by a lower percentage. Center line of box plots represent median granularity, limits represent 1st and 3rd quartiles, whiskers represent maximum and minimum values, data points represent outliers. Cells analyzed per condition EV: n=189, WT TCF-1: n=237, ΔL1: n=190. P values were determined by a two-tailed Mann-Whitney test: *P ≤ 0.05, ** P ≤ 0.01, *** P ≤ 0.001, and **** P ≤ 0.001. Scale bar: 4μm. b) Heatmap indicating the Z score of the log2 normalized abundance of top 100 proteins detected with a higher enrichment between DN3 cells expressing WT TCF-1 and both EV and ΔL1 in mass spectrometry of TCF-1 immunoprecipitation in DN3 cells. c) Depiction of L1 dependent TCF-1 protein-protein interaction network identified by mass spectrometry of TCF-1 immunoprecipitation in DN3 cells. Node size and color indicate fold change in log normalized abundance between DN3 cells expressing WT TCF-1 and EV. d) Network terms corresponding to Uniprot keywords are highlighted in the network depicted in b.
Fig. 1
Fig. 1. The N terminus of TCF-1 is intrinsically disordered.
a) Profile of amino acid conservation score across residues of mouse TCF-1 protein utilizing ConSurf-DB and MAFFT alignment of 150 vertebrate homologous sequences (top). Profile of VSL2 score across residues in mouse TCF-1 utilizing the predictor of natural disorder regions (PONDR) (bottom). b) Percentage of deuterium uptake at 4 seconds and measured sample pH of 7.0 for exchange (normalized to measured deuterium content after 23 hours of H-to-D exchange) for each TCF-1 peptide observation (different peptide charge states treated as separate observations). Line represents mean value of n=2 technical replicates. c) Number of incorporated deuterium (D) atoms (corrected for back exchange) vs. H-to-D exchange (HX) time for each indicated peptide observation as representative examples of the time-dependent HX behavior of L1 and HMG-box domains. HX time for pHmeas 5.0 and 7.0 was scaled by a factor of 10 relative to a pHmeas 6.0 timescale in order to directly compare all data. Solid line corresponds to fit of data to stretched exponential function used for estimating approximate experimental peptide-level HX rate constant kex (see Methods). Red dashed line corresponds to the predicted behavior for each indicated peptide sequence as random coil (calculated as described,,). Time = 0sec value is assumed as 0 D. d) Schematic representation of wild type isoforms of TCF-1 (P33 and P45) and internal deletions. e) Immunoblot (IB) analysis of NIH 3T3 cells transduced with FLAG-tagged wild type (WT) TCF-1 and mutant TCF-1 constructs with internal deletions (ΔL1-ΔL7). Vinculin used as a loading control. f) Representative histogram of flow cytometry depicts TCF-1 expression with intracellular anti-mouse TCF-1 staining in NIH 3T3 cells transduced with empty vector (EV), wild type TCF-1 (WT), and mutant TCF-1 constructs with internal deletions (ΔL1-ΔL7). g) Representative immunofluorescence depicts nuclear localization of FLAG tagged wild type (WT) and mutant TCF-1 with internal deletions. A nuclear mask is indicated with a dotted line in DAPI images and superimposed to the FLAG AF568 channel to indicate nuclear localization of FLAG tagged wild type (WT) and mutant TCF-1. Scale bar: 10 μm.
Fig. 2
Fig. 2. Loss of TCF-1’s L1 domain limits DN1 to DN2 transition.
a) Identification of Thy1+ CD25+ cells in OP9-DLL1 co-cultures of Tcf7 cKO cells transduced with empty vector (EV), wild type (WT) TCF-1, or mutant TCF-1 (ΔL1-ΔL7 and ΔHMG) on day 5 after in vitro differentiation. Data are representatives of at least 3 independent experiments, all cells were pre-gated on SSC-A/FSC-A, Singlets, Live cell (Viability-), CD45+, transduced (Vex+). b) Detection of DN1, DN2, and DN3 cells by CD44 and CD25 surface expression in co-cultures described in A. Data are representatives of at least 3 independent experiments. All cells were pre-gated on SSC-A/FSC-A, Singlets, Live cell (Viability-), CD45+, transduced (Vex+). c) Quantification of frequency and number of Thy1+ CD25+ cells (left), CD44+ CD25+ DN2s, and CD44- CD25+ DN3 cells (right) from Tcf7 cKO cells on day 5 after in vitro differentiation on OP9-DLL1 cells. Bars represent mean from n=2 independent animals, individual replicates are represented by data points. P values are determined by one-way ANOVA followed by Dunnett’s multiple comparison test with WT TCF-1 (P45) as a control. *P ≤ 0.05, ** P ≤ 0.01, *** P ≤ 0.001, and **** P ≤ 0.001. d) Representative flow cytometric analysis identifying transduced (Vex+) GFP+ cells (Tcf7 eGFP reporter) of Tcf7 cKO cells on day 5 after in vitro differentiation on OP9-DLL1 co-cultures. e) Quantification of frequency of Vex+ GFP+ (Tcf7 eGFP reporter) cells in OP9-DLL1 co-cultures on day 5 as described in D. All cells were pre-gated on SSC-A/FSC-A, Singlets, Live cell (Viability-), and CD45+. Bars represent mean from n=2 independent animals, individual replicates are represented by data points.
Fig. 3
Fig. 3. GATA2 driven mast cell gene signature is unmasked in developing T cells lacking L1.
a) Identification and sorting strategy for DN1 and DN2 cells in Tcf7 cKO co-cultures after in vitro differentiation on OP9-DLL1 cells for 7 days. b) PCA of RNA-seq on cell populations depicted in A. RNA-seq for each population was performed in 2–3 technical replicates for n=2 independent animals. c) Volcano plots demonstrating significantly differential genes as calculated by DESeq2 between empty vector (EV) vs. wild type (WT) TCF-1, ΔL7 vs. WT TCF-1, and ΔL1 vs. WT TCF-1 transduced Tcf7 cKO DN1s. (Adjusted P<0.05 and |Log2FoldChange|>1) P-values are calculated by the Wald test and adjusted using the Benjamini and Hochberg method. d) Volcano plot demonstrating significantly differential genes as calculated by DESeq2 between ΔL1 vs. WT TCF-1 and ΔL7 vs. WT TCF-1 transduced Tcf7 cKO DN2s. (Adjusted P<0.05 and |Log2FoldChange|>1) Significance calculated as in C. e) Bar plot of expression values (in RPKM) of select genes in DN1 and DN2s. Bars represent mean expression values +/− SD, and individual data points are overlaid. f) Heatmap depicting genes (n=137) significantly upregulated in WT vs. ΔL1 transduced DN2s (Adjusted P<0.05 and |Log2FoldChange|>1). Significance calculated as in C g) Heatmap of two sets of genes (“ΔL1 specific” and “DN1 legacy”) significantly upregulated in ΔL1 vs. WT TCF-1 transduced Tcf7 cKO DN2s. (Adjusted P<0.05 and |Log2FoldChange|>1) Significance calculated as in C. h) Boxplots of normalized expression of gene sets (“ΔL1 specific” and “DN1 legacy”) depicted in (G.) in 62 immune cell populations from ImmGen. Center line of box plots represent median, bounds of box represent 1st and 3rd quartiles, whiskers represent maximum and minimum values, data points represent outlier values. i) Cumulative distribution plot of corresponding fold change in GATA2 KO dendritic cell (DC) progenitors (GATA2KO/control) of genes differentially up and down regulated between ΔL1 and WT transduced DN2s. P value was determined by two-sample two-sided Kolmogorov-Smirnov test on Log2FoldChange values derived from RNA-seq on n=2 independent animals, with 2–3 technical replicates each. k) Heatmap depicting genes significantly upregulated in ΔL1 vs. WT transduced DN2s that also were downregulated between GATA2 knock out and control DC progenitors.
Fig. 4
Fig. 4. L1 modulates binding and transcriptional outcomes in early T cell development.
a) PCA of ATAC-seq in WT and mutant TCF-1 DN1/DN2. ATAC-seq was performed in 1–3 technical replicates for n=2 independent animals. b) Volcano plot demonstrating differentially accessible peaks EV vs WT, EV vs ΔL1, ΔL1 vs WT DN1 (left) and ΔL1 vs WT DN2 (right) (adjusted P<0.05 and |Log2FoldChange|>1). P-values are calculated using Wald test and adjusted using the Benjamini and Hochberg method. c) SeqLogo depicting enriched motifs from de novo HOMER analysis on differentially accessible peaks open in WT TCF-1 vs. ΔL1 transduced DN2 with non-differential peaks as background. P values are calculated using a hypergeometric test. d) Heatmap depicting chromatin accessibility in DN1 and DN2 with binding of GATA2 in mast cells and GATA3 and RUNX1 in DN1,, at differentially accessible peaks between WT vs. ΔL1 DN2. e) As in c, motif analysis on differential peaks closed in WT TCF-1 vs. ΔL1 transduced DN2. P values calculated as in c. f) As in d, depicting differentially accessible peaks closed in WT compared ΔL1 DN2. g) Number of WT and ΔL1 binding sites profiled by TCF-1 CUT&RUN in DN1, DN2 and DN3 cells n=2 independent animals. Bars represent mean number of binding sites, individual replicate data points are overlaid. h) L1 dependent and independent TCF-1 binding sites in DN1 and DN2 cells. i) Boxplot representing distance to TSS in bp (top) and read normalized ATAC coverage for groups of binding sites described in (h.) (bottom). Center line of box plots represent median, bounds of box represent 1st and 3rd quartiles, whiskers represent maximum and minimum, data points represent outliers. j) Cumulative distribution of genes within 1,000bp of a WT TCF-1 binding site shared or unique to DN1/DN2 and change in expression between DN1/DN2 (Log2 fold change). P values calculated by two-sample two-sided Kolmogorov-Smirnov test on n=2 independent animals, with 2–3 technical replicates. WT TCF-1 only bound in DN1 vs. shared DN1 & DN2 P=3.7e-6, WT TCF-1 only bound in DN2 vs. shared DN1 & DN2 P=2.2e-16, WT TCF-1 only bound in DN1 vs. only bound DN2 P=2.53e-13. k) Genome browser view of Gata2, Mcpt and Gata3.
Fig. 5
Fig. 5. L1 can be functionally substituted with another unstructured domain.
a) Schematic representation of wild type (WT) isoform of TCF-1 (P45), mutant lacking the L1 domain (ΔL1) and mutant in which the L1 domain is replaced with the C terminus of EBF1 (EBF-1 CTD). b) Immunoblot analysis of 293T cells transfected with wild type (WT) TCF-1 and mutant TCF-1 constructs; Δ L1 and Δ L1 + EBF1 CTD. Immunoblot is probed with TCF-1 antibody and H3 as a loading control. c) Identification of Thy1+ CD25+ cells in OP9-DLL1 co-cultures of Tcf7 cKO cells transduced with empty vector (EV), wild type (WT) TCF-1, or mutant TCF-1 (ΔL1 and Δ L1 + EBF1 CTD) on day 5 after in vitro differentiation. All cells were pre-gated on SSC-A/FSC-A, Singlets, Live cell (Viability-), CD45+, transduced (Vex+). d) Quantification of frequency (left) and numbers (right) of Thy1+ CD25+ cells from Tcf7 cKO cells on day 5 after in vitro differentiation on OP9-DLL1 cells (in C.). Bars represent mean values from n=2 independent animals, individual replicate data points are shown. e) Representative flow cytometric analysis identifying transduced (Vex+) GFP+ cells (Tcf7 eGFP reporter). All cells were pre-gated on SSC-A/FSC-A, Singlets, Live cell (Viability-), CD45+. f) Quantification of binding sites identified by TCF-1 CUT&RUN in DN1s transduced with WT TCF-1, ΔL1, ΔL1 + EBF1 CTD, and EV. CUT&RUN experiments for each population were performed in at least two biological replicates. Bars represent mean number of binding sites from n=2 independent animals, individual data points are shown. g) Principal component analysis of TCF-1 CUT&RUN in Tcf7 cKO DN1 and DN2s transduced with wild type (WT) TCF-1, Δ L1, Δ L1 + EBF1 CTD, and EV. CUT&RUN experiments for each population were performed in at least two biological replicates. h-i) Genome browser view of Il2ra, Rag1/2, and Lef1 loci visualizing CUT&RUN profiles of DN1and DN2s from OP9-DLL1 co-culture of Tcf7 cKO cells at day 7.
Fig. 6
Fig. 6. Loss of L1 has limited effect on chromatin accessibility in committed T cells.
a) Experimental design of gene replacement strategy using retroviral transduction of wild type (P45 isoform) or mutant TCF-1 in Scid.adh (DN3) cells after CRISPR/Cas9 disruption of endogenous TCF-1. b) Quantification of L1 dependent and independent binding sites detected with TCF-1 CUT&RUN in DN1, DN2, and Scid.adh DN3 cells. Bars represent total number of binding sites. c) Principal component analysis depicting ATAC-seq in Tcf7−/− DN3 cells transduced with wild type (WT), empty vector (EV), or mutant TCF-1 (ΔL1, ΔL2, ΔL6, or ΔL7). d) Volcano plot demonstrating differential accessibility of ATAC-seq peaks between EV transduced and WT TCF-1 (left), ΔL1 (middle) and ΔL7 (right) transduced Tcf7−/− DN3 cells. (adjusted P<0.05 and |Log2FoldChange|>1). P-values are calculated by the Wald test and adjusted using the Benjamini and Hochberg method. e) Heatmap demonstrating TCF-1 and ΔL1 binding measured by CUT&RUN and chromatin accessibility in WT and mutant TCF-1 (ΔL1, ΔL2, ΔL6, and ΔL7) transduced cells at peaks significantly open in WT TCF-1 compared to EV transduced Tcf7−/− DN3 cells. (adjusted P<0.05 and |Log2FoldChange|>1). P-values are calculated by the Wald test and adjusted using the Benjamini and Hochberg method. f-g) Genome browser view of Il2ra and Rag1/2 loci depicting TCF-1 CUT&RUN and ATAC-seq profiles in wild type (WT) TCF-1, empty vector (EV), and mutant TCF-1 (ΔL1, ΔL2, ΔL6, and ΔL7) transduced Tcf7−/− DN3. h) Depiction of L1 dependent TCF-1 protein-protein interaction (PPI) network identified by mass spectrometry (MS) of TCF-1 immunoprecipitation in DN3 cells. All Interactions were filtered and ranked (see methods) to identify proteins with enrichment in WT-TCF-1 vs. EV and ΔL1 immunoprecipitations. Network was filtered based on first neighbor nodes of Tcf7. Node size and color indicate fold change in normalized abundance between DN3 cells expressing WT TCF-1 and EV. i) RUNX1 co-immunoprecipitation with separate parallel immunoblotting for RUNX1 and TCF-1. Bar plot depicted mean FLAG protein level quantification normalized to 5% input. Data points indicate three quantifications per condition and error bars represent standard deviation. Results are representative of n=2 biologically independent samples.

Similar articles

Cited by

References

    1. Cirillo LA et al. Opening of compacted chromatin by early developmental transcription factors HNF3 (FoxA) and GATA-4. Mol Cell 9, 279–289, doi:10.1016/s1097-2765(02)00459-8 (2002). - DOI - PubMed
    1. Zaret KS & Carroll JS Pioneer transcription factors: establishing competence for gene expression. Genes Dev 25, 2227–2241, doi:10.1101/gad.176826.111 (2011). - DOI - PMC - PubMed
    1. Lambert SA et al. The Human Transcription Factors. Cell 172, 650–665, doi:10.1016/j.cell.2018.01.029 (2018). - DOI - PubMed
    1. Verbeek S. et al. An HMG-box-containing T-cell factor required for thymocyte differentiation. Nature 374, 70–74, doi:10.1038/374070a0 (1995). - DOI - PubMed
    1. Johnson JL et al. Lineage-Determining Transcription Factor TCF-1 Initiates the Epigenetic Identity of T Cells. Immunity 48, 243–257 e210, doi:10.1016/j.immuni.2018.01.012 (2018). - DOI - PMC - PubMed
Methods Only Reference
    1. Kan ZY, Ye X, Skinner JJ, Mayne L. & Englander SW ExMS2: An Integrated Solution for Hydrogen-Deuterium Exchange Mass Spectrometry Data Analysis. Anal Chem 91, 7474–7481, doi:10.1021/acs.analchem.9b01682 (2019). - DOI - PubMed
    1. Carleton M. et al. Signals transduced by CD3epsilon, but not by surface pre-TCR complexes, are able to induce maturation of an early thymic lymphoma in vitro. J Immunol 163, 2576–2585 (1999). - PubMed
    1. Ogilvy S. et al. Promoter elements of vav drive transgene expression in vivo throughout the hematopoietic compartment. Blood 94, 1855–1863 (1999). - PubMed
    1. Shimshek DR et al. Codon-improved Cre recombinase (iCre) expression in the mouse. Genesis 32, 19–26, doi:10.1002/gene.10023 (2002). - DOI - PubMed
    1. Dou Z. et al. Autophagy mediates degradation of nuclear lamina. Nature 527, 105–109, doi:10.1038/nature15548 (2015). - DOI - PMC - PubMed

Publication types

MeSH terms