

The metabolic consequences of HIV/TB co-infection
- PMID: 37592227
- PMCID: PMC10436461
- DOI: 10.1186/s12879-023-08505-4
The metabolic consequences of HIV/TB co-infection
Abstract
Background: The synergy between the human immunodeficiency virus (HIV) and Mycobacterium tuberculosis during co-infection of a host is well known. While this synergy is known to be driven by immunological deterioration, the metabolic mechanisms that contribute to the associated disease burden experienced during HIV/tuberculosis (TB) co-infection remain poorly understood. Furthermore, while anti-HIV treatments suppress viral replication, these therapeutics give rise to host metabolic disruption and adaptations beyond that induced by only infection or disease.
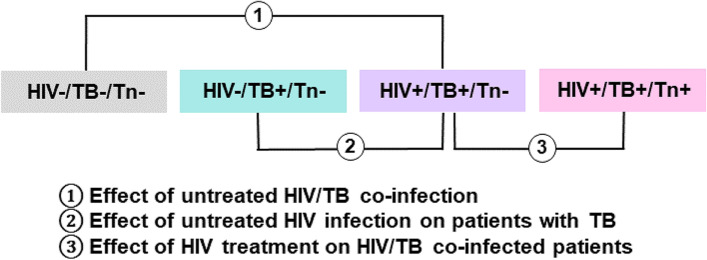
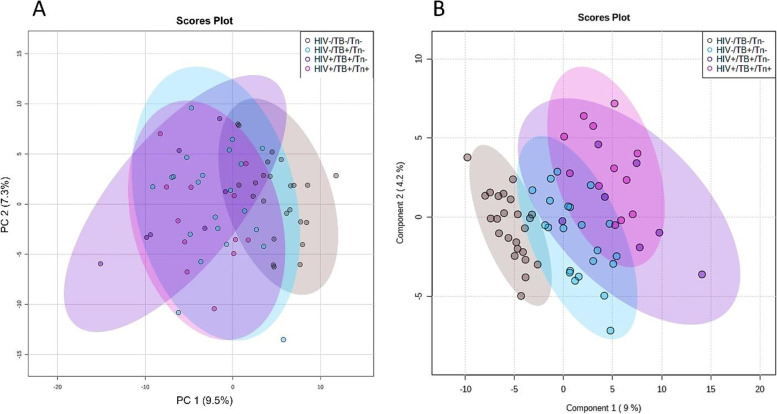
Methods: In this study, the serum metabolic profiles of healthy controls, untreated HIV-negative TB-positive patients, untreated HIV/TB co-infected patients, and HIV/TB co-infected patients on antiretroviral therapy (ART), were measured using two-dimensional gas chromatography time-of-flight mass spectrometry. Since no global metabolic profile for HIV/TB co-infection and the effect of ART has been published to date, this pilot study aimed to elucidate the general areas of metabolism affected during such conditions.
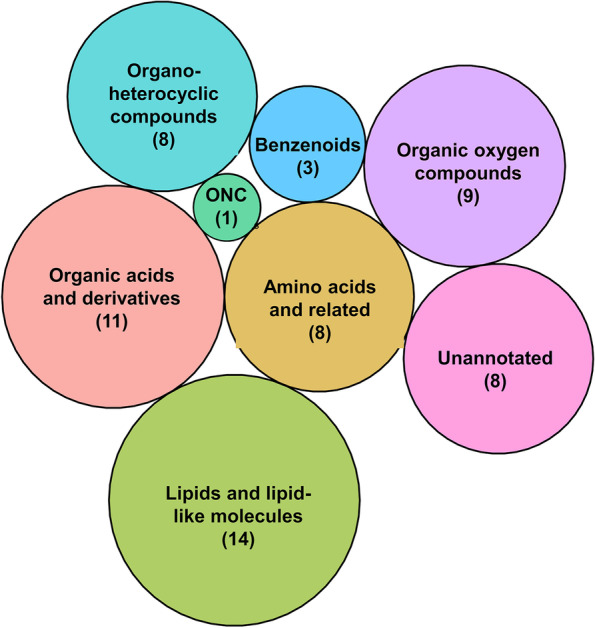
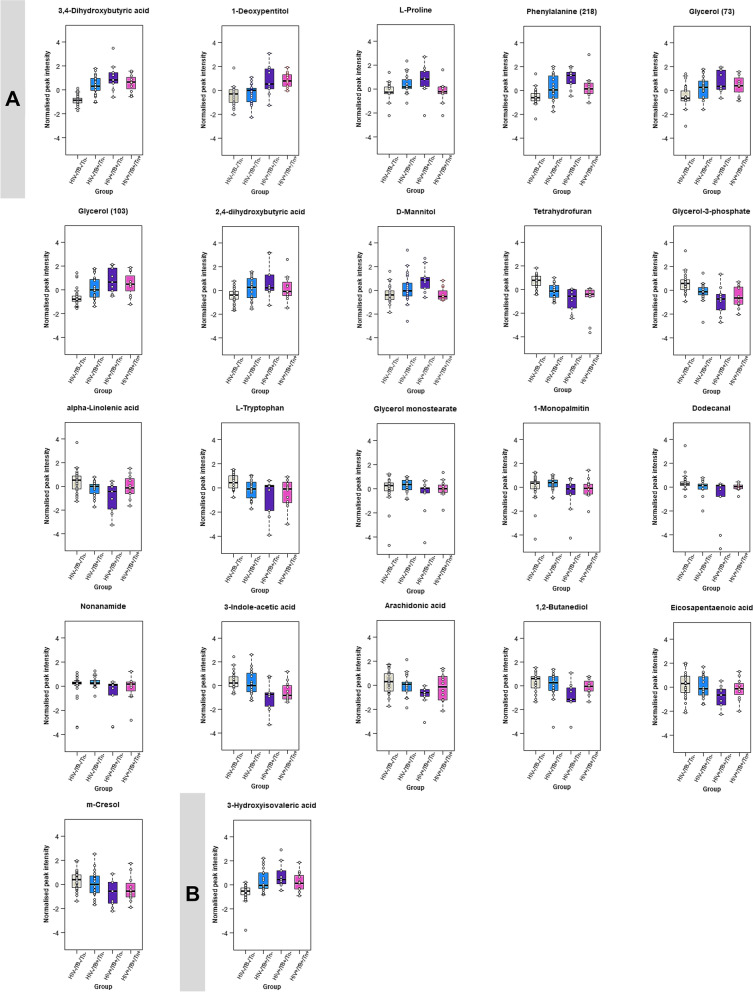
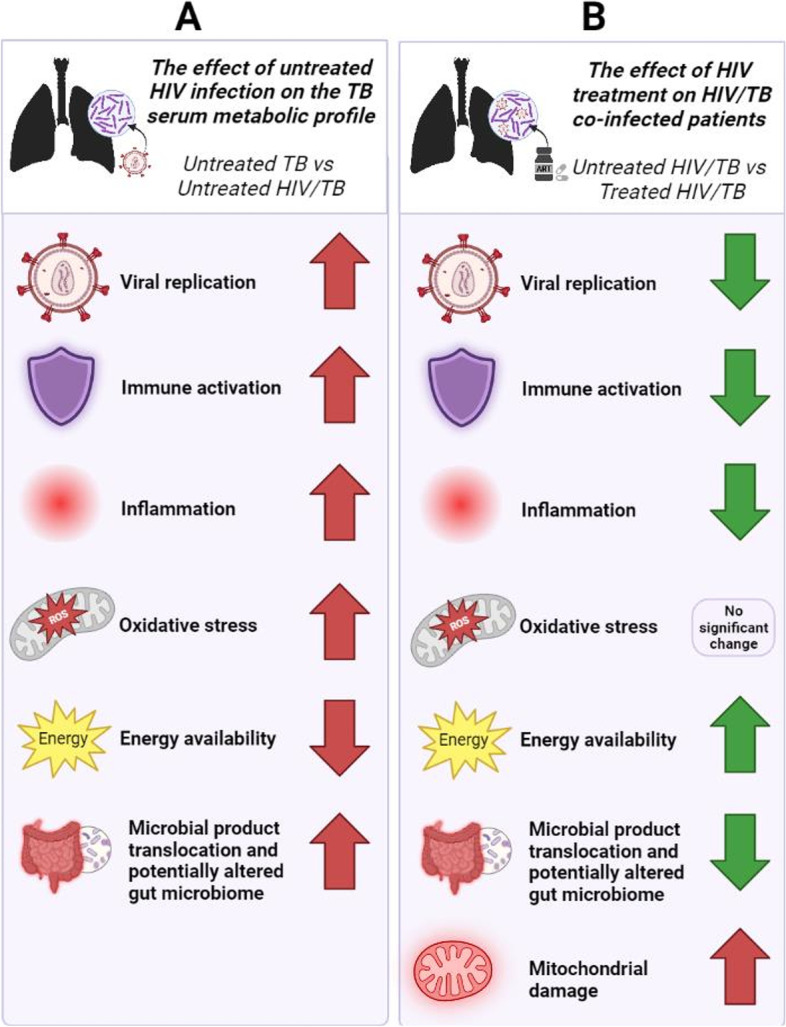
Results: HIV/TB co-infection induced significant changes to the host's lipid and protein metabolism, with additional microbial product translocation from the gut to the blood. The results suggest that HIV augments TB synergistically, at least in part, contributing to increased inflammation, oxidative stress, ART-induced mitochondrial damage, and its detrimental effects on gut health, which in turn, affects energy availability. ART reverses these trends to some extent in HIV/TB co-infected patients but not to that of healthy controls.
Conclusion: This study generated several new hypotheses that could direct future metabolic studies, which could be combined with other research techniques or methodologies to further elucidate the underlying mechanisms of these changes.
Keywords: GCxGC-TOFMS; Gut microbiome; HIV/AIDS; HIV/TB co-infection; Metabolism; Metabolomics; Tuberculosis.
© 2023. BioMed Central Ltd., part of Springer Nature.
Conflict of interest statement
The authors declare no competing interests.
Figures
Similar articles
-
Metabolic insights into HIV/TB co-infection: an untargeted urinary metabolomics approach.Metabolomics. 2024 Jul 16;20(4):78. doi: 10.1007/s11306-024-02148-5. Metabolomics. 2024. PMID: 39014031 Free PMC article.
-
Metabolomics as a Tool to Investigate HIV/TB Co-Infection.Front Mol Biosci. 2021 Oct 20;8:692823. doi: 10.3389/fmolb.2021.692823. eCollection 2021. Front Mol Biosci. 2021. PMID: 34746228 Free PMC article. Review.
-
[Effect of antiretroviral therapy in reducing deaths among patients co-infected with Mycobacterium tuberculosis and human immunodeficiency virus in Guangxi].Zhonghua Liu Xing Bing Xue Za Zhi. 2015 Feb;36(2):124-7. Zhonghua Liu Xing Bing Xue Za Zhi. 2015. PMID: 25907719 Chinese.
-
Characterising the urinary acylcarnitine and amino acid profiles of HIV/TB co-infection, using LC-MS metabolomics.Metabolomics. 2024 Aug 3;20(5):92. doi: 10.1007/s11306-024-02161-8. Metabolomics. 2024. PMID: 39096437 Free PMC article.
-
Mitochondrial Metabolism in Alveolar Macrophages of Patients Infected with HIV, Tuberculosis, and HIV/Tuberculosis.AIDS Res Hum Retroviruses. 2024 Mar;40(3):148-157. doi: 10.1089/AID.2023.0064. Epub 2023 Nov 14. AIDS Res Hum Retroviruses. 2024. PMID: 37885217 Review.
Cited by
-
Reactivation of Latent Tuberculosis Following COVID-19 and Epstein-Barr Virus Coinfection: A Case Report.Pathogens. 2025 May 16;14(5):488. doi: 10.3390/pathogens14050488. Pathogens. 2025. PMID: 40430808 Free PMC article.
-
Spatial transcriptomic analysis of HIV and tuberculosis coinfection in a humanized mouse model reveals specific transcription patterns, immune responses and early morphological alteration signaling.bioRxiv [Preprint]. 2025 Jan 30:2025.01.29.635571. doi: 10.1101/2025.01.29.635571. bioRxiv. 2025. PMID: 39975088 Free PMC article. Preprint.
-
Outcomes of Treating Tuberculosis Patients with Drug-Resistant Tuberculosis, Human Immunodeficiency Virus, and Nutritional Status: The Combined Impact of Triple Challenges in Rural Eastern Cape.Int J Environ Res Public Health. 2025 Feb 20;22(3):319. doi: 10.3390/ijerph22030319. Int J Environ Res Public Health. 2025. PMID: 40238299 Free PMC article.
-
Therapeutic Modulation of Arginase with nor-NOHA Alters Immune Responses in Experimental Mouse Models of Pulmonary Tuberculosis including in the Setting of Human Immunodeficiency Virus (HIV) Co-Infection.Trop Med Infect Dis. 2024 Jun 6;9(6):129. doi: 10.3390/tropicalmed9060129. Trop Med Infect Dis. 2024. PMID: 38922041 Free PMC article.
-
Plasma metabolomic profile is near-normal in people with HIV on long-term suppressive antiretroviral therapy.Front Cell Infect Microbiol. 2024 Mar 14;14:1340610. doi: 10.3389/fcimb.2024.1340610. eCollection 2024. Front Cell Infect Microbiol. 2024. PMID: 38550617 Free PMC article.
References
-
- World Health Organization . WHO policy on collaborative TB/HIV activities: Guidelines for national programmes and other stakeholders. Geneva: World Health Organization; 2012. p. 36. - PubMed
-
- World Health Organization . Global tuberculosis report 2020. Geneva: World Health Organization; 2020. p. 232.
-
- World Health Organization . Global tuberculois report 2022. Geneva: World Health Organisation; 2022. p. 68.
MeSH terms
Grants and funding
LinkOut - more resources
Full Text Sources
Medical
