. 2023 Aug 17;15(1):63.
doi: 10.1186/s13073-023-01217-z.

Sequence dependencies and mutation rates of localized mutational processes in cancer

Affiliations

Sequence dependencies and mutation rates of localized mutational processes in cancer

Gustav Alexander Poulsgaard et al. Genome Med. .

Abstract

Background: Cancer mutations accumulate through replication errors and DNA damage coupled with incomplete repair. Individual mutational processes often show nucleotide sequence and functional region preferences. As a result, some sequence contexts mutate at much higher rates than others, with additional variation found between functional regions. Mutational hotspots, with recurrent mutations across cancer samples, represent genomic positions with elevated mutation rates, often caused by highly localized mutational processes.

Methods: We count the 11-mer genomic sequences across the genome, and using the PCAWG set of 2583 pan-cancer whole genomes, we associate 11-mers with mutational signatures, hotspots of single nucleotide variants, and specific genomic regions. We evaluate the mutation rates of individual and combined sets of 11-mers and derive mutational sequence motifs.

Results: We show that hotspots generally identify highly mutable sequence contexts. Using these, we show that some mutational signatures are enriched in hotspot sequence contexts, corresponding to well-defined sequence preferences for the underlying localized mutational processes. This includes signature 17b (of unknown etiology) and signatures 62 (POLE deficiency), 7a (UV), and 72 (linked to lymphomas). In some cases, the mutation rate and sequence preference increase further when focusing on certain genomic regions, such as signature 62 in transcribed regions, where the mutation rate is increased up to 9-folds over cancer type and mutational signature average.

Conclusions: We summarize our findings in a catalog of localized mutational processes, their sequence preferences, and their estimated mutation rates.

Keywords: Hotspots; Mutation rate; Mutational processes; Pan-cancer.


Conflict of interest statement

The authors declare that they have no competing interests.

Figures
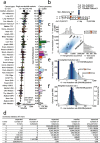
Fig. 1
Fig. 1
Mutation data and differential mutability of 11-mers. a The mutation rate of non-coding mutations (dots and boxplot) and the number of cancer genomes (bar chart) grouped and colored by cancer type. Figure 1a provides the color legend for cancer types for all figures. b Illustration of singleton and hotspot single nucleotide variants (SNVs). Strand symmetry is assumed in the analysis and mutated base pairs are represented by their reference pyrimidines (orange). Mutations are annotated with the ± 5 bp nucleotide context on the strand of the mutated pyrimidine and represented as 11-mers (framed) in the downstream analysis. c The distribution of 11-mer occurrences in the reference genome (x-axis) versus pan-cancer mutation count in 11-mers (y-axis) portrayed in a density cloud (n = 2,097,090). Diagonal lines represent mutation rates. Marginal plots show the distribution of 11-mer occurrences (top) and mutation count (right). d K-mer summary statistics given different sequence lengths (k). e The distribution of 11-mer mutation rates. Each 11-mer contributes a count on the y-axis. f The distribution of 11-mer mutation rates as a function of their genomic span. Each 11-mer contributes with its genomic occurrences to the genomic span on the y-axis. The secondary y-axis shows the fraction of the total genomic span (100%; 2,684,570,106 bp)
Fig. 2
Fig. 2
Uncertainty of 11-mer mutation rates. a Density of all genomic 11-mers (blue-scale) according to their genomic spans (x-axis) and mutation rates (y-axis). The mean mutation rate of the dataset (5.96 SNV/Mb/patient) is indicated by a solid line (baseline). Dashed lines indicate a 2- and 5-factor mutation rate increase. Colored curves (shades of red) represent the nominal p-value thresholds for a given 11-mer mutating at a significantly elevated rate compared to the baseline, with 11-mers above and to the right considered significant at the given level. If all 2,097,090 11-mer mutation rates were tested separately, the nominal p-value threshold of 10–9 (red) would provide a conservative bound for significance after (Bonferroni) multiple testing correction. In the downstream analysis of this study, we focus on a total of 817 combined sets of 11-mers, with extended spans compared to individual 11-mers. The nominal p-value threshold of 10–5 (organge) conservatively defines the region of mutation rates and spans where they would be significant after multiple testing correction. b The expected fraction of 11-mer sets achieving significance when the mutation rate is increased by a factor of two (top) or by a factor of five (bottom) as a function of their genomic spans. Color-coding and interpretation of p-value thresholds as in panel a
Fig. 3
Fig. 3
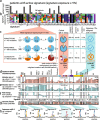
Assignment of cohorts and 11-mers to mutational signatures. a Stratification of genomes based on mutational signature load into 60 so-called activity cohorts. Each activity cohort comprises a number from 0 to 2049 genomes (median 48). The cohort with active signature 17b has 240 patients. b Fraction of cancer types in each activity cohort. Cancer type color legend can be found in Fig. 1a. c Each mutation has a posterior probability distribution of possible explanatory signatures (piechart). The average posterior probability distribution for an 11-mer is used to evaluate its most likely explanatory signature. On average, the mutations in 11-mers AGAACTTCGAG and AAAACTTATGC are most like explained by signature 17b, while mutations in CCCAGCACTTT are most likely explained by signature 18. All mutated 11-mers in the cohort are used as a background (red column). All 11-mers with signature 17b as the most likely signature make up a set of signature 17b-assigned 11-mers used for further analyses (blue column). The color legend for the piecharts can be found in panel d. d Color legend for signature association (top). Mutation rate of mutated 11-mers within each activity cohort (bottom). The mutation rates (left y-axis) are compared to the pan-cancer mutation rate (5.96 SNV/Mb/patient; grey dashed line) and differences are represented as a fold-change (right y-axis). e Mean mutation rate of each signature-assigned 11-mer set (blue). The mutation rates (left y-axis) are compared to the global mutation rate (5.96 SNV/Mb/patient; grey dashed line) and represented as a fold-change (right y-axis). f Fold-change from activity cohort mutation rate to signature-assigned 11-mer sets mutation rate. g Fraction of the genome spanned by 11-mers selected in each analysis step. h Sequence information content visualized by bit logo plots. The surprise (information) of observing a nucleotide is measured in bits derived from the Kullback–Leibler divergence with the reference genome as a background (A = 29.5%; C = 20.5%; G = 20.5%, T = 29.5%; “Methods”)
Fig. 4
Fig. 4
Hotspot overview and identification of enriched localized mutational processes. a Examples of pan-cancer recurrent and singleton SNVs in a 94-bp window on chromosome 16. SNVs are colored by cancer type. b Hotspot recurrence counts (x-axis) and frequency in counts (y-axis; top) with the proportion (bottom) of positions in protein-coding (red) or non-protein-coding regions (black). c All SNVs (n = 41,318,716) grouped by their pan-cancer recurrence count (1–7 +). Heatmap showing the relative contribution (color) of all mutational signatures (x-axis) to hotspot mutations of increasing recurrence (y-axis). Colors represent log2-fold change in mean signature posterior probability relative to singleton SNVs (recurrence 1). Several mutational signatures are enriched (red) in highly recurrent hotspots (recurrence 5, 6, 7 +). d Mutation rates of all mutated 11-mers (1 + ; 98.8% [2653 Mb] of the genome) and 11-mers with a hotspot in at least one of its instances for all hotspots (2 + ; 35.5% [954 Mb] of the genome), and highly recurrent hotspots (5 + ; 0.9% [23 Mb] of the genome)
Fig. 5
Fig. 5
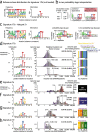
Hotspots capture highly mutated 11-mer sets. a Reference base distribution scaled by the mutational profile of signature 17b. The frequency logo (left) shows the percentage of each base that occupies a given position. The information logo (right) shows the Kullback–Leibler divergence (bits) of each base compared to the base distribution in the reference genome (chromosome 1–22; A = 29.5%; C = 20.5%; G = 20.5%, T = 29.5%). This signature-scaled base distribution is used as background input to the probability logo software. b Interpretation of positional dependencies as visualized by kpLogo. The bases of a given k-mer (k ≤ 4) is stacked vertically within the position it starts from with the top base (A1) at the start (position -5) and the bottom base (A4) at the end (position -2). The vertical k-mer (A1A2A3A4) should be interpreted as the most significant sequence of bases at that given position (-5). Only the most significant k-mer is shown at each position. As the logo software (pLogo and kpLogo) maxed out at p-value = 10–300 (equivalent to z-scores above 38.5), significance is reported using z-scores. c Example of motif visualization for signature 17b using four types of logo plots. The frequency logo and the information logo are produced as in panel a. pLogo and kpLogo quantify the surprise of observing a letter given a binomial distribution, where kpLogo only shows the most surprising k-mer (k ≤ 4) at each position. pLogo and kpLogo use as background the expected base distribution under a given signature, for signature 17b, the background is equivalent to the base distributions in panel a. d Signature 17b-assigned 11-mers of all recurrences-levels (1 + ; top horizontal panels), 11-mers with a hotspot in at least one of its instances (2 + ; middle horizontal panels), and 11-mers with a highly recurrent hotspot in at least one of its instances (5 + ; bottom horizontal panels). Information logo plots use as background the base distribution from the reference genome (left logo plot). Genomic span (y-axis) distribution on mutation rates (x-axis; middle histogram). Cancer type distribution within the cohort (right stacked bar plot), colored as in Fig. 1a. e UV-signature 7a-assigned 11-mers with a highly recurrent hotspot in at least one of its instances (5 +). Plots are interpreted as in panel d. f POLE-signature 62-assigned 11-mers with a highly recurrent hotspot in at least one of its instances (5 +). Plots are interpreted as in panel d. g Signature 72-assigned 11-mers with a highly recurrent hotspot in at least one of its instances (5 +). Plots are interpreted as in panel d. h Signature 19-assigned 11-mers with a highly recurrent hotspot in at least one of its instances (5 +). Plots are interpreted as in panel d
Fig. 6
Fig. 6
Genomic subsets with highly elevated mutation rates. a The decreasing genomic spans (x-axis) and increasing mutation rates (y-axis) are shown for nested genomic subsets for the signature 17b cohort. The cohort mutation rate is based on the entire non-coding genome, followed by the signature assigned 11-mers, hotspot-associated 11-mers, and finally, the subset falling in the genomic region with the highest (significant) observed mutation rate. The relative mutation rate increase from the prior set is shown and its significance indicated (red color scale; Bonferroni corrected p-value based on all 817 tests in full study; see Additional file 1: Fig. S2 for specific values). The overall total rate change compared with the cohort is given parenthetically. Mutation rate confidence intervals (CI-99%) are narrow and therefore invisible. b The genomic spans (y-axis) of genomic positions binned by their mutation rates (x-axis; log-scale) for the cohort, signature, hotspot, and genomic region subsets as defined above. The level of a mutation rate increase (red) or decrease (blue) is shown relative to the mean cohort mutation rate (8.72 SNV/Mb/patient for signature 17b; white). c Sequence information content surrounding the SNVs for each of the four genomic subsets defined in a. d, e, f UV-induced signature 7a genomic subsets visualized as in panels a–c. g, h, i POLE (polymerase epsilon deficiency) signature 62 genomic subsets visualized as in panels a–c. j, k, l Signature 72 (lymphoma-linked; unknown etiology) genomic subsets visualized as in panels a–c. Coresponding results for all signatures are given in Additional file 1: Fig. S1

Similar articles

Cited by

References

    1. Kinzler KW, Vogelstein B. Lessons from hereditary colorectal cancer. Cell. 1996;87:159–170. - PubMed
    1. Hanahan D, Weinberg RA. The hallmarks of cancer. Cell. 2000;100:57–70. - PubMed
    1. Stratton MR, Campbell PJ, Futreal PA. The cancer genome. Nature. 2009;458:719–724. - PMC - PubMed
    1. Bozic I, Antal T, Ohtsuki H, Carter H, Kim D, Chen S, et al. Accumulation of driver and passenger mutations during tumor progression. Proc Natl Acad Sci U S A. 2010;107:18545–18550. - PMC - PubMed
    1. Juul RI, Nielsen MM, Juul M, Feuerbach L, Pedersen JS. The landscape and driver potential of site-specific hotspots across cancer genomes. NPJ Genom Med. 2021;6:33. - PMC - PubMed

Publication types