Clinical Trial
. 2023 Aug 16;3(8):1564-1579.
doi: 10.1158/2767-9764.CRC-22-0293. eCollection 2023 Aug.

Activating Inducible T-cell Costimulator Yields Antitumor Activity Alone and in Combination with Anti-PD-1 Checkpoint Blockade

Affiliations
Clinical Trial

Activating Inducible T-cell Costimulator Yields Antitumor Activity Alone and in Combination with Anti-PD-1 Checkpoint Blockade

Sapna Yadavilli et al. Cancer Res Commun. .

Abstract

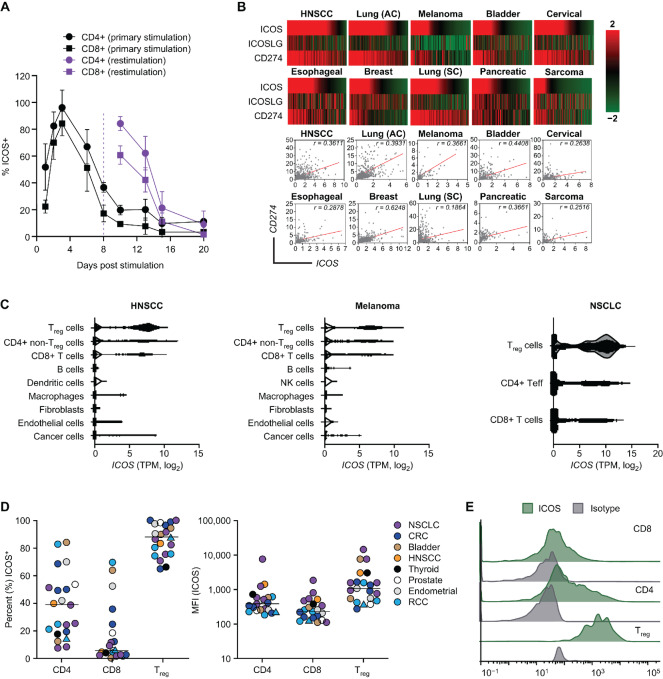
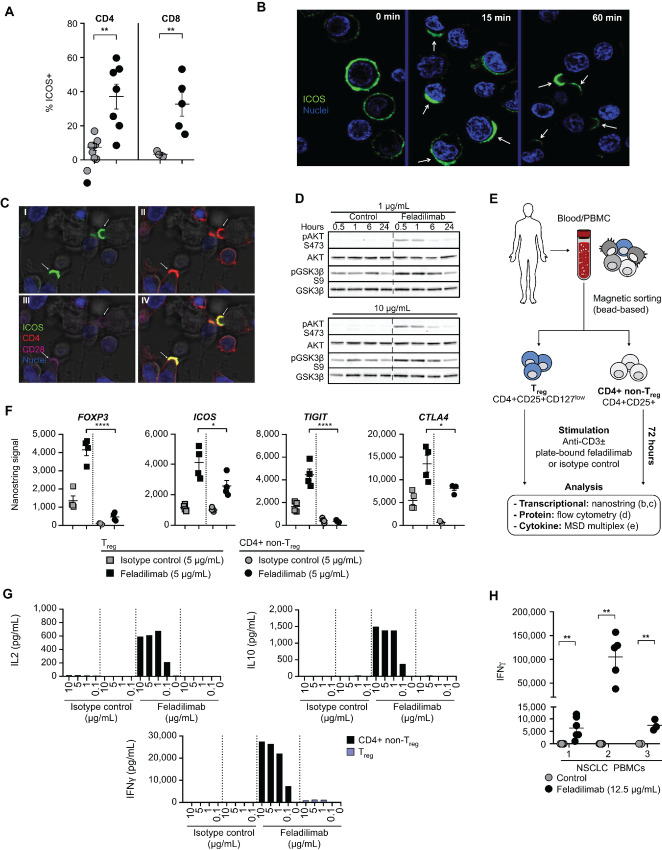
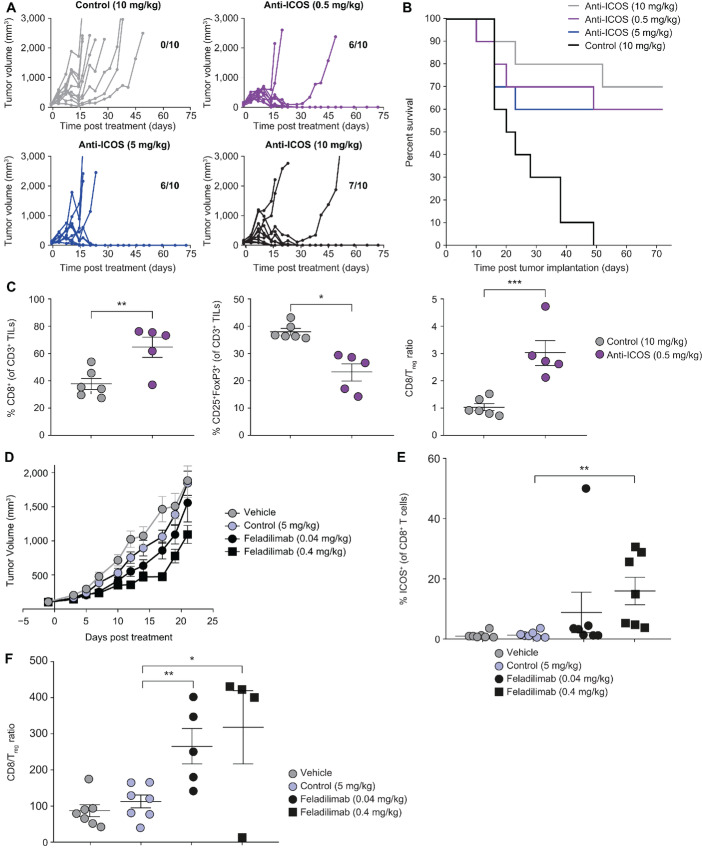
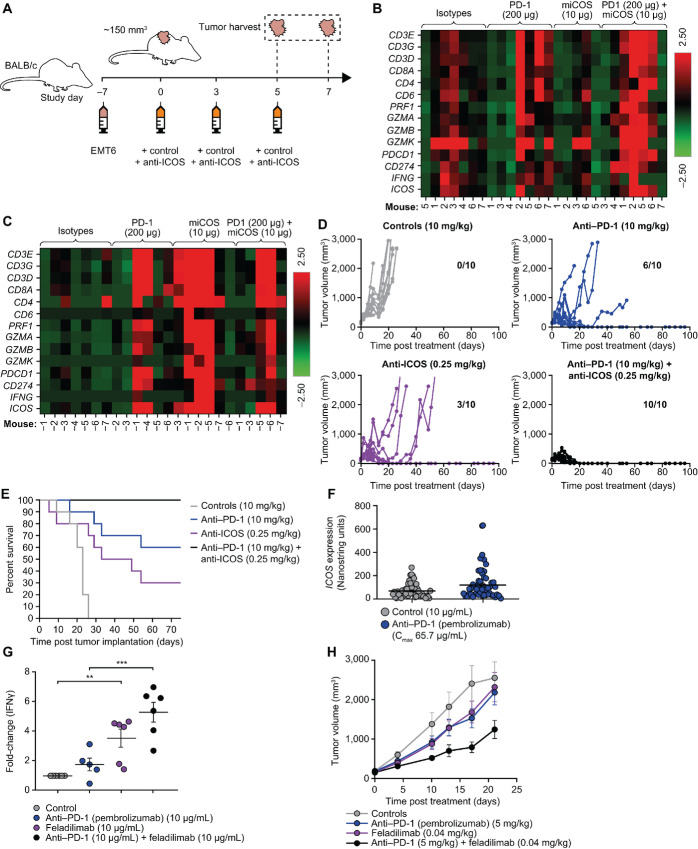
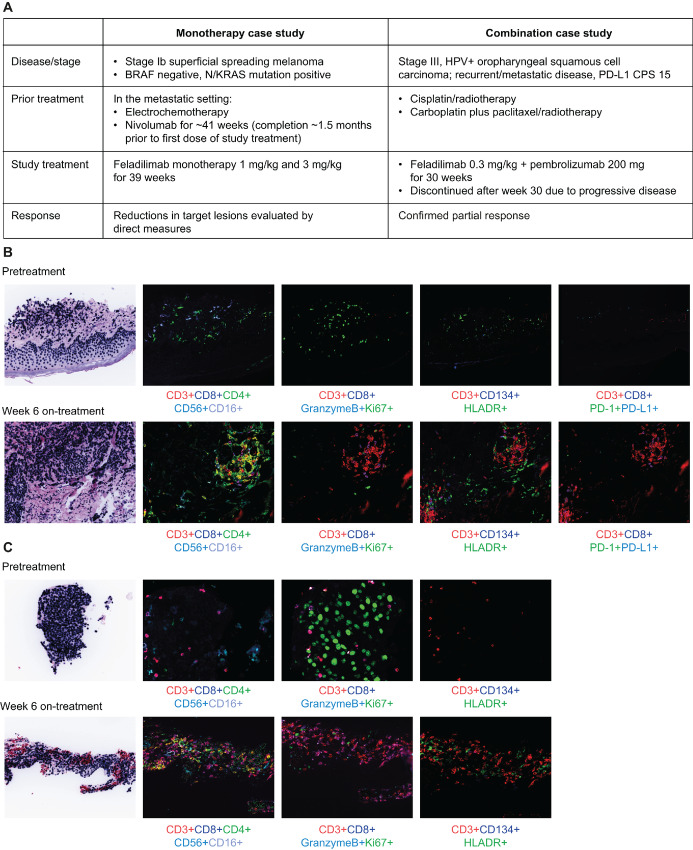
In recent years, there has been considerable interest in mAb-based induction of costimulatory receptor signaling as an approach to combat cancer. However, promising nonclinical data have yet to translate to a meaningful clinical benefit. Inducible T-cell costimulator (ICOS) is a costimulatory receptor important for immune responses. Using a novel clinical-stage anti-ICOS immunoglobulin G4 mAb (feladilimab), which induces but does not deplete ICOS+ T cells and their rodent analogs, we provide an end-to-end evaluation of the antitumor potential of antibody-mediated ICOS costimulation alone and in combination with programmed cell death protein 1 (PD-1) blockade. We demonstrate, consistently, that ICOS is expressed in a range of cancers, and its induction can stimulate growth of antitumor reactive T cells. Furthermore, feladilimab, alone and with a PD-1 inhibitor, induced antitumor activity in mouse and humanized tumor models. In addition to nonclinical evaluation, we present three patient case studies from a first-time-in-human, phase I, open-label, dose-escalation and dose-expansion clinical trial (INDUCE-1; ClinicalTrials.gov: NCT02723955), evaluating feladilimab alone and in combination with pembrolizumab in patients with advanced solid tumors. Preliminary data showing clinical benefit in patients with cancer treated with feladilimab alone or in combination with pembrolizumab was reported previously; with example cases described here. Additional work is needed to further validate the translation to the clinic, which includes identifying select patient populations that will benefit from this therapeutic approach, and randomized data with survival endpoints to illustrate its potential, similar to that shown with CTLA-4 and PD-1 blocking antibodies.

Significance: Stimulation of the T-cell activation marker ICOS with the anti-ICOS agonist mAb feladilimab, alone and in combination with PD-1 inhibition, induces antitumor activity across nonclinical models as well as select patients with advanced solid tumors.


Figures

FIGURE 1
FIGURE 1
ICOS serves as a T-cell activation biomarker. A, Percentage expression of ICOS on T-cell subsets from healthy human donor PBMC following primary stimulation (day 0) and restimulation (day 8) using plate-coated anti-CD3/CD28 and flow cytometry (nonspecific binding was blocked with human or mouse Fc block). Data represent the mean ± SD of n = 4 samples; for gating strategy see Supplementary Fig. S1. B, TCGA-derived gene expression analysis of ICOS, ICOSLG (ICOS-LG), and PD-L1 (CD274) and Pearson correlation (r) analysis of ICOS versus PD-L1 (CD274) in different tumor types. Expression values were obtained from TCGA RNA-seq analysis. For heat map visualization, gene expression values obtained from TCGA were normalized within each indication using robust center scaling. Pearson correlation, significance, and number of tumors analyzed per indication can be found in Supplementary Table S5. Tumors were sorted on the basis of ICOS mRNA expression values from high to low. C, Violin plots showing expression of ICOS (log2 TPM) in various T-cell subsets from HNSCC, melanoma, and NSCLC RNA-seq data sets (26–28). D and E, ICOS expression on freshly dissociated patient TILs using flow cytometry (nonspecific binding was blocked with human or mouse Fc block). D, Mean fluorescence intensity (log10 MFI) of ICOS on individual T-cell populations. Median ICOS expression for each population is indicated by the horizontal bar with each symbol representing an individual patient (n = 1–6 samples/cancer type). For raw data and gating strategy, please see Supplementary Table S2 and Supplementary Fig. S2. E, Histograms of ICOS expression and isotype control on tumor-infiltrating T cells from a representative patient with colorectal cancer. AC, adenocarcinoma (LUAD); CRC, colorectal cancer; HNSCC, head and neck squamous cell carcinoma; ICOS, inducible T cell costimulator; NSCLC, non–small-cell lung carcinoma; PBMC, primary human peripheral blood mononuclear cells; PD-L1, programmed death ligand-1; RCC, renal cell carcinoma; SC, squamous cell (LUSC); TCGA, The Cancer Genome Atlas; TIL, tumor-infiltrating lymphocyte.
FIGURE 2
FIGURE 2
In vitro functional characteristics of antihuman ICOS agonist mAb feladilimab. A, Detection of ICOS on naïve or preactivated (48 hours anti-CD3/CD28) peripheral blood T cells from healthy human donors using feladilimab (3 μg/mL, soluble) and subsequent FITC-conjugated anti-human IgG secondary antibody. Each symbol represents an individual donor. See Supplementary Fig. S1 for flow cytometry gating strategy. Confocal microscopy illustrating kinetics of ICOS cellular localization using feladilimab (3 μg/mL, soluble) as the antibody for staining (B) and T cell–DC interactions following coincubation with feladilimab and CD3/CD28 (C). C, Stimulated T cells exhibit ICOS polarization and mobilization toward neighboring DCs (dark), localizing with related costimulatory receptor CD28; (I–III) denote image overlays, with (IV) combining all markers. D, Representative Western blot analyses of AKT pathway phosphorylation in activated CD4+ T cells following treatment with soluble feladilimab or isotype control (1 and 10 μg/mL, soluble) for 0–24 hours; uncropped images available in Supplementary Fig. S12A. As illustrated in E, CD4+ non-Treg (CD4+ CD25) and Treg cells (CD4+ CD25+ CD127low) were isolated from healthy donor peripheral blood and stimulated using plate-bound anti-CD3 (1 μg/mL) ± feladilimab or isotype control (each at 5 μg/mL) for 72 hours. F, RNA-based analysis (Nanostring) of Treg-associated marker (FOXP3, ICOS, TIGIT, and CTLA4) expression by the stimulated cell subsets (each symbol represents an individual donor). G, Cytokine-based analysis of T-cell subsets following stimulation with plate-bound anti-CD3 and a dose range of feladilimab or isotype control; see Supplementary Fig. S1 for gating strategy. H, IFNγ production in the supernatant of PBMC cultures from patients with NSCLC following plate-bound feladilimab and anti-CD3 (0.6 μg/mL) stimulation (24 and 48 hours for healthy donors; 72 hours for patients with NSCLC). Data in A and H represent the mean ± s.e.m; significance determined by unpaired Student t test. Where shown, significance was determined by one-way ANOVA. AKT, protein kinase B; Fc, fragment crystallizable; ANOVA, analysis of variance; DC, dendritic cell; ICOS, inducible T cell costimulator; IFN, interferon; Ig, immunoglobulin; mAB, monoclonal antibody; NSCLC, non–small cell lung carcinoma; PBMC, peripheral blood mononuclear cells; s.e.m., standard error of the mean.
FIGURE 3
FIGURE 3
ICOS agonist mAbs demonstrate single-agent antitumor activity. A–C, EMT6 (subcutaneous) tumor-bearing BALB/c mice were administered intraperitoneally biweekly with anti-mouse ICOS mAb [7E.17G9 (mIgG1)] or isotype control (mIgG1) for a total of six doses and evaluated for tumor growth (A), survival (B), and pharmacodynamic changes (C) within tumors. Each line in A represents an individual mouse (n = 10/group). Number of tumor-free mice at study termination are indicated within each subpanel. B, Kaplan–Meier plot illustrating OS in A. C, Percentage of tumor-infiltrating CD8+ T cells, Treg cells, and associated CD8:Treg cell ratio 48 hours after the third dose of anti-ICOS mAb (10 μg, ∼study day 7) assessed using flow cytometry (nonspecific binding was blocked with human or mouse Fc block). Each symbol represents an individual mouse. D–F, A549 (subcutaneous) tumor-bearing NSG mice were administered intraperitoneally biweekly with feladilimab or isotype control for a total of six doses. D, A549 tumor growth kinetics for controls (PBS or isotype) and feladilimab-treated groups (0.04 mg/kg, black; 0.4 mg/kg, red). Percentage of tumor-infiltrating ICOS+ CD8+ T cells (E; assessed using flow cytometry with nonspecific binding blocked using human or mouse Fc block) and associated CD8:Treg cell ratio (F) 48 hours after the fourth dose of feladilimab (∼study day 21). Data in C, D, E, and F represent the mean ± s.e.m. Significance was determined by unpaired Student t test. See Supplementary Fig. S1 for flow cytometry gating strategy for C, E, and F. CD8/Treg ratios were calculated on the basis of percent (%) positive CD8s (of live CD45+) and FoxP3/CD25+ Treg cells (of live CD45+ CD4+ cells). ICOS, inducible T-cell costimulator; i.p., intraperitoneal injection; mAb, monoclonal antibody; OS, overall survival; s.e.m., standard error of the mean.
FIGURE 4
FIGURE 4
ICOS agonist mAbs demonstrate improved antitumor activity in combination with PD-1 blockade. EMT6 (subcutaneous) tumor-bearing BALB/c mice were administered intraperitoneally biweekly with anti-mouse ICOS mAb [7E.17G9 (mIgG1)], anti-PD-1 mAb (RMP1-14), or isotype controls (mIgG1 and rat IgG2a, respectively) alone and in combination for a total of six doses. Mice were evaluated for pharmacodynamic changes (B and C) within tumors, tumor growth (D), and survival (E). As illustrated in A, transcriptional analysis was performed (n = 5–7) on tumor tissue harvested from mice 48 hours after second (B) and third doses (C) of indicated mAbs; raw data in Supplementary Table S4. Each line in D represents an individual mouse (n = 10/group). Tumor-free mice at study termination are indicated within each subpanel. E, Kaplan–Meier plot illustrating OS in D. F,ICOS expression following ex vivo anti–PD-1 (pembrolizumab) or vehicle control treatment of tumor slices from patients with HNSCC for 48 hours. Each symbol represents an individual human tumor sample (n = 50/group). G, Fold change in IFNγ production by TILs from dissociated NSCLC tumor samples (n = 5–6 samples/group) following exposure to anti-CD3 (plate-bound, 0.6 μg/mL) in concert with anti-PD-1 (pembrolizumab, soluble) or feladilimab (plate-bound) alone or in combination for 24 hours. H, A2058 (subcutaneous) tumor-bearing NSG mice were administered intraperitoneally biweekly with feladilimab and anti-PD-1 (pembrolizumab) alone or in combination for a total of six doses and assessed for tumor growth inhibition (n = 10/group). Data in F–H are represented as mean ± s.e.m. Significance in G determined by unpaired Student t test. Despite trends in tumor growth kinetics following combination treatment, the curves in H were not significantly different as determined by one-way ANOVA. ANOVA, analysis of variance; HNSCC, head and neck squamous cell carcinoma; ICOS, inducible T cell costimulator; IFN, interferon; i.p., intraperitoneal injection; mAb, monoclonal antibody; NSCLC, non–small cell lung carcinoma; OS, overall survival; PD-1, programmed cell death protein 1; s.e.m., standard error of the mean; TIL, tumor-infiltrating lymphocyte.
FIGURE 5
FIGURE 5
Clinical patient case studies of feladilimab monotherapy and in combination with pembrolizumab. A, Clinical history and treatment details for a patient with melanoma who received feladilimab monotherapy and a patient with oropharyngeal squamous cell carcinoma who received feladilimab in combination with pembrolizumab. Tumor sample immunohistochemistry and expression of markers for TIL activation, cytotoxic function and proliferation for the monotherapy case study (B) and the combination therapy case study (C). See Supplementary Fig. S11B for CT imaging of tumor lesions for the patient with oropharyngeal squamous cell carcinoma. CPS, combined positive score; CT, computed tomography; HLA-DR, human leukocyte antigen-DR; HPV, human papillomavirus; PD-L1, programmed death ligand-1; TIL, tumor-infiltrating lymphocyte.

References

    1. Li X, Shao C, Shi Y, Han W. Lessons learned from the blockade of immune checkpoints in cancer immunotherapy. J Hematol Oncol 2018;11:31. - PMC - PubMed
    1. Mayes PA, Hance KW, Hoos A. The promise and challenges of immune agonist antibody development in cancer. Nat Rev Drug Discov 2018;17:509–27. - PubMed
    1. Hoos A. Development of immuno-oncology drugs—from CTLA4 to PD1 to the next generations. Nat Rev Drug Discov 2016;15:235–47. - PubMed
    1. Hargadon KM, Johnson CE, Williams CJ. Immune checkpoint blockade therapy for cancer: an overview of FDA-approved immune checkpoint inhibitors. Int Immunopharmacol 2018;62:29–39. - PubMed
    1. Chen DS, Mellman I. Oncology meets immunology: the cancer-immunity cycle. Immunity 2013;39:1–10. - PubMed

Publication types

Associated data