

Aetiology of Type 2 diabetes in people with a 'normal' body mass index: testing the personal fat threshold hypothesis
- PMID: 37593846
- PMCID: PMC10472166
- DOI: 10.1042/CS20230586
Aetiology of Type 2 diabetes in people with a 'normal' body mass index: testing the personal fat threshold hypothesis
Abstract
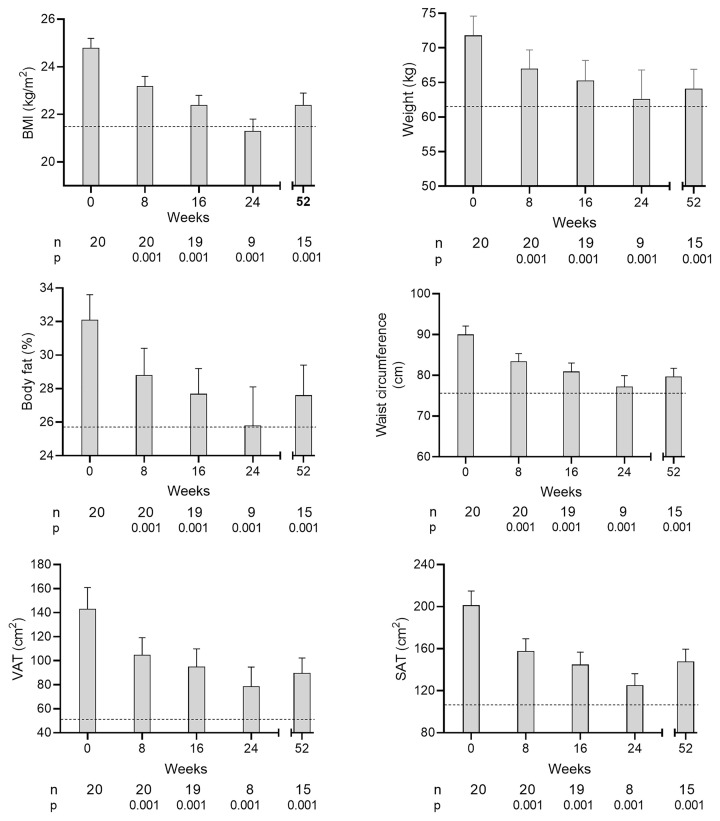
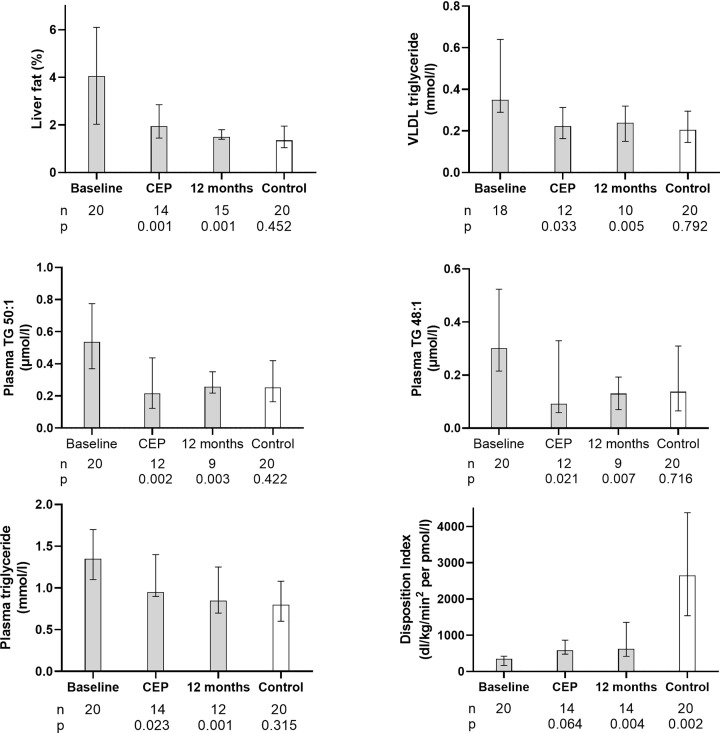
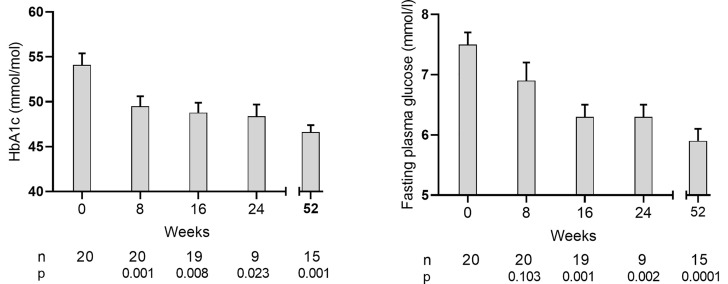
Weight loss in overweight or obese individuals with Type 2 diabetes (T2D) can normalize hepatic fat metabolism, decrease fatty acid oversupply to β cells and restore normoglycaemia. One in six people has BMI <27 kg/m2 at diagnosis, and their T2D is assumed to have different aetiology. The Personal Fat Threshold hypothesis postulated differing individual thresholds for lipid overspill and adverse effects on β-cell function. To test this hypothesis, people with Type 2 diabetes and body mass index <27kg/m2 (n = 20) underwent repeated 5% weight loss cycles. Metabolic assessments were carried out at stable weight after each cycle and after 12 months. To determine how closely metabolic features returned to normal, 20 matched normoglycemic controls were studied once. Between baseline and 12 months: BMI fell (mean ± SD), 24.8 ± 0.4 to 22.5 ± 0.4 kg/m2 (P<0.0001) (controls: 21.5 ± 0.5); total body fat, 32.1 ± 1.5 to 27.6 ± 1.8% (P<0.0001) (24.6 ± 1.5). Liver fat content and fat export fell to normal as did fasting plasma insulin. Post-meal insulin secretion increased but remained subnormal. Sustained diabetes remission (HbA1c < 48 mmol/mol off all glucose-lowering agents) was achieved by 70% (14/20) by initial weight loss of 6.5 (5.5-10.2)%. Correction of concealed excess intra-hepatic fat reduced hepatic fat export, with recovery of β-cell function, glycaemic improvement in all and return to a non-diabetic metabolic state in the majority of this group with BMI <27 kg/m2 as previously demonstrated for overweight or obese groups. The data confirm the Personal Fat Threshold hypothesis: aetiology of Type 2 diabetes does not depend on BMI. This pathophysiological insight has major implications for management.
Keywords: de novo lipogenesis; hepatic steatosis; remission; triglyceride; type 2 diabetes; weight loss.
© 2023 The Author(s).
Conflict of interest statement
R.T. reports grants from Diabetes UK, lecture fees from Novartis, Lilly and Jansen during the conduct of the study and is a member of the NHS England Advisory Board for the Type 2 Diabetes Path to Remission Programme. He was a member of the ADA/EASD/DUK Consensus Group for the Definition of Type 2 Diabetes Remission. C.L.M. is supported by the Diabetes UK Harry Keen Intermediate Clinical Fellowship (DUK-HKF 17/0005712) and the European Foundation for the Study of Diabetes - Novo Nordisk Foundation Future Leaders' Award (NNF19SA058974). AK and B.J. are supported by the National Institute for Health Research (NIHR) Cambridge Biomedical Research Centre (BRC) and the core metabolomic and lipidomic laboratory (CMAL). R.R.H reports research support from AstraZeneca, Bayer, and MSD; and personal fees from Anji Pharmaceuticals, Bayer, Novartis, and Novo Nordisk. All other authors declare no competing interests. R.T. is the guarantor of this work and takes full responsibility for the integrity of the data and the accuracy of the data analysis.
Figures
References
-
- Federation ID (2021) IDF Diabetes Atlas. Available from: https://diabetesatlas.org/atlas/tenth-edition. Accessed 24 Aug 2023.
-
- NICE (2022) Type 2 diabetes in adults: management. Available from: https://www.nice.org.uk/guidance/ng28. Accessed 12 Dec 2022.
Publication types
MeSH terms
Grants and funding
LinkOut - more resources
Full Text Sources
Medical