. 2023 Aug;12(8):e12345.
doi: 10.1002/jev2.12345.

ApoE expression in macrophages communicates immunometabolic signaling that controls hyperlipidemia-driven hematopoiesis & inflammation via extracellular vesicles

Affiliations

ApoE expression in macrophages communicates immunometabolic signaling that controls hyperlipidemia-driven hematopoiesis & inflammation via extracellular vesicles

Tuan Anh Phu et al. J Extracell Vesicles. 2023 Aug.

Erratum in

Abstract

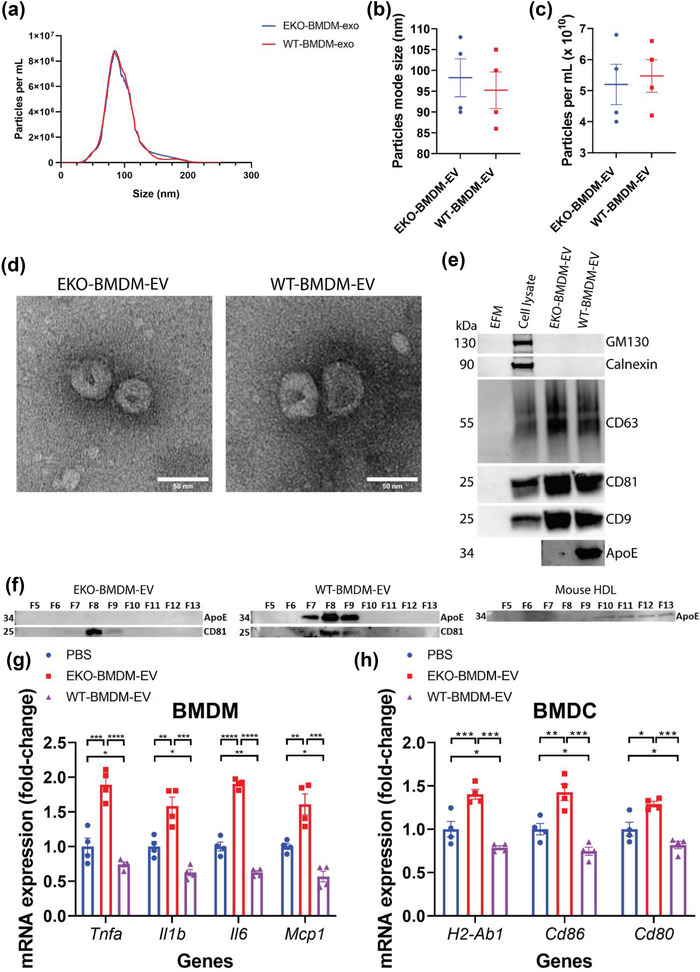
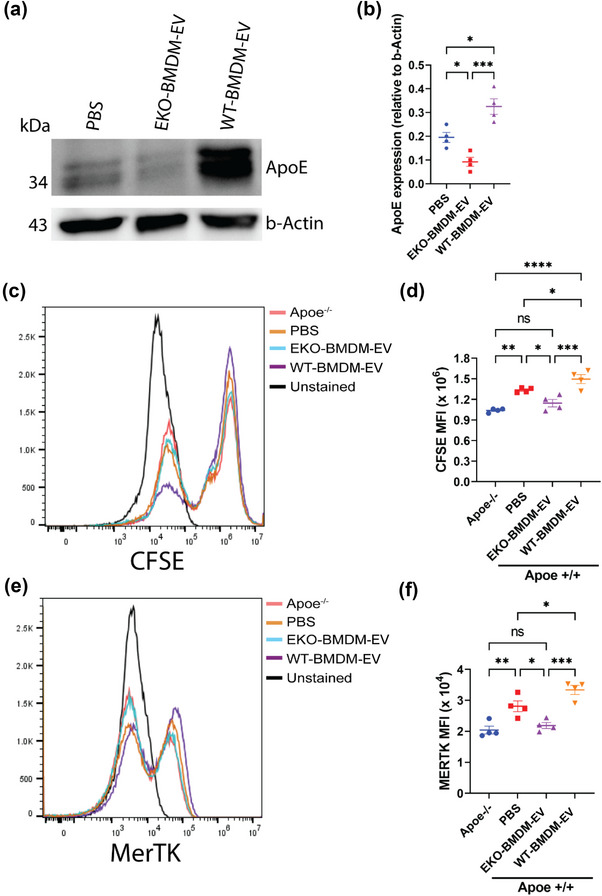
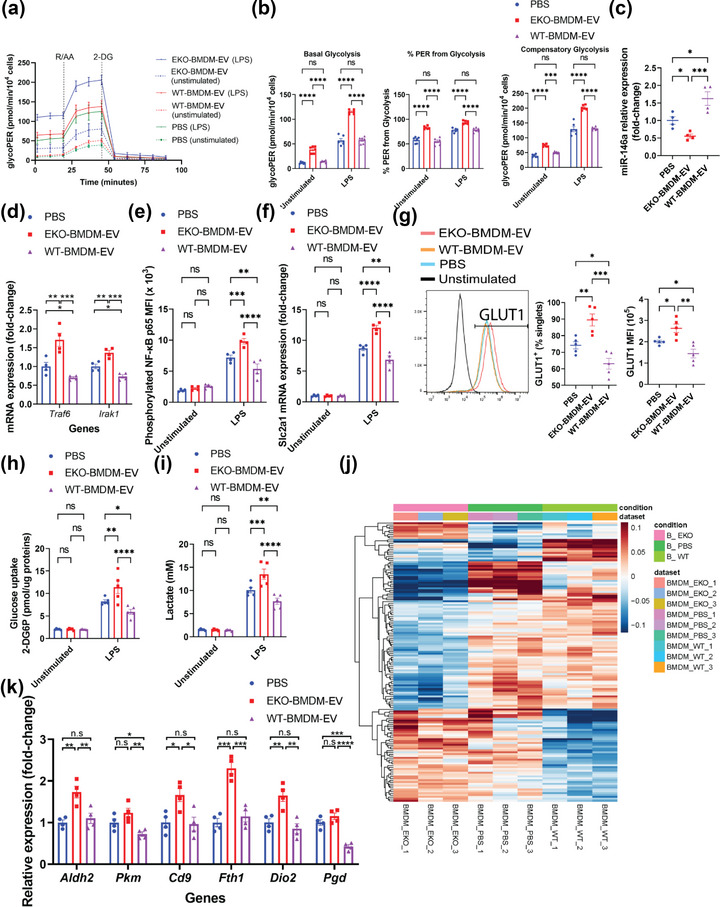
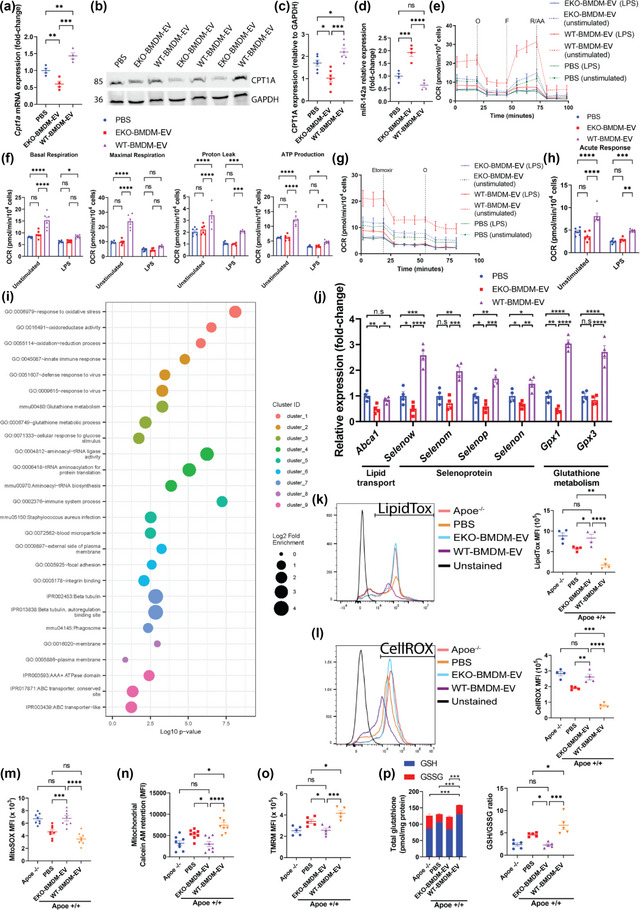
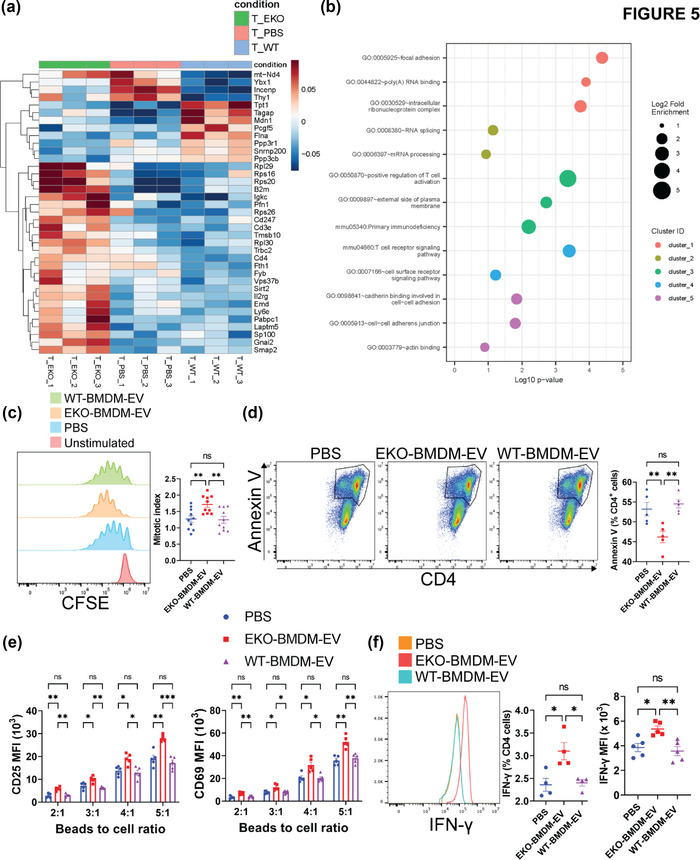
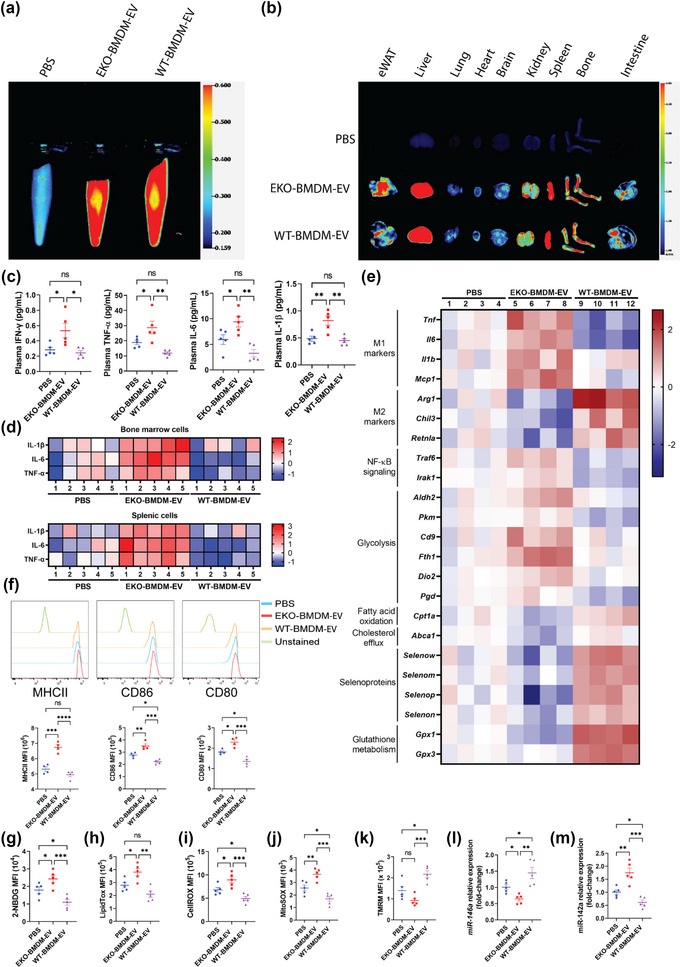
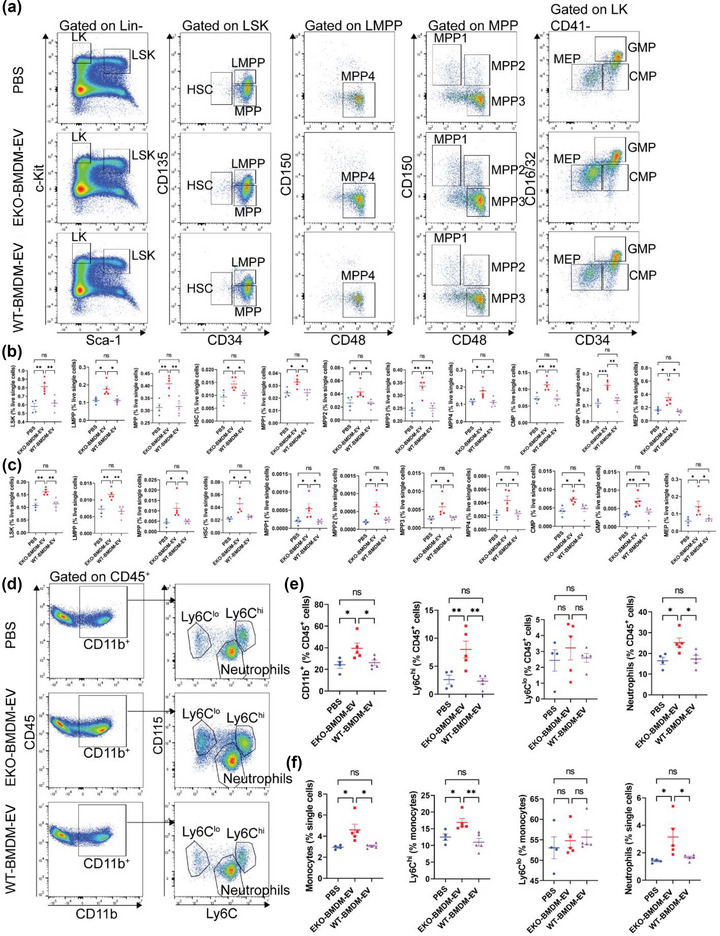
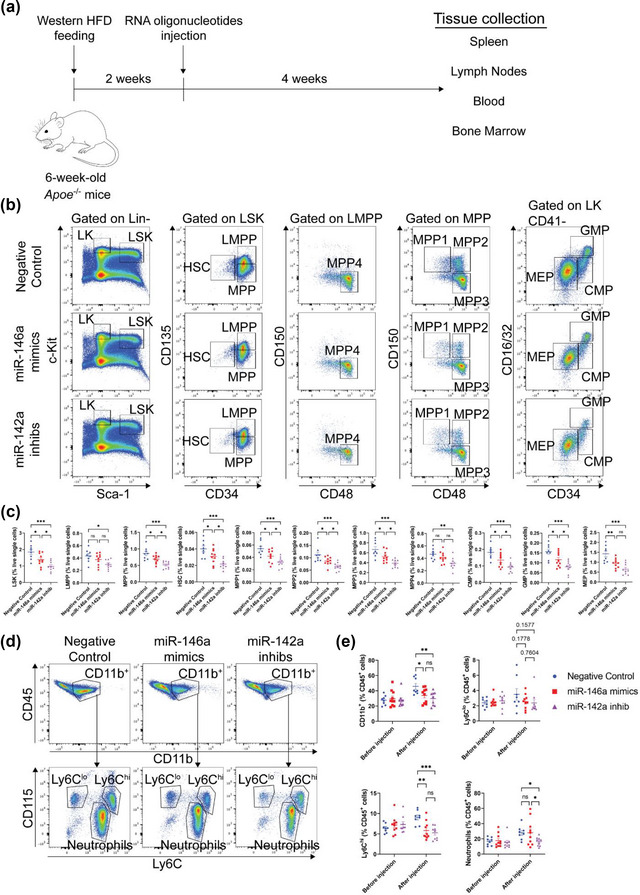
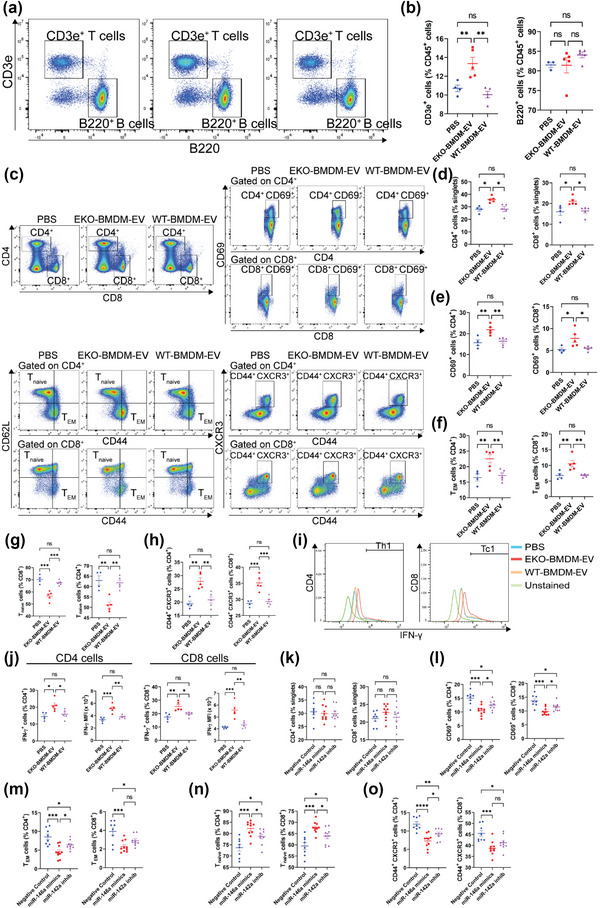
While apolipoprotein E (apoE) expression by myeloid cells is recognized to control inflammation, whether such benefits can be communicated via extracellular vesicles is not known. Through the study of extracellular vesicles produced by macrophages derived from the bone marrow of Wildtype (WT-BMDM-EV) and ApoE deficient (EKO-BMDM-EV) mice, we uncovered a critical role for apoE expression in regulating their cell signaling properties. WT-BMDM-EV communicated anti-inflammatory properties to recipient myeloid cells by increasing cellular levels of apoE and miR-146a-5p, that reduced NF-κB signalling. They also downregulated cellular levels of miR-142a-3p, resulting in increased levels of its target carnitine palmitoyl transferase 1A (CPT1A) which improved fatty acid oxidation (FAO) and oxidative phosphorylation (OxPHOS) in recipient cells. Such favorable metabolic polarization enhanced cell-surface MerTK levels and the phagocytic uptake of apoptotic cells. In contrast, EKO-BMDM-EV exerted opposite effects by reducing cellular levels of apoE and miR-146a-5p, which increased NF-κB-driven GLUT1-mediated glucose uptake, aerobic glycolysis, and oxidative stress. Furthermore, EKO-BMDM-EV increased cellular miR-142a-3p levels, which reduced CPT1A levels and impaired FAO and OxPHOS in recipient myeloid cells. When cultured with naïve CD4+ T lymphocytes, EKO-BMDM-EV drove their activation and proliferation, and fostered their transition to a Th1 phenotype. While infusions of WT-BMDM-EV into hyperlipidemic mice resolved inflammation, infusions of EKO-BMDM-EV increased hematopoiesis and drove inflammatory responses in myeloid cells and T lymphocytes. ApoE-dependent immunometabolic signaling by macrophage extracellular vesicles was dependent on transcriptional axes controlled by miR-146a-5p and miR-142a-3p that could be reproduced by infusing miR-146a mimics & miR-142a antagonists into hyperlipidemic apoE-deficient mice. Together, our findings unveil a novel property for apoE expression in macrophages that modulates the immunometabolic regulatory properties of their secreted extracellular vesicles.

Keywords: ApoE; extracellular vesicles; immunometabolism; inflammation; macrophage; microRNA; oxidative stress.


Conflict of interest statement

There is no conflict of interest in writing this manuscript.

Figures

FIGURE 1
FIGURE 1
Biophysical parameters and immune‐modulation effects of BMDM‐derived extracellular vesicles. (a) Representative concentration and size distributions of EKO‐BMDM‐EV & WT‐BMDM‐EV purified from BMDM cell culture supernatants after a 24 h period of culture as determined using nanoparticle tracking analysis. (b and c) Average mode of particle diameter (b) and concentration of purified EVs in particles/mL (c) (n = 4 samples per group). (d) Electron micrograph of purified EVs from BMDM. Scale bar: 50 nm. (e) Western blot analysis of Calnexin, GM130, CD9, CD63, CD81, and apoE in EV‐free media (EFM), cell lysate, and 1.5 × 10⁹ particles of BMDM‐derived EVs (representative of three independent experiments). (f) Western blot analysis of apoE and CD81 in EKO‐BMDM‐EV, WT‐BMDM‐EV, and mouse HDL fractionated by size‐exclusion chromatography. (g) qRT‐PCR analysis of Tnf, Il1b, Mcp1, and Il6 mRNA expression in wildtype BMDM exposed to 2 × 10⁹ particles of EKO‐BMDM‐EV, WT‐BMDM‐EV, or PBS for 18 h and stimulated with LPS (100 ng/mL) for 6 h. qRT‐PCR results were normalized to B2m or Gapdh, one representative experiment out of three independent replicates is shown; n = 4 per group. (h) qRT‐PCR analysis of H2‐Ab1, Cd86, and Cd80 mRNA expression in wildtype BMDM exposed to 2 × 10⁹ particles of EKO‐BMDM‐EV, WT‐BMDM‐EV, or PBS for 18 h and stimulated with LPS (100 ng/mL) for 6 h. qRT‐PCR results were normalized to B2m or Gapdh, one representative experiment out of three independent replicates is shown; n = 4 per group. *p < 0.05, **p < 0.01, ***p < 0.001, and ****p < 0.0001 as determined using one‐way ANOVA followed by Holm‐Sidak post‐test. Data are presented as mean ± SEM.
FIGURE 2
FIGURE 2
Macrophage EVs modulate cellular apoE protein levels and the phagocytic capacity of recipient macrophages. (a‐b) Western blot analysis (a) and quantification (b) of ApoE protein levels in cell lysates of wildtype BMDM exposed to 2 × 10⁹ particles of EKO‐BMDM‐EV, WT‐BMDM‐EV, or PBS for 18 h. (c,d) Representative histogram (c) and quantitative graph (d) showing MFI of CFSE‐labeled apoptotic Jurkat cells uptake in Apoe −/− BMDM or wildtype BMDM exposed to 2 × 10⁹ particles of EKO‐BMDM‐EV, WT‐BMDM‐EV, or PBS for 18 h measured by flow cytometry. (e,f) Representative histogram (e) and quantitative graph (f) showing MFI of MERTK surface expression in Apoe −/− BMDM or wildtype BMDM exposed to 2 × 10⁹ particles of EKO‐BMDM‐EV, WT‐BMDM‐EV, or PBS for 18 h measured by flow cytometry. One representative experiment out of two independent replicates is shown for all experiments; n = 4 per group. *p < 0.05, **p < 0.01, ***p < 0.001, and ****p < 0.0001 as determined using one‐way ANOVA followed by Holm‐Sidak post‐test. Data are presented as mean ± SEM.
FIGURE 3
FIGURE 3
ApoE expression dictates the capacity for macrophage EVs to suppress glucose uptake and glycolysis in recipient macrophages via a miR‐146a/NF‐κB axis. (a) Graph showing representative Seahorse Glycolytic Rate Assay. R/AA, rotenone/antimycin A (0.5 μM) and 2‐DG, 2‐Deoxy‐D‐glucose (50 mM). (b) Graph showing quantified cell‐normalized glycolysis‐associated proton efflux rate (glycoPER) from the Seahorse Glycolytic Rate Assay. (c) qRT‐PCR analysis of miR‐146a‐5p expression in wildtype BMDM exposed to 2 × 10⁹ particles of EKO‐BMDM‐EV, WT‐BMDM‐EV, or PBS for 18 h. (d) qRT‐PCR analysis of Irak1 and Traf6 mRNA levels in wildtype BMDM exposed to 2 × 10⁹ particles of EKO‐BMDM‐EV, WT‐BMDM‐EV, or PBS for 18 h and subsequently stimulated with LPS (100 ng/mL) for 6 h. (e) MFI of nuclear NF‐κB phospho‐p65 subunit measured by flow cytometry in wildtype BMDM exposed to 2 × 10⁹ particles of EKO‐BMDM‐EV, WT‐BMDM‐EV, or PBS for 18 h and subsequently cultured in basal or LPS‐stimulated condition (100 ng/mL) for 6 h. (f) qRT‐PCR analysis of Slc2a1 mRNA expression in wildtype BMDM exposed to 2×10⁹ particles of EKO‐BMDM‐EV, WT‐BMDM‐EV, or PBS for 18 h and subsequently cultured in basal or LPS‐stimulated condition (100 ng/mL) for 6 h. (g) Graphs showing percentage of GLUT1+ cells and mean fluorescent intensity (MFI) of GLUT1 in wildtype BMDM exposed to 2×10⁹ particles of EKO‐BMDM‐EV, WT‐BMDM‐EV, or PBS for 18 h and subsequently stimulated with LPS (100 ng/mL) for 6 h. (h) 2‐DG uptake assay in wildtype BMDM exposed to 2 × 10⁹ particles of EKO‐BMDM‐EV, WT‐BMDM‐EV, or PBS for 18 h and subsequently cultured in basal or LPS‐stimulated condition (100 ng/mL) for 6 h. (i) Lactate production to the conditioned media by wildtype BMDM exposed to 2×10⁹ particles of EKO‐BMDM‐EV, WT‐BMDM‐EV, or PBS for 18 h and subsequently cultured in basal or LPS‐stimulated condition (100 ng/mL) for 6 h as measured by the L‐Lactate Assay Kit. (j) Unannotated heatmap showing the distinct mRNA expression profiles between wildtype BMDM exposed to 2 × 10⁹ particles of EKO‐BMDM‐EV, WT‐BMDM‐EV, or PBS for 18 h (n = 3 per group, p <0.05). (k) qRT‐PCR analysis of Aldh2, Pkm, Cd9, Fth1, Dio2, and Pgd mRNA expression in wildtype BMDM exposed to 2 × 10⁹ particles of EKO‐BMDM‐EV, WT‐BMDM‐EV, or PBS for 18 h. qRT‐PCR results were normalized to B2m or Gapdh for mRNA analysis and U6 snRNA or miR‐16‐5p for microRNA analysis. One representative experiment out of three independent replicates is shown for all experiments; n = 3–5 per group. *p < 0.05, **p < 0.01, ***p < 0.001, and ****p < 0.0001 as determined using one‐way or two‐way ANOVA followed by Holm‐Sidak post‐test. Data are presented as mean ± SEM.
FIGURE 4
FIGURE 4
ApoE expression dictates the capacity for macrophage EVs to improve mitochondrial health & functions while suppressing neutral lipids accumulation & oxidative stress in recipient macrophages. (a) qRT‐PCR analysis of Cpt1a mRNA expression in wildtype BMDM exposed to 2 × 10⁹ particles of EKO‐BMDM‐EV, WT‐BMDM‐EV, or PBS for 18 h. (b‐c) Western blot analysis (b) and quantification (c) of CPT1A protein levels in cell lysates of wildtype BMDM exposed to 2 × 10⁹ particles of EKO‐BMDM‐EV, WT‐BMDM‐EV, or PBS for 18 h. (d) qRT‐PCR analysis of miR‐142a‐3p expression in wildtype BMDM exposed to 2 × 10⁹ particles of EKO‐BMDM‐EV, WT‐BMDM‐EV, or PBS for 18 h. (e) Graph showing representative Seahorse Mito Stress Assay. O, oligomycin (1 μM); F, FCCP (2 μM); and R/AA, rotenone/antimycin A (0.5 μM). (f) Graph showing quantified cell‐normalized mitochondrial OCR from Mito Stress test. (g) Graph showing representative OCR measurement in response to etomoxir treatment as measured by the Agilent Seahorse instrument. Etomoxir (4 μM) and O, oligomycin (1 μM). (h) Graph showing quantified cell‐normalized mitochondrial OCR drop upon CPT1a inhibition by etomoxir. (i) GO enrichment analysis (Biological process) of the genes differentially expressed between wildtype BMDM exposed to EKO‐BMDM‐EV or WT‐BMDM‐EV. The minimum count of genes considered for the analysis was >10 and p <0.05. (j) qRT‐PCR analysis of Abca1, Selenow, Selenom, Selenop, Selenon, Gpx1 and Gpx3 mRNA expression in wildtype BMDM exposed to 2×10⁹ particles of EKO‐BMDM‐EV, WT‐BMDM‐EV, or PBS for 18 h. (k) Graph showing MFI of LipidTOX staining measured by flow cytometry in Apoe −/− BMDM or wildtype BMDM exposed to 2×10⁹ particles of EKO‐BMDM‐EV, WT‐BMDM‐EV, or PBS for 18 h measured by flow cytometry. (l) Graph showing MFI of CellROX staining measured by flow cytometry in Apoe −/− BMDM or wildtype BMDM exposed to 2 × 10⁹ particles of EKO‐BMDM‐EV, WT‐BMDM‐EV, or PBS for 18 h measured by flow cytometry. (m‐o) Graphs showing MFI of MitoSOX (m), Calcein AM (n), and TMRM (o) signals in Apoe −/− BMDM or wildtype BMDM exposed to 2 × 10⁹ particles of EKO‐BMDM‐EV, WT‐BMDM‐EV, or PBS for 18 h measured by flow cytometry. (p) Graphs showing detection of total glutathione, including reduced glutathione (GSH) and oxidized glutathione (GSSG), in Apoe −/− BMDM or wildtype BMDM exposed to 2 × 10⁹ particles of EKO‐BMDM‐EV, WT‐BMDM‐EV, or PBS for 18 h measured by flow cytometry. qRT‐PCR results were normalized to B2m or Gapdh for mRNA analysis and U6 snRNA or miR‐16‐5p for microRNA analysis. One representative experiment out of three independent replicates is shown for all experiments; n = 3–5 per group. *p < 0.05, **p < 0.01, ***p < 0.001, and ****p < 0.0001 as determined using one‐way or two‐way ANOVA followed by Holm‐Sidak post‐test. Data are presented as mean ± SEM.
FIGURE 5
FIGURE 5
EKO‐BMDM‐EV drive the activation and proliferation of CD4+ T lymphocytes. (a) Heatmap showing the distinct mRNA expression profiles between wildtype CD4+ T lymphocytes exposed to 2 × 10⁹ particles/mL of EKO‐BMDM‐EV, WT‐BMDM‐EV, or PBS for 24 h (n = 3 per group, p < 0.05) while stimulated with αCD3/αCD28 beads. (b) GO enrichment analysis (Biological process) of the genes differentially expressed between wildtype CD4+ T lymphocytes exposed to EKO‐BMDM‐EV or WT‐BMDM‐EV while stimulated with αCD3/αCD28 beads. The minimum count of genes considered for the analysis was >10 and p <0.05. (c) Graphs showing CD4+ T lymphocytes proliferation measured by CFSE labeling of CD4+ T lymphocytes stimulated with αCD3/αCD28 beads for 4 days. 2 × 10⁹ particles/mL of EKO‐BMDM‐EV, WT‐BMDM‐EV, or PBS were added to the culture on day 1 and 3 of the experiment. (d) Graphs showing percentage of Annexin V+ CD4+ T lymphocytes upon stimulation with αCD3/αCD28 beads for 4 days. 2 × 10⁹ particles/mL of EKO‐BMDM‐EV, WT‐BMDM‐EV, or PBS were added to the culture on day 1 and 3 of the experiment. (e) Graphs showing MFI of CD25 and CD69 in CD4+ T cells co‐cultured with αCD3/αCD28 beads, 5 ng/mL of murine IL‐2, and 2 × 10⁹ particles/mL of EKO‐BMDM‐EV, WT‐BMDM‐EV, or PBS for 48 h. (f) Graphs showing IFN‐γ+ cells and IFN‐γ MFI in CD4+ T cells co‐cultured with αCD3/αCD28 beads, 5 ng/mL of murine IL‐2, and 2 × 10⁹ particles/mL of EKO‐BMDM‐EV, WT‐BMDM‐EV, or PBS for 12 h. One representative experiment out of three independent replicates is shown for all experiments; n = 3–5 per group. *p < 0.05, ** p < 0.01, ***p < 0.001, and ****p < 0.0001 as determined using one‐way ANOVA followed by Holm‐Sidak post‐test. Data are presented as mean ± SEM.
FIGURE 6
FIGURE 6
ApoE expression dictates the capacity for macrophage EVs to improve mitochondrial health & functions while suppressing glucose uptake, oxidative stress, activation of myeloid cells & systemic inflammation in hyperlipidemic mice. (a‐b) Images of DiR fluorescence in blood (a) and organs (b) 6 h post‐injection from 8‐week‐old Western diet‐fed AAV8‐PCSK9‐injected mice infused i.p. with PBS as control or 1 × 10¹⁰ particles of EKO‐BMDM‐EV or WT‐BMDM‐EV. (c) Multiplex immunoassay analysis of TNF‐α, IFN‐γ, IL‐6, and IL‐1β from plasma of Western diet‐fed AAV8‐PCSK9‐injected mice repeatedly infused with 1×10¹⁰ particles of EKO‐BMDM‐EV, WT‐BMDM‐EV, or PBS. (d) Heat maps representing multiplex immunoassay analysis of TNF‐α, IL‐6, and IL‐1β cytokines released by LPS‐stimulated splenic and bone marrow cells (100 ng/mL for 6 h) from Western diet‐fed AAV8‐PCSK9‐injected mice repeatedly infused with 1 × 10¹⁰ particles of EKO‐BMDM‐EV, WT‐BMDM‐EV, or PBS. Data are displayed as log2 fold‐change relative to PBS group. (e) Heat map representing qRT‐PCR analysis of Tnf, Il1b, Mcp1, Il6, Arg1, Retnla, Chil3, Traf6, Irak1, Aldh2, Pkm, Cd9, Fth1, Dio2, Pgd, Cpt1a, Abca1, Selenow, Selenom, Selenop, Selenon, Gpx1 and Gpx3 mRNA expression in peritoneal macrophages of Western diet‐fed AAV8‐PCSK9‐injected mice repeatedly infused with 1 × 10¹⁰ particles of EKO‐BMDM‐EV, WT‐BMDM‐EV, or PBS. Data are displayed as log2 fold‐change relative to PBS group. (f) MFI of MHC‐II, CD86, and CD80 expression in splenic Ly6C MHCII+ CD11c+ cells measured by flow cytometry. (g‐k) Graphs showing MFI of 2‐NBDG (g), LipidTOX (h), CellROX (i), MitoSOX (j), and TMRM (k) signals in circulating Ly6Chi monocytes of Western diet‐fed AAV8‐PCSK9‐injected mice repeatedly infused with 1 × 10¹⁰ particles of EKO‐BMDM‐EV, WT‐BMDM‐EV, or PBS. (l‐m) qRT‐PCR analysis of miR‐146a‐5p (l) and miR‐142a‐3p (m) expression in peritoneal macrophages of Western diet‐fed AAV8‐PCSK9‐injected mice repeatedly infused with 1 × 10¹⁰ particles of EKO‐BMDM‐EV, WT‐BMDM‐EV, or PBS. qRT‐PCR results were normalized to B2m or Gapdh for mRNA analysis and U6 snRNA or miR‐16‐5p for microRNA analysis. One representative experiment out of two independent replicates is shown for all experiments; n = 4–5 per group. *p < 0.05, **p < 0.01, ***p < 0.001, and ****p < 0.0001 as determined using one‐way ANOVA followed by Holm‐Sidak post‐test. Data are presented as mean ± SEM.
FIGURE 7
FIGURE 7
EKO‐BMDM‐EV enhance hyperlipidemia‐driven hematopoiesis and myelopoiesis. (a) Representative plots of flow cytometric analyses of hematopoietic stem and progenitor cells in the bone marrow. (b‐c) Graphs showing the percentages of hematopoietic stem and progenitor cell subsets (LSK, LMPP, MPP, MPP1‐4, HSC, CMP, GMP, and MEP) in the bone marrow (b) and spleen (c) of Western diet‐fed AAV8‐PCSK9‐injected mice repeatedly infused with 1 × 10¹⁰ particles of EKO‐BMDM‐EV, WT‐BMDM‐EV, or PBS. (d‐e) Representative flow cytometric analyses of circulating myeloid cells (d) and measurements of myeloid cell subsets (CD11b+ cells, neutrophils, Ly6Chi monocytes, and Ly6Clo monocytes) (e) in the circulation of Western diet‐fed AAV8‐PCSK9‐injected mice repeatedly infused with 1×10¹⁰ particles of EKO‐BMDM‐EV, WT‐BMDM‐EV, or PBS. (f) Flow cytometric analyses of splenic myeloid cell subsets (monocytes, neutrophils, Ly6Chi monocytes, and Ly6Clo monocytes) in the spleen of Western diet‐fed AAV8‐PCSK9‐injected mice repeatedly infused with 1 × 10¹⁰ particles of EKO‐BMDM‐EV, WT‐BMDM‐EV, or PBS. One representative experiment out of two independent replicates is shown for all experiments; n = 5 per group. *p < 0.05, **p < 0.01, ***p < 0.001, and ****p < 0.0001 as determined using one‐way ANOVA followed by Holm‐Sidak post‐test. Data are presented as mean ± SEM.
FIGURE 8
FIGURE 8
Systemic infusions of miR‐146a mimics or miR‐142a antagonists suppress hyperlipidemia‐driven hematopoiesis and monocytosis in Apoe −/− mice. (a) Schematic diagram depicting the injections of RNA oligonucleotides in Western diet‐fed Apoe −/− mice. (b) Representative plots of flow cytometric analyses of hematopoietic stem and progenitor cells in the bone marrow. (c) Graphs showing the percentages of hematopoietic stem and progenitor cell subsets (LSK, LMPP, MPP, MPP1‐4, HSC, CMP, GMP, and MEP) in the bone marrow of Western diet‐fed Apoe −/− mice repeatedly infused with 1 nmol of miR‐146a mimics, miR‐142a inhib, or negative control. (d‐e) Representative flow cytometric analyses of circulating myeloid cells (d) and measurements of myeloid cell subsets (CD11b+ cells, neutrophils, Ly6Chi monocytes, and Ly6Clo monocytes) (e) in the circulation of Western diet‐fed Apoe −/− mice repeatedly infused with 1 nmol of miR‐146a mimics, miR‐142a inhib, or negative control. Pooled data from two independent replicates is shown for all experiments; n = 8–10 per group. *p < 0.05, **p < 0.01, ***p < 0.001, and ****p < 0.0001 as determined using one‐way ANOVA followed by Holm‐Sidak post‐test. Data are presented as mean ± SEM.
FIGURE 9
FIGURE 9
EKO‐BMDM‐EV drive the proliferation, activation, and IFN‐γ release from T lymphocytes of hyperlipidemic mice via the modulation of miR‐146a and miR‐142a levels. (a‐b) Representative flow cytometric analyses of circulating lymphocytes (a) and measurements of lymphocyte subsets (CD3e+ T lymphocytes and B220+ B lymphocytes) (b) in the circulation of Western diet‐fed AAV8‐PCSK9‐injected mice repeatedly infused with 1×10¹⁰ particles of EKO‐BMDM‐EV, WT‐BMDM‐EV, or PBS. (c‐h) Representative flow cytometric analyses of splenic T lymphocytes (c) and measurements of total CD4+ & CD8+ cells (d), CD4+ CD69+ & CD8+ CD69+ cells (e), CD4+ CD44+ CD62L & CD8+ CD44+ CD62L cells (TEM) (f), CD4+ CD44 CD62L+ & CD8+ CD44 CD62L+ cells (Tnaïve) (g), and CD4+ CD44+ CXCR3+ & CD8+ CD44+ CXCR3+ cells (h) in the spleens of Western diet‐fed AAV8‐PCSK9‐injected mice repeatedly infused with 1×10¹⁰ particles of EKO‐BMDM‐EV, WT‐BMDM‐EV, or PBS. (i‐j) Representative flow cytometric analyses of splenic Th1 and Tc1 lymphocytes (i) and measurements of IFN‐γ+ cells and IFN‐γ MFI (j) within the CD4+ and CD8+ T lymphocyte populations derived from Western diet‐fed AAV8‐PCSK9‐injected mice repeatedly infused with 1×10¹⁰ particles of EKO‐BMDM‐EV, WT‐BMDM‐EV, or PBS. One representative experiment out of two independent replicates is shown for all experiments; n = 5 per group. (k‐o) Measurements of total CD4+ & CD8+ cells (k), CD4+ CD69+ & CD8+ CD69+ cells (l), CD4+ CD44+ CD62L & CD8+ CD44+ CD62L cells (m), CD4+ CD44 CD62L+ & CD8+ CD44 CD62L+ cells (n), and CD4+ CD44+ CXCR3+ & CD8+ CD44+ CXCR3+ cells (o) in the lymph nodes of Western diet‐fed Apoe −/− mice repeatedly infused with 1 nmol of miR‐146a mimics, miR‐142a inhib, or negative control. Pooled data from two independent replicates is shown for all experiments; n = 8–10 per group. *p < 0.05, **p < 0.01, ***p < 0.001, and ****p < 0.0001 as determined using one‐way ANOVA followed by Holm‐Sidak post‐test. Data are presented as mean ± SEM.

References

    1. Akiyama, T. E. , Sakai, S. , Lambert, G. , Nicol, C. J. , Matsusue, K. , Pimprale, S. , Lee, Y.‐H. , Ricote, M. , Glass, C. K. , Brewer, H. B , & Gonzalez, F. J., Jr (2002). Conditional disruption of the peroxisome proliferator‐activated receptor gamma gene in mice results in lowered expression of ABCA1, ABCG1, and apoE in macrophages and reduced cholesterol efflux. Molecular and Cellular Biology, 22(8), 2607–2619. - PMC - PubMed
    1. Baitsch, D. , Bock, H. H. , Engel, T. , Telgmann, R. , Müller‐Tidow, C. , Varga, G. , Bot, M. , Herz, J. , Robenek, H. , Von Eckardstein, A. , & Nofer, J.‐R. (2011). Apolipoprotein E induces antiinflammatory phenotype in macrophages. Arteriosclerosis, Thrombosis, and Vascular Biology, 31(5), 1160–1168. - PMC - PubMed
    1. Bjørklund, M. M. , Hollensen, A. K. , Hagensen, M. K. , Dagnæs‐Hansen, F. , Christoffersen, C. , Mikkelsen, J. G. , & Bentzon, J. F. (2014). Induction of atherosclerosis in mice and hamsters without germline genetic engineering. Circulation Research, 114(11), 1684–1689. - PubMed
    1. Boisvert, W. A. , Spangenberg, J. , & Curtiss, L. K. (1995). Treatment of severe hypercholesterolemia in apolipoprotein E‐deficient mice by bone marrow transplantation. Journal of Clinical Investigation, 96(2), 1118–1124. - PMC - PubMed
    1. Boldin, M. P. , Taganov, K. D. , Rao, D. S. , Yang, L. , Zhao, J. L. , Kalwani, M. , Garcia‐Flores, Y. , Luong, M. , Devrekanli, A. , Xu, J. , Sun, G. , Tay, J. , Linsley, P. S. , & Baltimore, D. (2011). miR‐146a is a significant brake on autoimmunity, myeloproliferation, and cancer in mice. Journal of Experimental Medicine, 208(6), 1189–1201. - PMC - PubMed

Publication types