. 2023 Nov 1;32(11):1591-1598.
doi: 10.1158/1055-9965.EPI-23-0066.

Impact on the Volume of Pathology Reports Before and During the COVID-19 Pandemic in SEER Cancer Registries

Affiliations

Impact on the Volume of Pathology Reports Before and During the COVID-19 Pandemic in SEER Cancer Registries

Amina Chtourou et al. Cancer Epidemiol Biomarkers Prev. .

Abstract

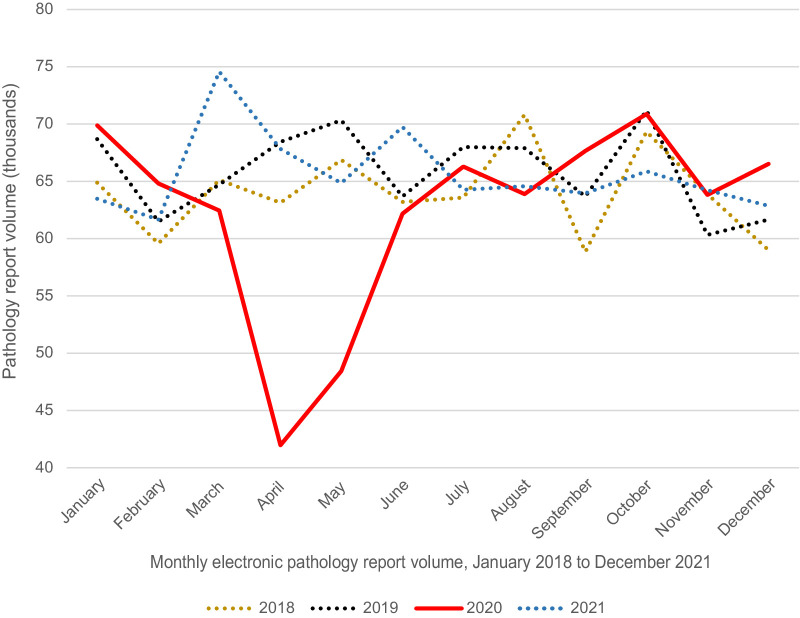
Introduction: Health care procedures including cancer screening and diagnosis were interrupted due to the COVID-19 pandemic. The extent of this impact on cancer care in the United States is not fully understood. We investigated pathology report volume as a reflection of trends in oncology services pre-pandemic and during the pandemic.

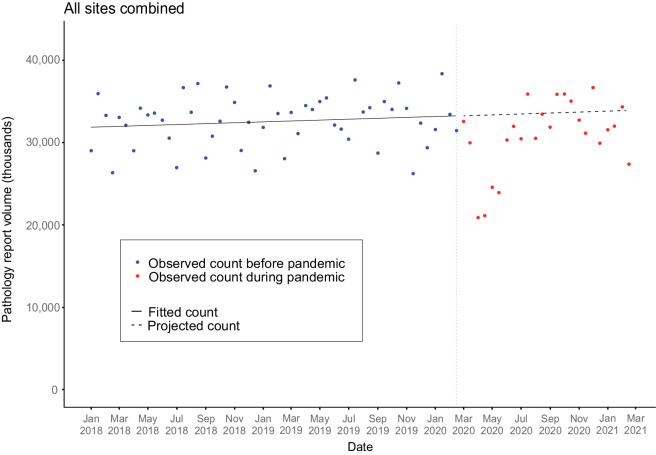
Methods: Electronic pathology reports were obtained from 11 U.S. central cancer registries from NCI's SEER Program. The reports were sorted by cancer site and document type using a validated algorithm. Joinpoint regression was used to model temporal trends from January 2018 to February 2020, project expected counts from March 2020 to February 2021 and calculate observed-to-expected ratios. Results were stratified by sex, age, cancer site, and report type.

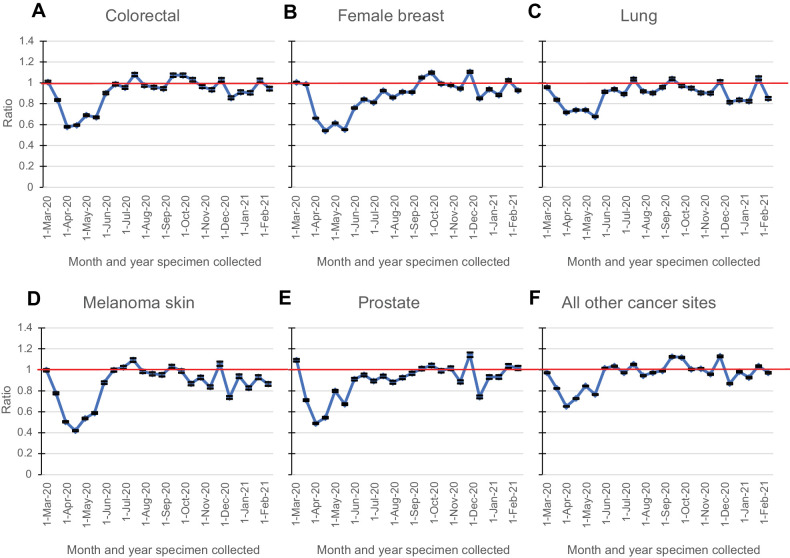
Results: During the first 3 months of the pandemic, pathology report volume decreased by 25.5% and 17.4% for biopsy and surgery reports, respectively. The 12-month O/E ratio (March 2020-February 2021) was lowest for women (O/E 0.90) and patients 65 years and older (O/E 0.91) and lower for cancers with screening (melanoma skin, O/E 0.86; breast, O/E 0.88; lung O/E 0.89, prostate, O/E 0.90; colorectal, O/E 0.91) when compared with all other cancers combined.

Conclusions: These findings indicate a decrease in cancer diagnosis, likely due to the COVID-19 pandemic. This decrease in the number of pathology reports may result in a stage shift causing a subsequent longer-term impact on survival patterns.

Impact: Investigation on the longer-term impact of the pandemic on pathology services is vital to understand if cancer care delivery levels continue to be affected.


Figures

Figure 1. Monthly electronic pathology report volume, January 2018 to December 2021 (11 SEER Registries, >3 million reports).
Figure 1.
Monthly electronic pathology report volume, January 2018 to December 2021 (11 SEER Registries, >3 million reports).
Figure 2. Observed and modeled volume of bi-monthly electronic pathology report for all cancer sites combined, January 2018 to February 2021 from 11 SEER registries (>3 million reports). This figure shows the observed counts based on more than 3 million pathology reports from 11 registries, as well as the projected counts, for all cancer sites combined. The solid-line, representing the fitted model, passes through the observed data with symmetric residuals. The dash-line is the projection count. Each month has two data points.
Figure 2.
Observed and modeled volume of bi-monthly electronic pathology report for all cancer sites combined, January 2018 to February 2021 from 11 SEER registries (>3 million reports). This figure shows the observed counts based on more than 3 million pathology reports from 11 registries, as well as the projected counts, for all cancer sites combined. The solid-line, representing the fitted model, passes through the observed data with symmetric residuals. The dash-line is the projection count. Each month has two data points.
Figure 3. Observed to expected ratio, by cancer site (A, colorectal; B, female breast; C, lung; D, melanoma skin; E, prostate; F, all other cancer sites), month and year of diagnosis. The observed 2020 count was compared to the expected count by ratio (O/E ratio) from March 2020 to February 2021. The SE for the ratio was obtained by the delta method, which was used to determine the P value and 95% confidence interval for each O/E ratio. Horizontal solid line depicts an O/E ratio of 1.
Figure 3.
Observed to expected ratio, by cancer site (A, colorectal; B, female breast; C, lung; D, melanoma skin; E, prostate; F, all other cancer sites), month and year of diagnosis. The observed 2020 count was compared to the expected count by ratio (O/E ratio) from March 2020 to February 2021. The SE for the ratio was obtained by the delta method, which was used to determine the P value and 95% confidence interval for each O/E ratio. Horizontal solid line depicts an O/E ratio of 1.

References

    1. Centers for Disease Control and Prevention. CDC museum COVID-19 timeline. 2022. [cited 2022 Nov 7]. Available from: https://www.cdc.gov/museum/timeline/covid19.html.
    1. Moynihan R, Sanders S, Michaleff ZA, Scott AM, Clark J, To EJ, et al. Impact of COVID-19 pandemic on utilisation of healthcare services: a systematic review. BMJ Open 2021;11:e045343. - PMC - PubMed
    1. Richards M, Anderson M, Carter P, Ebert BL, Mossialos E. The impact of the COVID-19 pandemic on cancer care. Nat Cancer 2020;1:565–7. - PMC - PubMed
    1. Chavez-MacGregor M, Lei X, Zhao H, Scheet P, Giordano SH. Evaluation of COVID-19 mortality and adverse outcomes in US patients with or without cancer. JAMA Oncol 2022;8:69–78. - PMC - PubMed
    1. Kutikov A, Weinberg DS, Edelman MJ, Horwitz EM, Uzzo RG, Fisher RI. A war on two fronts: cancer care in the time of COVID-19. Ann Intern Med 2020;172:756–8. - PMC - PubMed

Publication types