

Gradient Organization of Space, Time, and Numbers in the Brain: A Meta-analysis of Neuroimaging Studies
- PMID: 37594695
- PMCID: PMC11478975
- DOI: 10.1007/s11065-023-09609-z
Gradient Organization of Space, Time, and Numbers in the Brain: A Meta-analysis of Neuroimaging Studies
Abstract
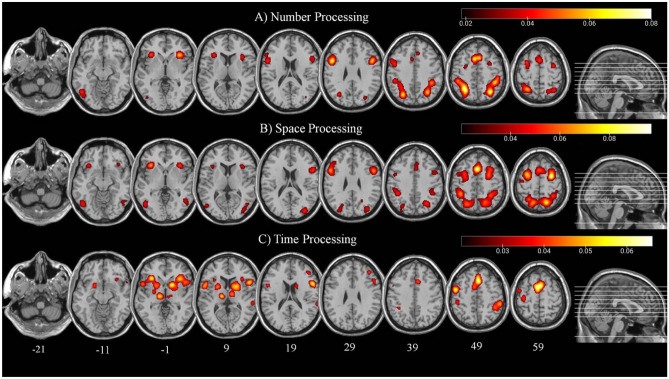
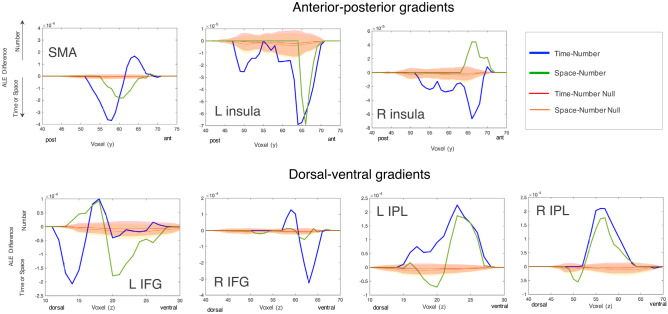
In this study, we ran a meta-analysis of neuroimaging studies to pinpoint the neural regions that are commonly activated across space, time, and numerosity, and we tested the existence of gradient transitions among these magnitude representations in the brain. Following PRISMA guidelines, we included in the meta-analysis 112 experiments (for space domain), 114 experiments (time domain), and 115 experiments (numerosity domain), and we used the activation likelihood estimation method. We found a system of brain regions that was commonly recruited in all the three magnitudes, which included bilateral insula, the supplementary motor area (SMA), the right inferior frontal gyrus, and bilateral intraparietal sulci. Gradiental transitions between different magnitudes were found along all these regions but insulae, with space and numbers leading to gradients mainly over parietal regions (and SMA) whereas time and numbers mainly over frontal regions. These findings provide evidence for the GradiATOM theory (Gradient Theory of Magnitude), suggesting that spatial proximity given by overlapping activations and gradients is a key aspect for efficient interactions and integrations among magnitudes.
Keywords: Activation likelihood estimation; Gradients; Magnitudes; Meta-analysis; Neuroimaging; Numbers; Spatial; Time.
© 2023. The Author(s).
Conflict of interest statement
The authors declare no competing interests exist.
Figures


References
-
- Albertini, D., Gerbella, M., Lanzilotto, M., Livi, A., Maranesi, M., Ferroni, C. G., & Bonini, L. (2020). Connectional gradients underlie functional transitions in monkey pre-supplementary motor area. Progress in Neurobiology, 184, 101699. 10.1016/j.pneurobio.2019.101699 - PubMed
-
- Anderson, M. L. (2010). Neural reuse: A fundamental organizational principle of the brain. The Behavioral and Brain Sciences,33(4), 245–313. 10.1017/S0140525X10000853 - PubMed
-
- Anderson, M. L. (2014). Complex function in the dynamic brain: Comment on “Understanding brain networks and brain organization” by Luiz Pessoa. Physics of Life Reviews,11(3), 436–437. 10.1016/j.plrev.2014.06.017 - PubMed
-
- Arsalidou, M., & Taylor, M. J. (2011). Is 2+2=4? Meta-analyses of brain areas needed for numbers and calculations. NeuroImage,54(3), 2382–2393. 10.1016/j.neuroimage.2010.10.009 - PubMed
Publication types
MeSH terms
Grants and funding
LinkOut - more resources
Full Text Sources
Miscellaneous
