. 2023 Aug 25;8(86):eade3369.
doi: 10.1126/sciimmunol.ade3369. Epub 2023 Aug 18.

In vitro modeling of CD8+ T cell exhaustion enables CRISPR screening to reveal a role for BHLHE40

Affiliations

In vitro modeling of CD8+ T cell exhaustion enables CRISPR screening to reveal a role for BHLHE40

Jennifer E Wu et al. Sci Immunol. .

Abstract

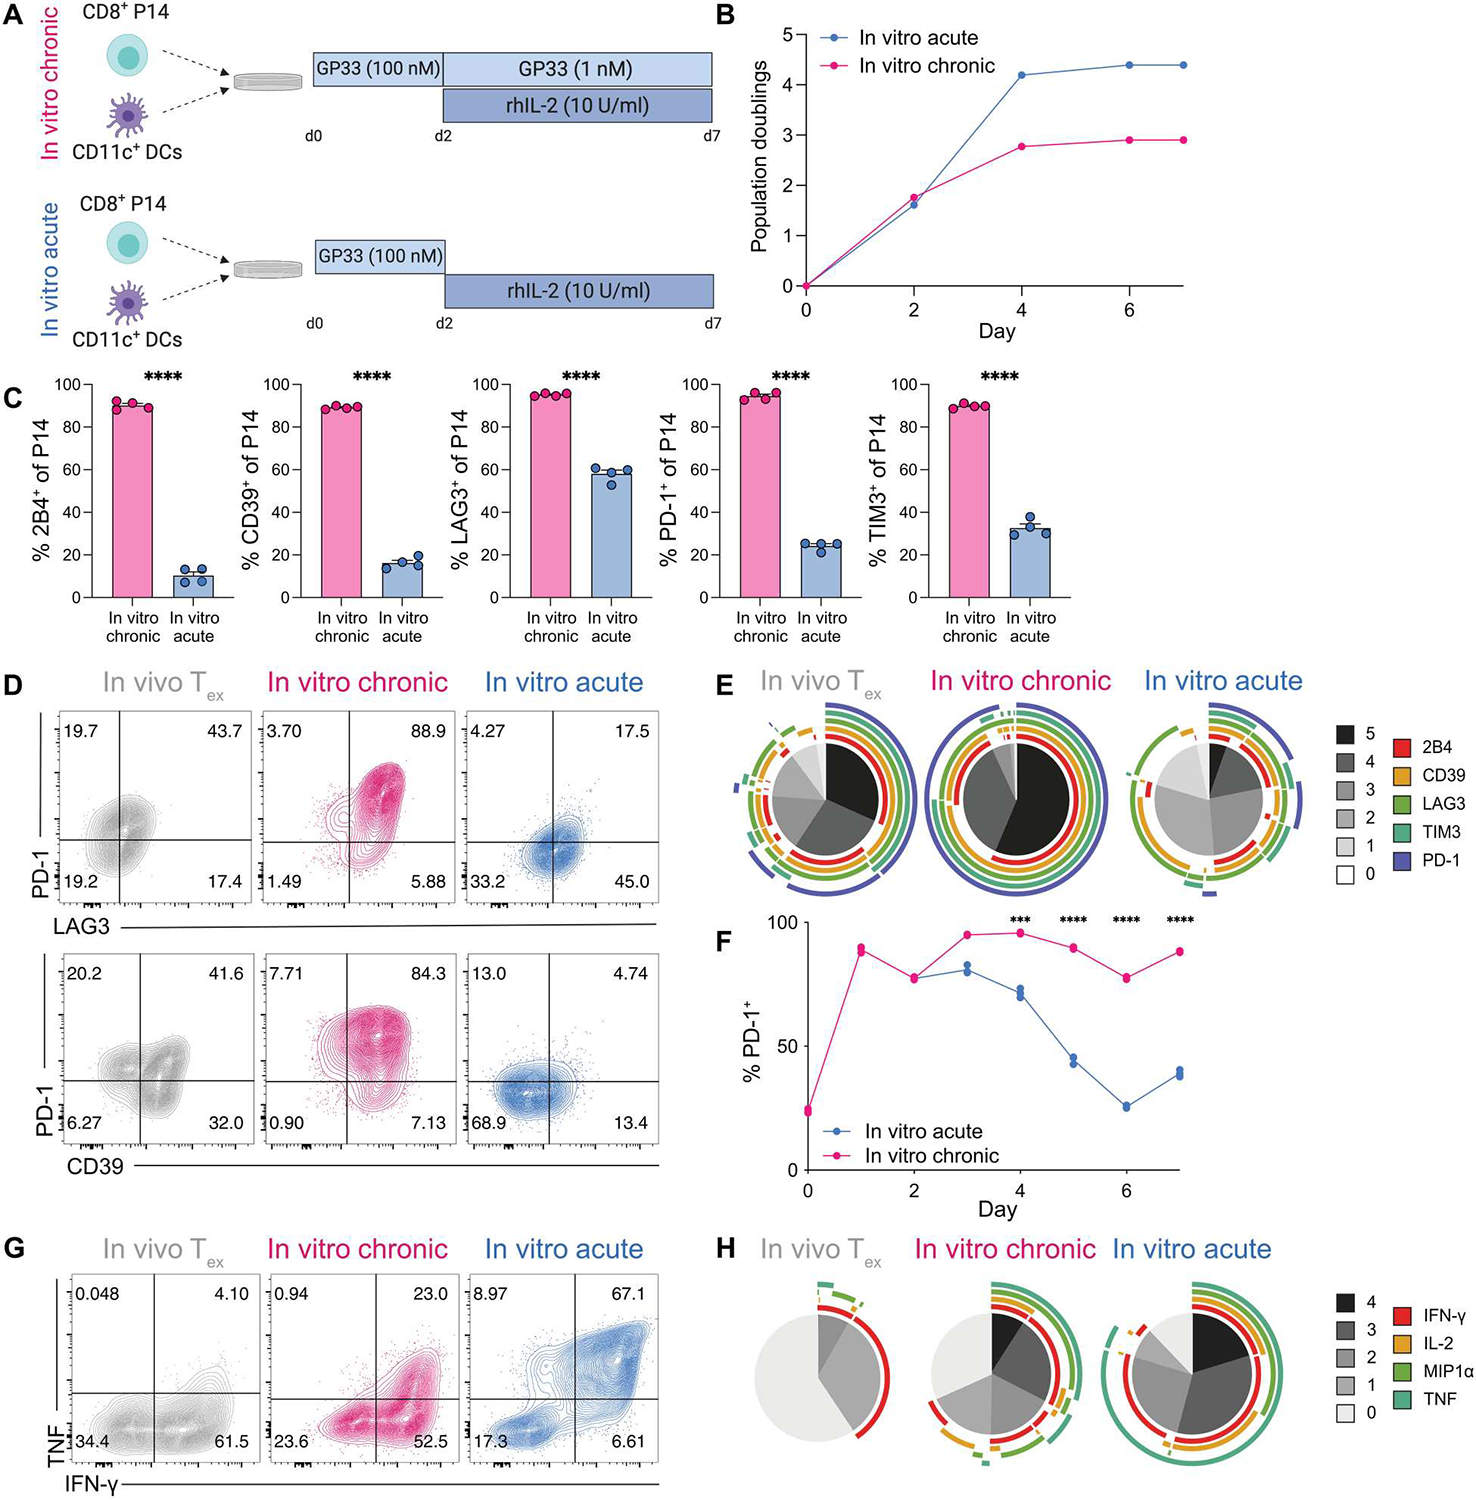
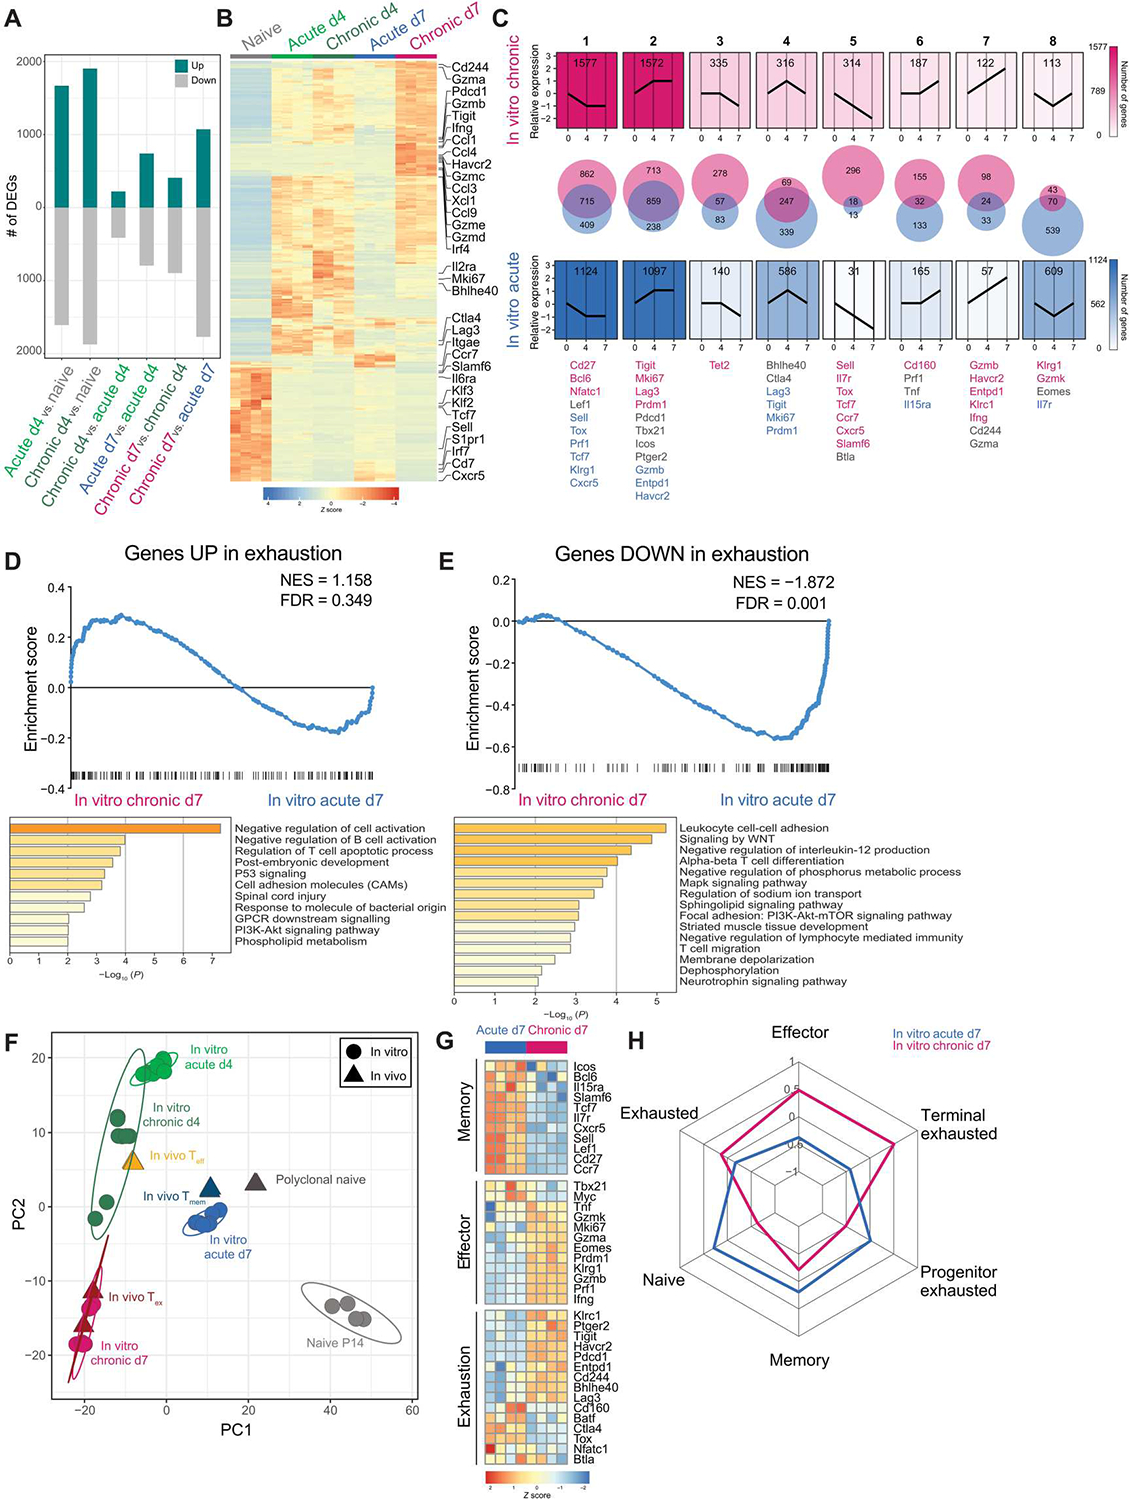
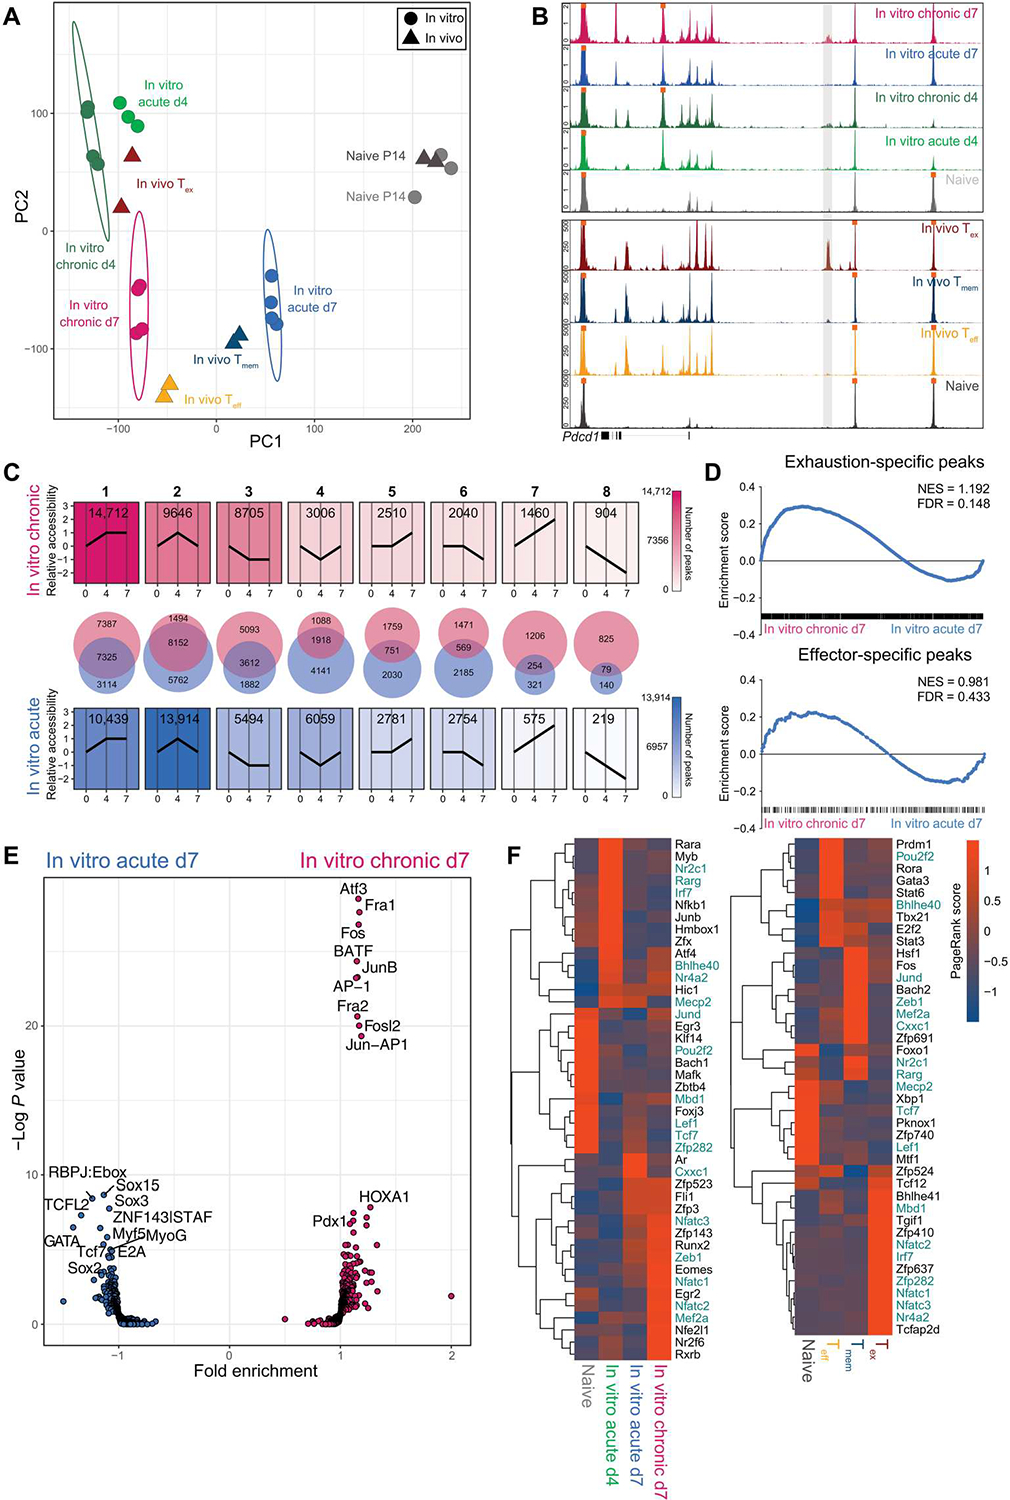
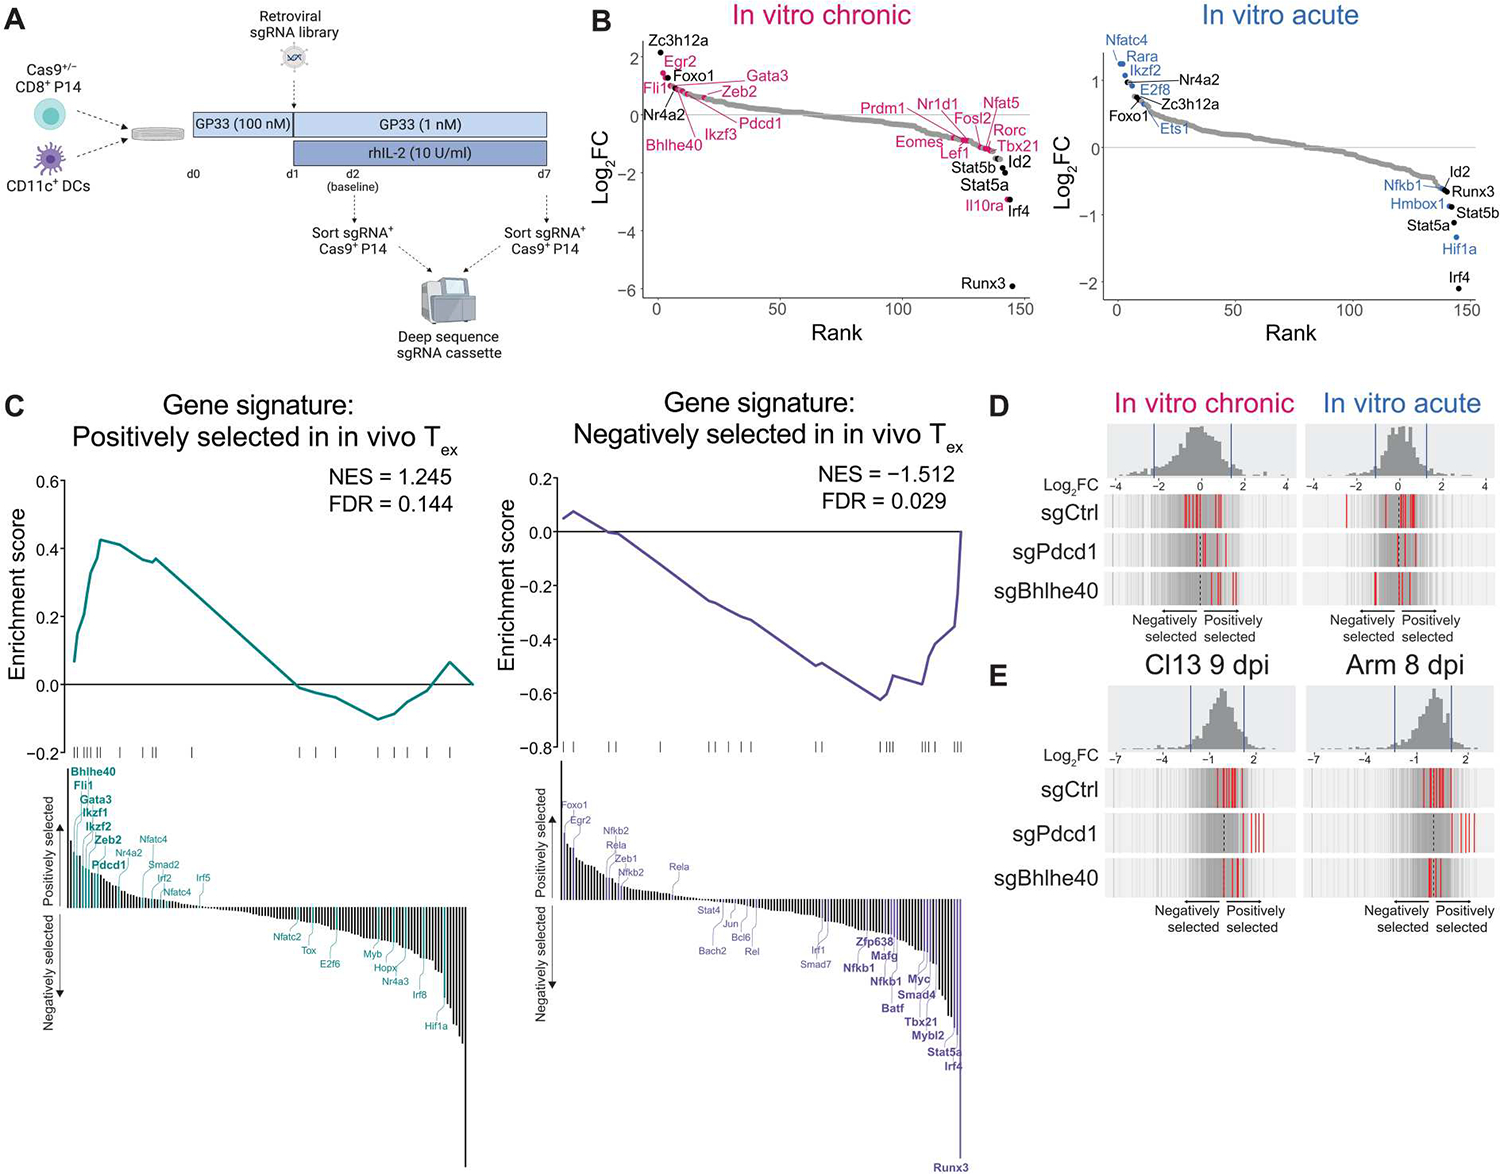
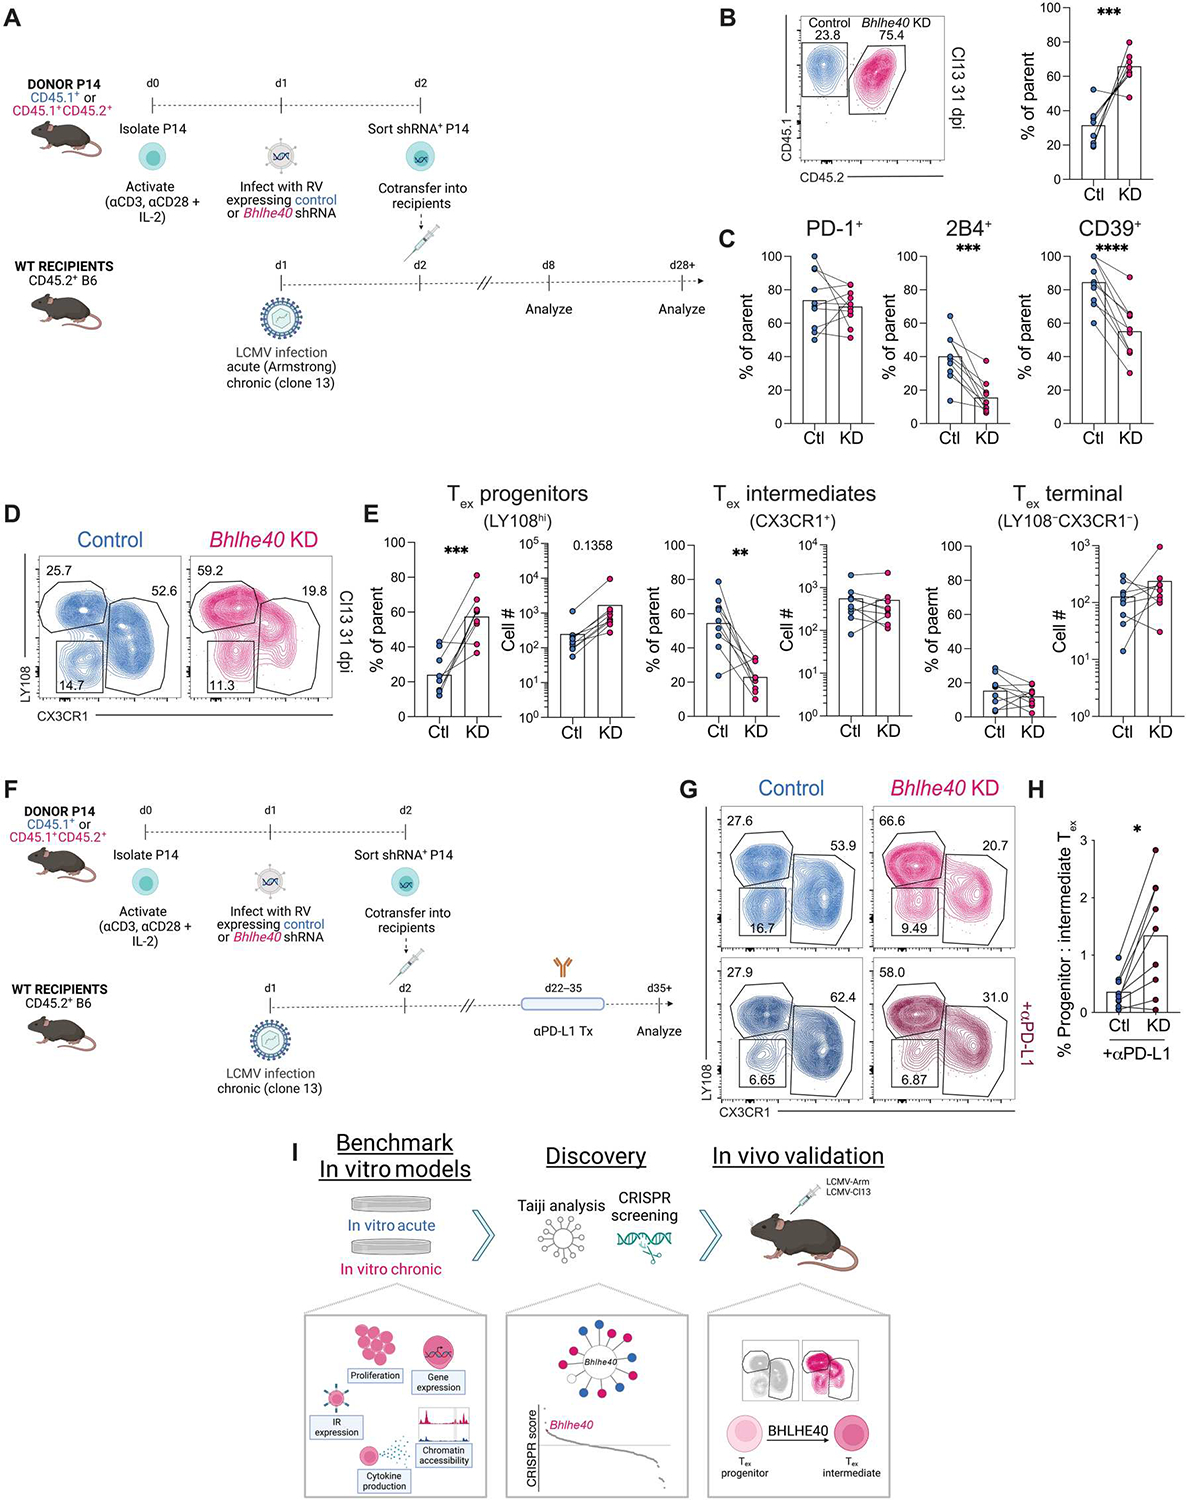
Identifying molecular mechanisms of exhausted CD8 T cells (Tex) is a key goal of improving immunotherapy of cancer and other diseases. However, high-throughput interrogation of in vivo Tex can be costly and inefficient. In vitro models of Tex are easily customizable and quickly generate high cellular yield, enabling CRISPR screening and other high-throughput assays. We established an in vitro model of chronic stimulation and benchmarked key phenotypic, functional, transcriptional, and epigenetic features against bona fide in vivo Tex. We leveraged this model of in vitro chronic stimulation in combination with CRISPR screening to identify transcriptional regulators of T cell exhaustion. This approach identified several transcription factors, including BHLHE40. In vitro and in vivo validation defined a role for BHLHE40 in regulating a key differentiation checkpoint between progenitor and intermediate Tex subsets. By developing and benchmarking an in vitro model of Tex, then applying high-throughput CRISPR screening, we demonstrate the utility of mechanistically annotated in vitro models of Tex.


Conflict of interest statement

E.J.W. is a member of the Parker Institute for Cancer Immunotherapy that supports research in the Wherry laboratory. E.J.W. is an advisor for Danger Bio, Marengo, Janssen, NewLimit, Pluto Immunotherapeutics Related Sciences, Santa Ana Bio, Synthekine, and Surface Oncology. E.J.W. is a founder of and holds stock in Surface Oncology, Danger Bio, and Arsenal Biosciences. O.K. holds equity in Arsenal Biosciences and is an employee of Orange Grove Bio. R.P.S. is an employee of Merck Sharp & Dohme Corp., a subsidiary of Merck & Co. Inc., Kenilworth, NJ, USA.

Figures

Fig. 1.
Fig. 1.. Chronic antigenic stimulation in vitro induces key features of Tex.
(A) Experiment schematic of chronic and acute stimulation of P14 cells in vitro. (B) Cell expansion during chronic and acute stimulation in vitro. (C) Percent expression of IRs by chronically and acutely stimulated P14 cells; two technical replicates of two biological replicates shown. Significance calculated by unpaired t test; ****P < 0.0001. (D) Representative flow cytometry data and (E) SPICE analysis of IR coexpression by in vivo Tex (LCMV-Cl13 30 dpi) and in vitro chronically and acutely stimulated P14 cells. (F) Longitudinal PD-1 expression on in vitro chronically and acutely stimulated P14 cells. Representative of two experiments; significance calculated between groups at each time point by unpaired t test adjusted for multiple comparisons by Benjamini-Hochberg; ***P < 0.001 and ****P < 0.0001. (G) Representative flow cytometry data and (H) SPICE analysis of coproduction of effector cytokines in in vivo Tex (LCMV-Cl13 30 dpi) and in vitro chronically and acutely stimulated P14 cells. (B to E, G, and H) Representative of more than three experiments. (D and G) Numbers in flow cytometry plots indicate percentage of parent population within each gate. (C to H) Gated on CD44hi CD8+ live singlets. (E and H) Grayscale sections indicate number of IRs/cytokines coexpressed; colored bands indicate individual IRs/cytokines.
Fig. 2.
Fig. 2.. In vitro chronically stimulated P14 cells develop a transcriptional signature of Tex.
(A) Number of DEGs [filtered on log2 fold change (lfc) > 1 and P < 0.05] between pairwise comparisons as indicated. (B) Top DEGs (filtered on lfc > 6; P < 0.01) from all pairwise comparisons. (C) Trajectory analysis (see Materials and Methods) of gene expression patterns during chronic or acute stimulation in vitro. (D and E) Top: GSEA of (D) up-regulated and (E) down-regulated genes in in vivo Tex (33) after chronic or acute stimulation in vitro. Bottom: GO analysis of leading edge genes. (F) PCA of RNA-seq data from in vitro chronically and acutely stimulated P14 cells and previously published in vivo CD8 T cell subsets (29). (G) Gene expression of manually curated lists of genes associated with Tmem, Teff, or Tex in in vitro chronically and acutely stimulated P14 cells. (H) GSVA indicating comparative enrichment for various gene signatures (21, 33) after chronic or acute stimulation in vitro. (A to H) Bulk RNA-seq performed on two to four technical replicates of two biological replicates.
Fig. 3.
Fig. 3.. In vitro chronically stimulated P14 cells develop epigenetic signatures of Teff and Tex.
(A) PCA of ATAC-seq data from in vitro chronically and acutely stimulated P14 cells and previously published in vivo CD8 T cell subsets (41). (B) ATAC-seq signal tracks for in vitro chronically and acutely stimulated P14 cells and previously published in vivo CD8 T cell subsets (41); −23.8 kb enhancer of Pdcd1 locus highlighted in gray. Peaks out of range are indicated with a contrast color on top. (C) Trajectory analysis (see Materials and Methods) of chromatin accessibility patterns during in vitro chronic or acute stimulation. (D) PSEA of Tex- and Teff-specific ACRs in in vitro chronically and acutely stimulated P14 cells. (E) TF motif accessibility in DACRs between in vitro chronically and acutely stimulated P14 cells. (F) Rank calculated via Taiji analysis in (left) in vitro chronically and acutely stimulated P14 cells and (right) previously published in vivo CD8 T cell subsets (29), filtered by mean > 0.0001 and fold change > 5. Heat scale indicates z score of rank as calculated by PageRank algorithm. Colored text indicates shared TFs between in vitro and in vivo analyses. (A to F) Bulk ATAC-seq performed on two to four technical replicates of two biological replicates.
Fig. 4.
Fig. 4.. Pooled CRISPR screening in in vitro chronically stimulated P14 cells identifies transcriptional regulators of CD8 T cell differentiation.
(A) Experiment schematic of pooled CRISPR screening. (B) Genes targeted by pooled CRISPR screen ranked by magnitude of selection (as quantified by lfc) after acute and chronic stimulation in vitro. Colored text indicates hits unique to each condition; black text indicates hits common to both. (C) GSEA of gene sets constructed from (left) positively selected and (right) negatively selected sgRNAs from previously published pooled in vivo CRISPR screening (50). Waterfall plot indicates rank order of hits in in vitro chronically stimulated P14 cells; leading edge genes in bold. (D and E) Selection of individual sgRNAs against negative control genes, Pdcd1, and Bhlhe40 (D) after acute and chronic stimulation in vitro and (E) from previously published in vivo dataset (50). Histogram and vertical gray bars indicate distribution of all sgRNAs; vertical red bars represent indicated sgRNAs. (B to D) Representative of two experiments (two technical replicates of two biological replicates).
Fig. 5.
Fig. 5.. BHLHE40 is a transcriptional regulator of Tex differentiation.
(A) Experiment schematic of adoptive cotransfer of control (Ctl) and Bhlhe40 KD P14 cells into LCMV Arm- or Cl13-infected recipient mice. (B) Concatenated flow cytometry plot (left) and summary data of frequency (right) of control and Bhlhe40 KD P14 cells. (C) Percent expression of IRs in control and Bhlhe40 KD P14 cells. (D) Concatenated flow cytometry plots of frequency of Tex subsets in control and Bhlhe40 KD P14 cells. (E) Frequency and total number of progenitor, intermediate, and terminal Tex in control and Bhlhe40 KD P14 cells. (F) Experiment schematic of adoptive cotransfer of control and Bhlhe40 KD P14 cells into LCMV Cl13-infected recipient mice, with αPD-L1 treatment or vehicle control between 22 and 35 dpi. (G) Concatenated flow cytometry plots of frequency of Tex subsets in control and Bhlhe40 KD P14 cells after treatment with vehicle control (top) or αPD-L1 (bottom) from 22 to 35 dpi. (H) Ratio of progenitor to intermediate Tex in control and Bhlhe40 KD P14 cells after αPD-L1 treatment. (I) Schematic detailing discovery pipeline. (B to E, G, and H) Analysis at (B to E) 31 dpi and (G and H) 37 dpi of LCMV-Cl13. Gated on GFP+ CD44hi CD8+ live singlets. n = 10 mice, representative of three experiments. Significance calculated by paired two-tailed t test; *P < 0.05, **P < 0.01, ***P < 0.001, and ****P < 0.0001. (B, D, and G) Numbers in flow cytometry plots indicate percentage of parent population within each gate.

Update of

Similar articles

Cited by

References

    1. McLane LM, Abdel-Hakeem MS, Wherry EJ, CD8 T cell exhaustion during chronic viral infection and cancer. Annu. Rev. Immunol 37, 457–495 (2019). - PubMed
    1. Barber DL, Wherry EJ, Masopust D, Zhu B, Allison JP, Sharpe AH, Freeman GJ, Ahmed R, Restoring function in exhausted CD8 T cells during chronic viral infection. Nature 439, 682–687 (2006). - PubMed
    1. Krummel MF, Allison JP, CTLA-4 engagement inhibits IL-2 accumulation and cell cycle progression upon activation of resting T cells. J. Exp. Med 183, 2533–2540 (1996). - PMC - PubMed
    1. Leach DR, Krummel MF, Allison JP, Enhancement of antitumor immunity by CTLA-4 blockade. Science 271, 1734–1736 (1996). - PubMed
    1. Wherry EJ, Blattman JN, Murali-Krishna K, van der Most R, Ahmed R, Viral persistence alters CD8 T-cell immunodominance and tissue distribution and results in distinct stages of functional impairment. J. Virol 77, 4911–4927 (2003). - PMC - PubMed

Publication types

MeSH terms