. 2023 Aug 18;9(33):eadg7997.
doi: 10.1126/sciadv.adg7997. Epub 2023 Aug 18.

Spic regulates one-carbon metabolism and histone methylation in ground-state pluripotency

Affiliations

Spic regulates one-carbon metabolism and histone methylation in ground-state pluripotency

Fatemeh Mirzadeh Azad et al. Sci Adv. .

Abstract

Understanding mechanisms of epigenetic regulation in embryonic stem cells (ESCs) is of fundamental importance for stem cell and developmental biology. Here, we identify Spic, a member of the ETS family of transcription factors (TFs), as a marker of ground state pluripotency. We show that Spic is rapidly induced in ground state ESCs and in response to extracellular signal-regulated kinase (ERK) inhibition. We find that SPIC binds to enhancer elements and stabilizes NANOG binding to chromatin, particularly at genes involved in choline/one-carbon (1C) metabolism such as Bhmt, Bhmt2, and Dmgdh. Gain-of-function and loss-of-function experiments revealed that Spic controls 1C metabolism and the flux of S-adenosyl methionine to S-adenosyl-L-homocysteine (SAM-to-SAH), thereby, modulating the levels of H3R17me2 and H3K4me3 histone marks in ESCs. Our findings highlight betaine-dependent 1C metabolism as a hallmark of ground state pluripotency primarily activated by SPIC. These findings underscore the role of uncharacterized auxiliary TFs in linking cellular metabolism to epigenetic regulation in ESCs.


Figures
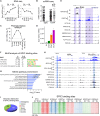
Fig. 1.
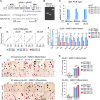
Fig. 1.. Spic is a specific marker of ground-state pluripotency.
(A) RNA-seq showing that Spic is highly induced in 2iL-ESCs. The dots show the mean, and the error bars show the SEM of n = 2 biological replicates. (B) Single-cell RNA-seq (scRNA-seq) showing Spic expression in 2iL-ESCs but not SL-ESCs (n = 190 cells). Oct4 expression is shown as the control. Each dot represents one cell. (C) RNA-seq showing Spic expression during the preimplantation stages of mouse embryo. The dots show the mean, and the error bars show the SEM of n > 2 biological replicates. (D) Quantitative reverse transcription polymerase chain reaction (qRT-PCR) showing Spic induction downstream of PD0325901 treatment (MEK/ERK inhibition). The bars show the mean of n = 2 biological replicates. (E) Genome browser view showing that the Spic locus is occupied by different pluripotency factors. (F) Motif analysis of SPIC chromatin binding sites showing enrichment for ETS and OCT4/SOX2/TCF/NANOG motifs. (G) Gene ontology term enrichment analysis for genes located in the vicinity of SPIC binding sites. (H) Genome browser view showing two representative examples of SPIC target genes. (I) Genome-wide distribution of SPIC binding sites in 2iL-ESCs. (J) SPIC binding sites are demarked by histone modifications associated with enhancers. FC, fold change; KEGG, Kyoto Encyclopedia of Genes and Genomes; PI3K, phosphatidylinositol 3-kinase; mTOR, mammalian target of rapamycin; TGF-β, transforming growth factor–β; TTS, transcription termination site; 3′UTR, 3′ untranslated region; 5′UTR, 5′ untranslated region.
Fig. 2.
Fig. 2.. SPIC supports 2iL-ESCs but is not essential for ESC maintenance.
(A) Schematic representation of Spic locus and locations of guide RNA (gRNA)/PCR primers used for generating Spic-KO ESCs. The sequencing results obtained in two independent Spic-KO clones are shown at the junction of the deleted DNA fragments. (B) PCR validation of Spic-KO ESCs using genomic DNA. (C) qRT-PCR analysis showing Spic expression in Spic-WT, Spic-KO, and Spic-OE cells. Two independent clones for Spic-KO and Spic-OE were used. The bars represent the means, and the error bars show the SEM of n = 2 technical replicates. (D) Graph showing the proliferation rate of Spic-KO, Spic-OE, and Spic-WT ESCs in SL or at different time points of SL-to-2iL transition. The lines represent the mean of two independent clones and n = 3 biological replicates per clone for Spic-KO and Spic-OE ESCs and n = 6 biological replicates for WT ESCs. (E) qRT-PCR showing expression of pluripotency markers during early differentiation (24 hours) of ESCs in N2B27 medium. The bars represent the means of n = 2 independent clones of Spic-KO or Spic-OE and n = 2 biological replicates of WT ESCs. (F) Microscopy pictures showing the AP staining in Spic-WT, Spic-KO, and Spic-OE ESCs cultured in 2iL (day 5 or day 20) or differentiated for 24 hours in N2B27 medium. Scale bars, 200 μm. (G) Graphs showing the percentage of AP-low colonies upon N2B27 differentiation in different ESCs. The bars represent the means of two independent clones and n = 2 biological replicates per clone for Spic-KO or Spic-OE, and n = 4 biological replicates for WT ESCs. In all graphs, the error bars show the SEM and the asterisks represent P < 0.05, unpaired two-tailed Student’s t test. ns, not significant.
Fig. 3.
Fig. 3.. SPIC interacts with NANOG and stabilizes its chromatin binding.
(A) IP-MS of GFP-SPIC showing the associated proteins in SL- and 2iLd3-ESCs. WT ESCs were used as negative control. Volcano plots show the log2 fold change and P value (based on false discovery rate–corrected t test) of iBAQ values in GFP-SPIC versus WT IPs based on n = 3 biological samples. (B) Immunoblot showing NANOG-SPIC interaction in 2iLd3-ESCs. ESCs stably expressing SPIC-GFP and FLAG-NANOG were used in FLAG-NANOG IP followed by immunoblotting for SPIC-GFP. WT ESCs and SPIC-GFP without FLAG-NANOG were used as controls. (C) Heatmap showing the chromatin binding of FLAG-NANOG and ATAC-seq signals in Spic-KO, Spic-OE, and Spic-WT ESCs cultured in SL or 2iLd3. For FLAG-NANOG, average ChIP-seq read counts of n = 2 biological replicates are shown. For ATAC-seq, average read counts of n = 2 independent clones of Spic-KO or Spic-OE and n = 2 biological replicates of WT ESCs are shown. (D) Average plot quantification of mean signals as shown in (C). (E) Genome browser view showing that SPIC influences NANOG binding at specific sites in 2iL-ESCs.
Fig. 4.
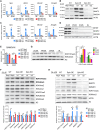
Fig. 4.. SPIC regulates 1C metabolism genes.
(A) Venn diagram showing that five genes are differentially expressed in different comparisons and have SPIC binding in close vicinity. (B) Heatmap showing the mRNA log2 fold change (based on RNA-seq) of the five genes identified in (A). (C) Genome browser view showing SPIC binding and epigenetic marking of Bhmt, Bhmt2, and Dmgdh loci in SL-ESCs and 2iL-ESCs. (D) Schematic representation of the 1C metabolic cycle. (E) Graphs showing mRNA expression (based on RNA-seq) of Bhmt, Bhmt2, and Dmgdh during 2iL-SL-EPI transitions. The bars represent the means, and the error bars represent the SEM of n = 2 biological replicates. (F) Graphs showing protein expression [based on whole-cell proteomic (15)] of the 1C cycle genes during 2iL-SL-EPI transitions. Only proteins with detectable values in whole-cell proteomic are shown. The bars represent the means, and the error bars represent the SEM of n = 3 biological replicates. (G) Immunoblot showing BHMT protein expression during 2iL-SL-EPI transitions. (H) Graphs showing mRNA expression (based on RNA-seq) of the 1C cycle genes during early mouse embryonic development. The bars represent the means, and the error bars represent the SEM of n = 2 biological replicates.
Fig. 5.
Fig. 5.. SPIC regulates SAM/SAH level and histone methylation.
(A) qRT-PCR analysis showing expression of Bhmt, Bhmt2, and Dmgdh in Spic-KO, Spic-OE, and Spic-WT ESCs cultured in SL and 2iLd1.The bars represent the means of n = 2 independent clones of Spic-KO or Spic-OE and n = 2 biological replicates of WT ESCs. (B) Immunoblot showing expression of BHMT, BHMT2, and DMGDH in Spic-KO, Spic-OE, and Spic-WT 2iLd5-ESCs. Two independent clones of Spic-KO or Spic-OE and n = 2 biological replicates of WT ESCs are used. (C) qRT-PCR analysis showing expression of Bhmt, Bhmt2, and Dmgdh in Spic-KO, Spic-OE, and Spic-WT ESCs cultured for 5 days in PD0325901/LIF or CHIR99021/LIF medium. The bars represent the means of n = 2 independent clones of Spic-KO or Spic-OE and n = 2 biological replicates of WT ESCs. (D) Immunoblot showing expression of BHMT, BHMT2, and DMGDH in WT ESCs cultured for 5 days in PD0325901/LIF, CHIR99021/LIF, or 2iL-supplemented media. Two independent clones of Spic-KO or Spic-OE, and n = 2 biological replicates were used. (E) Graph showing the ratio of SAM/SAH as measured by MS in SL-ESCs and 2iLd5-ESCs. The bars represent the means of n = 2 independent clones of Spic-KO or Spic-OE and n = 2 biological replicates of WT ESCs. (F) Immunoblot and densitometry analysis showing levels of different methylated histone marks in Spic-KO, Spic-OE, and Spic-WT 2iLd5-ESCs. Two independent clones of Spic-KO or Spic-OE and n = 2 biological replicates of WT ESCs are used. (G) Immunoblot showing levels of H3K4me3 and H3R17me2a WT ESCs cultured in PD0325901/LIF or CHIR99021/LIF medium. n = 2 biological replicates. (H) Immunoblot and densitometry analysis showing the levels of H3R17me2a, H3K4me3, BHMT, BHMT2, and DMGDH in long-term 2iL-cultured Spic-KO, Spic-OE, and Spic-WT ESCs. Two independent clones of Spic-KO or Spic-OE and n = 2 biological replicates of WT ESCs are used. In all graphs, the error bars show the SEM and the asterisks represent P < 0.05, unpaired two-tailed Student’s t test.
Fig. 6.
Fig. 6.. Targeting 1C metabolism affects ESCs differentiation.
(A) Schematic representation of the two pathways involved in driving 1C metabolism. MTX specifically blocks the folate pathway. (B) MTX response in WT ESCs cultured for 5 days in 2iL with or without SAM supplementation. The lines represent the mean of DMSO (dimethyl sulfoxide)–normalized viability of n = 2 biological replicates. (C) MTX response in 2iLd5 Spic-KO, Spic-OE, and Spic-WT ESCs. The bars represent the mean viability of two independent clones and n = 2 biological replicates per clone for Spic-KO and Spic-OE ESCs and n = 4 biological replicates for WT ESCs. (D and E) AP staining in Spic-KO, Spic-OE, and Spic-WT ESCs treated with SAM or BHMTi (CBHcy) for 5 days during SL-to-2iLd5 transition, followed by 24 hours of differentiation in N2B27 medium. Scale bars, 200 μm. Barplot represents the percentage of AP-low colonies upon N2B27 differentiation under different in each treatment condition. Two independent clones and n = 2 biological replicates per clone were used for Spic-KO and Spic-OE ESCs and n = 3 biological replicates for WT ESCs. (F) Immunoblot and the corresponding densitometry analysis showing the levels of BHMT, BHMT2, DMGDH, H3R17me2a, and H3K4me in WT ESCs treated with SAM or BHMTi (CBHcy) for 5 days during SL-to-2iLd5 transition. The bars show the mean of n = 2 biological replicates per treatment condition. In all graphs, the error bars show the SEM and the asterisks represent P < 0.05, unpaired two-tailed Student’s t test.
Fig. 7.
Fig. 7.. Spic links cellular metabolism to epigenetic regulation in ground-state pluripotency.
Spic is induced in response to MEK/ERK inhibition in 2iL-ESCs and is up-regulated in early blastocyst. SPIC stabilizes NANOG binding and increases chromatin accessibility at genes involved in choline and 1C metabolism. By activating the betaine-dependent 1C metabolism, SPIC increases SAM-to-SAH flux, maintains low levels of SAM, and controls the level of H3K4me3 and H3R17me2 histone methylation in ground-state ESCs. During transition from ground-state to primed-state pluripotency, ERK/MEK signaling represses Spic and 1C metabolism.

References

    1. Y. Atlasi, H. G. Stunnenberg, The interplay of epigenetic marks during stem cell differentiation and development. Nat. Rev. Genet. 18, 643–658 (2017). - PubMed
    1. L. Weinberger, M. Ayyash, N. Novershtern, J. H. Hanna, Dynamic stem cell states: Naive to primed pluripotency in rodents and humans. Nat. Rev. Mol. Cell Biol. 17, 155–169 (2016). - PubMed
    1. Y. Atlasi, W. Megchelenbrink, T. Peng, E. Habibi, O. Joshi, S.-Y. Wang, C. Wang, C. Logie, I. Poser, H. Marks, H. G. Stunnenberg, Epigenetic modulation of a hardwired 3D chromatin landscape in two naive states of pluripotency. Nat. Cell Biol. 21, 568–578 (2019). - PubMed
    1. A. S. Bernardo, A. Jouneau, H. Marks, P. Kensche, J. Kobolak, K. Freude, V. Hall, A. Feher, Z. Polgar, C. Sartori, I. Bock, C. Louet, T. Faial, H. H. D. Kerstens, C. Bouissou, G. Parsonage, K. Mashayekhi, J. C. Smith, G. Lazzari, P. Hyttel, H. G. Stunnenberg, M. Huynen, R. A. Pedersen, A. Dinnyes, Mammalian embryo comparison identifies novel pluripotency genes associated with the naïve or primed state. Biol. Open 7, bio033282 (2018). - PMC - PubMed
    1. M. Bemark, A. Mårtensson, D. Liberg, T. Leanderson, Spi-C, a novel Ets protein that is temporally regulated during B lymphocyte development. J. Biol. Chem. 274, 10259–10267 (1999). - PubMed