. 2023 Aug 18;9(33):eadg7112.
doi: 10.1126/sciadv.adg7112. Epub 2023 Aug 18.

FOXA1 O-GlcNAcylation-mediated transcriptional switch governs metastasis capacity in breast cancer

Affiliations

FOXA1 O-GlcNAcylation-mediated transcriptional switch governs metastasis capacity in breast cancer

Yajie Liu et al. Sci Adv. .

Abstract

FOXA1, a transcription factor involved in epigenetic reprogramming, is crucial for breast cancer progression. However, the mechanisms by which FOXA1 achieves its oncogenic functions remain elusive. Here, we demonstrate that the O-linked β-N-acetylglucosamine modification (O-GlcNAcylation) of FOXA1 promotes breast cancer metastasis by orchestrating the transcription of numerous metastasis regulators. O-GlcNAcylation at Thr432, Ser441, and Ser443 regulates the stability of FOXA1 and promotes its assembly with chromatin. O-GlcNAcylation shapes the FOXA1 interactome, especially triggering the recruitment of the transcriptional repressor methyl-CpG binding protein 2 and consequently stimulating FOXA1 chromatin-binding sites to switch to chromatin loci of adhesion-related genes, including EPB41L3 and COL9A2. Site-specific depletion of O-GlcNAcylation on FOXA1 affects the expression of various downstream genes and thus inhibits breast cancer proliferation and metastasis both in vitro and in vivo. Our data establish the importance of aberrant FOXA1 O-GlcNAcylation in breast cancer progression and indicate that targeting O-GlcNAcylation is a therapeutic strategy for metastatic breast cancer.


Figures

Fig. 1.
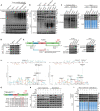
Fig. 1.. Low levels of FOXA1 and high levels of O-GlcNAcylation in breast tumors are correlated with poor patient prognosis.
(A) FOXA1 mRNA expression between pathological low-grade (grades 1 and 2) and high-grade (grade 3) breast tumor tissues from GEO datasets (n = 589, GSE25066\61304\425668) are shown. The box plots show the medians (black lines), 25th and 75th percentiles (boundaries), and minimum/maximum values (whiskers). The P value is indicated. (B) Kaplan-Meier curves of patients with breast cancer from GEO datasets (n = 589, GSE25066\61304\425668) grouped by FOXA1 mRNA expression in tumor tissues. Patients with FOXA1 expression above the median are indicated by the yellow line, and patients with gene expression below the median are indicated by the blue line. The 95% confidence interval is shown. OS, overall survival. (C) Representative IHC staining of FOXA1 and global O-GlcNAcylation in a tissue microarray containing 114 breast tumors and 10 adjacent samples. The patient no. (F10, G7) on the microarray is indicated. Histological scoring was calculated using Image Pro Plus. Scale bar, 250 μm. (D) Pearson’s correlation analysis of FOXA1 and global O-GlcNAcylation IHC scores among different progression stages of breast cancer tissues in the tissue microarray (n = 114). The violin plots show the 25th, 50th, and 75th percentiles. (E) Pearson’s correlation analysis of FOXA1 and O-GlcNAcylation IHC scores in 114 breast tumor tissues. (F) Kaplan-Meier curves of 114 patients with breast cancer grouped by FOXA1 protein expression in tumor tissues. Patients with FOXA1 and O-GlcNAcylation levels above the median are indicated by the yellow line, and patients with gene expression levels below the median are indicated by the blue line. The 95% confidence interval is shown. (G) Western blotting (WB) was performed in five breast cancer patient tumor samples. The relative intensity of OGT and OGA bands is shown. The pathological grade and the patient no. are indicated.
Fig. 2.
Fig. 2.. FOXA1 is O-GlcNAcylated by OGT in breast cancer cells.
(A) An opposite trend of FOXA1 expression and global O-GlcNAcylation levels was identified in breast cancer cells. Cells were incubated with/without 100 nM fulvestrant for 3 hours. Indicated proteins were detected by WB. (B) FOXA1 O-GlcNAcylation and FOXA1-OGT interactions were compared in breast cancer cells. After treatment of breast cancer cells with OSMI-4 (50 μM) or TMG (50 μM) for 24 hours, FOXA1 co-IP was performed. (C) OGT gain and loss of function affects the O-GlcNAcylation level of FOXA1. MCF-7 and MDA-MB-231 cells were transfected with OGT heterogeneous expression or shRNA (shOGT) plasmids. After 48 hours, sWGA lectin pulldown was performed. CBB, Coomassie Brilliant Blue staining. (D) A Click iT O-GlcNAc enzymatic labeling system was used to confirm the O-GlcNAcylation of endogenous FOXA1 in breast cancer cells. (E) The CTD is crucial for FOXA1 O-GlcNAcylation. Left: Three truncated variants of FOXA1 (ΔFOXA1-A to ΔFOXA1-C) fused with an HA-tag were generated according to its key domains. DBD, DNA binding domain. Right: Three truncated FOXA1 expression plasmids were transfected with the OGT expression plasmid in HEK-293 T cells. After 48 hours, HA-tag co-IP was performed. (F) The sites of FOXA1 O-GlcNAcylation were mapped using mass spectrometry. (G) FOXA1 protein sequences, including the O-GlcNAcylation sites T432, S441, and S443, were aligned across species using BLAST. Red letters indicate conserved serine/threonine residues. (H and I) FOXA1 is O-GlcNAcylated at T432, S441, and S443 in breast cancer cells. After treatment with OSMI-4 (50 μM) or TMG (50 μM) for 24 hours, MCF-7 FOXA1 KO and MDA-MB-231 cells stably expressing HA-tagged FOXA1WT (WT) or HA-tagged FOXA13A (T432/S441/S443 → Ala, 3A) were immunoprecipitated with anti-HA-tag magnetic beads (H) or pulled down with sWGA lectin (I). O-GlcNAcylation was analyzed by WB.
Fig. 3.
Fig. 3.. O-GlcNAcylation regulates the stability and chromatin binding of FOXA1.
(A) Site-specific O-GlcNAcylation expedites the degradation of FOXA1. Left: Cells were incubated with 50 μM cycloheximide (CHX) for up to 12 hours. The ubiquitination and HA-FOXA1 were detected. Right: After treatment with OSMI-4 (50 μM) or TMG (50 μM) for 24 hours, cell lysates were immunoprecipitated with anti-HA-tag magnetic beads. (B) O-GlcNAcylation regulates the stability of FOXA1 through the ubiquitin-proteasome pathway. Cells were treated with 10 μM MG132 for 10 hours. HA-FOXA1 immunoprecipitation was performed. (C) Overall serine and threonine phosphorylation were analyzed by immunoprecipitation and WB. (D) O-GlcNAcylation enhances the chromatin binding of FOXA1. After treatment with OSMI-4 (50 μM) or TMG (50 μM) for 24 hours, chromatin and cytoplasm proteins were detected for HA-FOXA1. (E) Fluorescent staining results showing the nuclear localization dependence of FOXA1 on O-GlcNAcylation. Breast cancer cells were treated with 50 μM OSMI-4 or TMG for 24 hours. The micrograph scale bar represents 25 μm. DAPI, 4′,6-diamidino-2-phenylindole. (F) Molecular dynamic simulation of O-GlcNAcylated and nonglycosylated FOXA1 binding with DNA. Left: The overall model structure of FOXA1-DNA complex with the substrate DNA helix. Middle: The typical conformations of O-GlcNAcylated and nonglycosylated FOXA1 transcriptional activating domain (TAD)-DNA complex from MD simulation. Right: The interaction network around O-GlcNAc groups in the O-GlcNAcylated system and the nonglycosylated system. DT, DNA T base; DA, DNA A bases; DC, DNA C base; DG, DNA G base. The serial number of sense-strand starts with 1 as the 5′-terminal, and the serial number of antisense strand starts from 29 as the 5′-terminal. (G) The center of mass distance between the helix region (amino acids: 402 to 425) in FOXA1 CTD and the major groove (base pair: 6 to 14) of DNA as a function of time. Snapshots from the simulations of two systems are shown on the bottom.
Fig. 4.
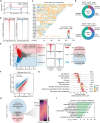
Fig. 4.. O-GlcNAcylation regulates the interaction between FOXA1 and epigenetic regulation factors.
(A) Silver staining of FOXA1WT and FOXA13A interactome. MCF-7 FOXA1 KO cells stably expressing HA-FOXA1WT or HA-FOXA13A were immunoprecipitated with anti-HA-tag magnetic beads. The immunoprecipitated fractions were resolved using SDS-PAGE and silver stained. (B) Volcano plot of LFQ proteomics data of FOXA1WT and FOXA13A interactome in MCF-7 FOXA1 KO cells (n = 6 biologically independent experiments, two-sided unpaired Student’s t test). The FOXA1 partners mentioned in this study are labeled in bold. (C) STRING protein-protein interaction analysis and functional enrichment analysis of FOXA1 interactome in FOXA1WT or FOXA13A expressed MCF-7 FOXA1 KO cells. Protein LFQ intensity of FOXA1 partner is shown in heat maps (yellow, high; blue, low). (D) GO terms enriched for FOXA1 partners in FOXA1WT or FOXA13A expressed MCF-7 FOXA1 KO cells. (E) O-GlcNAcylation affects the interaction between FOXA1 and epigenetic regulation factors. After treatment with OSMI-4 (50 μM) or TMG (50 μM) for 24 hours, MCF-7 FOXA1 KO cells stably resecue-expressing HA-FOXA1WT or HA-FOXA13A were immunoprecipitated with anti-HA-tag magnetic beads. The indicated protein levels were detected by WB. The relative intensity of indicated protein bands is shown. (F) MECP2 knockdown decreased the chromatin binding of FOXA1. MCF-7 FOXA1 KO cells were transfected with MECP2 shRNA (shMECP2). Scrambled shRNA (shScr) was used as a control. After treatment with TMG (50 μM) for 24 hours, chromatin proteins were extracted, and the levels of HA-FOXA1WT and HA-FOXA13A were detected by WB.
Fig. 5.
Fig. 5.. FOXA1 O-GlcNAcylation governs metastasis-related genes expression through FOXA1 chromatin loci fluctuations.
(A) The average enrichment profiles of FOXA1WT and FOXA13A ChIP-seq signals at all gene regions in the reference genome hg19. The transcriptional start site (TSS) and termination site (TES) are indicated. n = 2 biologically independent ChIP-seq replicates. (B) Heat maps of the FOXA1WT and FOXA13A ChIP-seq reads density at the peak center (± 2 kb). (C) Gene density map plot of the FOXA1WT and FOXA13A ChIP-seq peak locations over the whole human genome. (D) FOXA1WT and FOXA13A ChIP-seq peak annotation relative to known genomic elements. (E) ChIP-seq occupancy signal in FOXA1WT-biased, FOXA13A-biased and unbiased sites identified by MAnorm. Left: MA plots of all peaks from both FOXA1WT and FOXA13A ChIP-seq datasets after MAnorm analysis. Differential quantitative peaks M value (Log2 fold change) ≥ 1 for FOXA1WT-biased sites, or M value ≤ −1 for FOXA13A-biased sites are shown (P ≤ 10−5). Middle: Heat map representation of ChIP-seq signal density at differential quantitative sites. Right: Venn diagram showing the overlap of ChIP-seq peak associated genes. (F) Scatter plot showing the RNA-seq DEG expression levels [fragments per kilobase of transcript per million mapped reads (FPKM), fold change ≥2, FDR ≤ 0.001] in FOXA1WT or FOXA13A expressed MCF-7 FOXA1 KO cells. GO terms related to tumor metastasis have been marked red. n = 2 biologically independent RNA-seq replicates. (G) GSEA of RNA-seq DEGs in FOXA1WT expressed MCF-7 FOXA1 KO cells compared with FOXA13A expressed cells. The normalized enrichment score (NES) and P values are indicated. (H) Venn diagram shows the 2736 overlap genes of RNA-seq DEGs compared with FOXA1 ChIP-seq differential peak-associated genes. mRNA expression of the overlapping genes is shown in heat maps (yellow, high; black, low). (I) GO analysis of 2736 overlapping genes. The gene numbers identified in certain terms are shown.
Fig. 6.
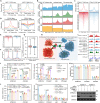
Fig. 6.. The chromatin-binding switch of O-GlcNAcylated FOXA1 is stimulated by MECP2.
(A and B) O-GlcNAcylated FOXA1 chromatin loci shows transcriptional suppression characteristics. Average enrichment profiles of published MCF-7 cells (A) ATAC-seq (GSE179666), RNA-Pol II ChIP-seq (GSE54693), (B) H3K27me3 (GSE96363), H3K4me1 (GSE86714), H3K4me3 (GSE97481), and H3K27ac (GSE97481) ChIP-seq reads at differential quantitative FOXA1WT and FOXA13A ChIP-seq peaks are shown. (C) Heat maps of the FOXA1WT and FOXA13A ChIP-seq signal density at hg19 genome-wide CpG islands. (D) Average published MCF-7 cells genome-wide DNA methylation (GSE54693) profiles at CpG islands (left) and typical/super enhancer elements (right) of differential quantitative FOXA1WT and FOXA13A ChIP-seq peaks. (E) Heat map representation of endogenic MECP2 ChIP-seq (in FOXA1WT and FOXA13A expressed MCF-7 FOXA1 KO cells, respectively) signal enrichment at differential quantitative FOXA1WT and FOXA13A sites. (F) Cells were transfected with MECP2 shRNA (shMECP2). Average enrichment profiles of FOXA1 ChIP-seq reads at FOXA1WT and FOXA13A-biased sites are shown. (G) The box plots showing the mRNA expression changes of FOXA1-targeting genes associated with FOXA1WT and FOXA13A-biased sites. n = 2 biologically independent RNA-seq replicates. (H) Predicted regulatory network between FOXA1 and the corresponding downstream genes in different O-GlcNAcylation state. Functional enrichment is indicated. (I) Integrative Genomics Viewer tracks showing FOXA1, MECP2, RNA-Pol II ChIP-seq and DNA methylation, ATAC-seq signal at the promoter regions of the representative genes EPB41L3 and COL9A2. (J) Certain FOXA1 targeting genes were validated by qPCR and ChIP-qPCR. (K) Methylation status of EPB41L3 and COL9A2 gene promoter regions in the indicated cells were measured by methylation-specific qPCR. (L) Cells were transfected with MECP2 shRNA (shMECP2). Certain FOXA1 targeting genes were validated by qPCR and ChIP-qPCR. For (J) to (L), cells were pretreated with OSMI-4 (50 μM) or TMG (50 μM) for 24 hours. n = 4 biologically independent experiments.
Fig. 7.
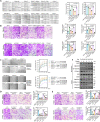
Fig. 7.. FOXA1 O-GlcNAcylation elevates the metastatic potential of breast cancer cells.
(A to C) The motility (A), migration and invasion ability (B), and adhesion ability (C) of breast cancer cells were analyzed. Cells were treated with OSMI-4 (50 μM) or TMG (50 μM) for 24 hours. Mitomycin C was used to inhibit the impact of cell proliferation. Representative and quantified results of the wound-healing (A; scale bar, 200 μm), Transwell (B, scale bar, 100 μm) and adhesion (C; scale bar, 100 μm) assays in FOXA1WT- or FOXA13A-expressing breast cancer cells are shown. (A and B) n = 3 biologically independent experiments. (C) n = 6 biologically independent experiments. (D and E) The migration and invasion abilities were analyzed and quantified by Transwell assays in FOXA1WT- or FOXA13A-expressing breast cancer cells (MCF-7 FOXA1 KO and MDA-MB-231; scale bar, 100 μm). Cells were transfected with MECP2 (D) or EPB41L3 (E) shRNA (shMECP2 and shEPB41L3) or scrambled shRNA (control) for 48 hours before the assays. Mitomycin C was used to inhibit the impact of cell proliferation. n = 3 biologically independent experiments. (F) FOXA1 immunoprecipitation was performed in five breast cancer patient tumor samples, and immunoprecipitated fractions were analyzed by WB. The pathological grade and the patient no. are indicated.
Fig. 8.
Fig. 8.. FOXA1 O-GlcNAcylation promotes oncogenesis and metastasis of breast cancer in vivo.
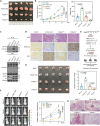
(A and B) Elimination of FOXA1 O-GlcNAcylation diminished xenograft tumor formation in vivo. WT MCF-7, MCF-7 FOXA1 KO, FOXA1WT, or FOXA13A MCF-7 FOXA1 KO cells were injected subcutaneously into the axillae of nude mice (n = 5 for each group). Mice were euthanized after 24 days, and their tumor masses were excised (A), measured and weighed (B). (C) HA-FOXA1 immunoprecipitation was performed with anti-HA-tag magnetic beads using xenograft tumor samples in each group, and the immunoprecipitated fractions were analyzed by WB. (D) Xenograft tumor samples were subjected to H&E, EPB41L3, and Ki67 staining. One representative experiment of n = 3 independent experiments is shown. Scale bar, 100 μm. (E) Schematics for tail vein injection of breast cancer cells in nude mice to generate experimental pulmonary metastasis. (F) MCF-7, MCF-7 FOXA1 KO, FOXA1WT, or FOXA13A MCF-7 FOXA1 KO cells were intravenously injected into the tail vein of nude mice (n = 5 for each group). Three weeks later, the animals were anesthetized, injected with luciferin, and imaged for luciferase activity every week. One representative image is shown. The fluorescence intensity represents the sizes of the breast cancer metastases. P values are indicated. (G) Gross appearances of lungs with tumors and numbers of tumor nodules. The blue dotted-line circles represent tumors (n = 5 for each group). (H) H&E staining of sections of metastasized lungs. Scale bar, 500 μm.
Fig. 9.
Fig. 9.. Schematic working model of FOXA1 O-GlcNAcylation–mediated breast cancer metastasis.
O-GlcNAcylation at T432/S441/S443 shapes the FOXA1 interactome, especially triggers the recruitment of transcriptional repressor MECP2, consequently stimulates FOXA1 chromatin-binding sites switch to chromatin loci of adhesion-related genes, including EPB41L3 and COL9A2, and thus promotes breast cancer proliferation and metastasis both in vitro and in vivo.

References

    1. S. Gao, S. Chen, D. Han, Z. Wang, M. Li, W. Han, A. Besschetnova, M. Liu, F. Zhou, D. Barrett, Chromatin binding of FOXA1 is promoted by LSD1-mediated demethylation in prostate cancer. Nat. Genet. 52, 1011–1017 (2020). - PMC - PubMed
    1. M. Teng, S. Zhou, C. Cai, M. Lupien, H. H. He, Pioneer of prostate cancer: Past, present and the future of FOXA1. Protein Cell 12, 29–38 (2021). - PMC - PubMed
    1. K. M. Jozwik, J. S. Carroll, Pioneer factors in hormone-dependent cancers. Nat. Rev. Cancer 12, 381–385 (2012). - PubMed
    1. M. A. Augello, T. E. Hickey, K. E. Knudsen, FOXA1: Master of steroid receptor function in cancer. EMBO J. 30, 3885–3894 (2011). - PMC - PubMed
    1. S.-E. Glont, I. Chernukhin, J. S. Carroll, Comprehensive genomic analysis reveals that the pioneering function of FOXA1 is independent of hormonal signaling. Cell Rep. 26, 2558–2565.e2553 (2019). - PMC - PubMed