. 2023 Aug 18;9(33):eadh3693.
doi: 10.1126/sciadv.adh3693. Epub 2023 Aug 18.

Contemporary ice sheet thinning drives subglacial groundwater exfiltration with potential feedbacks on glacier flow

Affiliations

Contemporary ice sheet thinning drives subglacial groundwater exfiltration with potential feedbacks on glacier flow

Alexander A Robel et al. Sci Adv. .

Abstract

Observations indicate that groundwater-laden sedimentary aquifers are extensive beneath large portions of the Greenland and Antarctic ice sheets. A reduction in the mechanical loading of aquifers is known to lead to groundwater exfiltration, a discharge of groundwater from the aquifer. Here, we provide a simple expression predicting exfiltration rates under a thinning ice sheet. Using contemporary satellite altimetry observations, we predict that exfiltration rates may reach tens to hundreds of millimeters per year under the fastest thinning parts of the Antarctic Ice Sheet. In parts of West Antarctica, predicted rates of exfiltration would cause the total subglacial water discharge rate to be nearly double what is currently predicted from subglacial basal melting alone. Continued Antarctic Ice Sheet thinning into the future guarantees that the rate and potential importance of exfiltration will only continue to grow. Such an increase in warm, nutrient-laden subglacial water discharge would cause changes in ice sliding, melt of basal ice and marine biological communities.


Figures
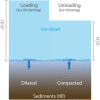
Fig. 1.
Fig. 1.. Illustration of exfiltration and infiltration processes.
Illustration explains how exfiltration or infiltration of groundwater occurs due to unloading or loading of ice sheets over saturated subglacial sediment half-space. At the ice-sediment interface, z = 0 and z increases down into sediment.
Fig. 2.
Fig. 2.. Exfiltration rate evolution in response to a constant ice sheet thinning rate, stopping after 20 years.
Exfiltration rate as a function of time simulated numerically in the hydromechanical model (black crosses; Eqs. 1 to 3). Solid lines show the exfiltration predicted by a closed form theory when ice thinning rate is constant (qc, blue solid line) and for a step change in ice sheet thickness (qd, red line). This simulation assumes that k = 10−15 m2, S = 10−6 m−1, ξ = 0.2, ρi = 920 kg/m3, ρw = 1000 kg/m3, μw = 10−3 Pa·s, g = 9.81 m/s2, and ∂Hi/∂t = 5 m/a for the first 20 years of the simulation (gray shaded region). Numerical details are discussed in Materials and Methods.
Fig. 3.
Fig. 3.. Predicted contemporary exfiltration rates under the Antarctic Ice Sheet for different sediment permeabilities.
Map of predicted exfiltration rate due to ice sheet thinning estimated by ICESat and ICESat-2 from 2003 to 2019, assuming sediment permeabilities of (A) k = 10−13 m2, (B) k = 10−15 m2, and (C) k = 10−17 m2. These predictions assume S = 10−6 m −1, ξ = 0.2, ρi = 920 kg/m3, ρw = 1000 kg/m3, μw = 10−3 Pa·s, and g = 9.81 m/s2. Negative values in all panels indicate infiltration due to ice sheet thickening. In (A), regions discussed in text are labeled: ASE, Amundsen Sea Embayment; WL, Wilkes Land; KIS, Kamb Ice Stream; QML, Queen Maud Land.
Fig. 4.
Fig. 4.. Predicted fraction of local basal water budget due to exfiltration or infiltration.
Map of predicted fraction of local basal water budget due to exfiltration or infiltration, using predictions from Fig. 3 using ice-sheet-wide basal melt rate estimate from Pattyn et al. (28). As in Fig. 3, panels correspond to different permeability values: (A) k = 10−13 m2, (B) k = 10−15 m2, and (C) k = 10−17 m2. Negative values in all panels indicate infiltration due to ice sheet thickening.

References

    1. Clarke G. K., Subglacial processes. Annu. Rev. Earth Planet. Sci. 33, 247–276 (2005).
    1. Schoof C., Ice-sheet acceleration driven by melt supply variability. Nature 468, 803–806 (2010). - PubMed
    1. Sommers A., Rajaram H., Morlighem M., SHAKTI: Subglacial hydrology and kinetic, transient interactions v1. 0. Geosci. Model Dev. 11, 2955–2974 (2018).
    1. Bougamont M., Price S., Christoffersen P., Payne A., Dynamic patterns of ice stream flow in a 3-D higher-order ice sheet model with plastic bed and simplified hydrology. J. Geophys. Res. Earth Surf. 116, F04018 (2011).
    1. Tulaczyk S., Kamb B., Engelhardt H., Basal mechanics of Ice Stream B, West Antarctica: 2. Undrained plastic bed model. J. Geophys. Res. Solid 105, 483–494 (2000).