. 2023 Oct 26;142(17):1448-1462.
doi: 10.1182/blood.2023021120.

Genome-wide transcription factor-binding maps reveal cell-specific changes in the regulatory architecture of human HSPCs

Affiliations

Genome-wide transcription factor-binding maps reveal cell-specific changes in the regulatory architecture of human HSPCs

Shruthi Subramanian et al. Blood. .

Abstract

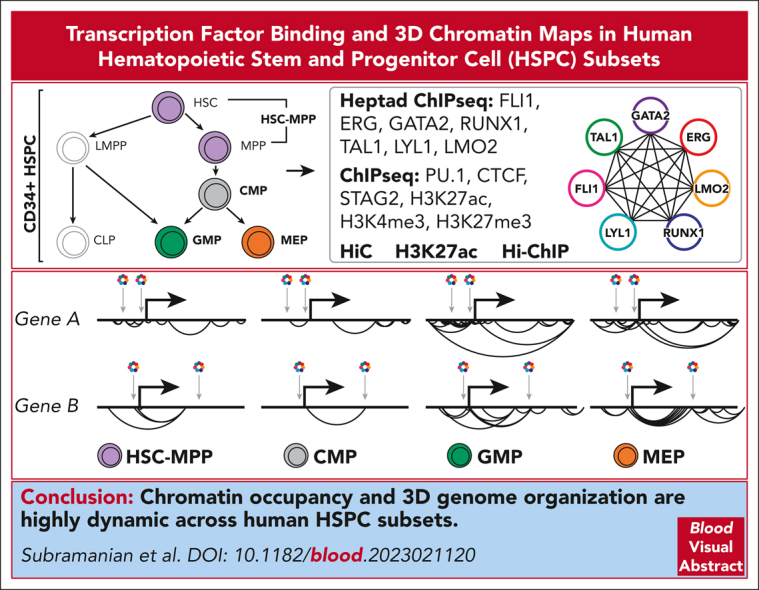
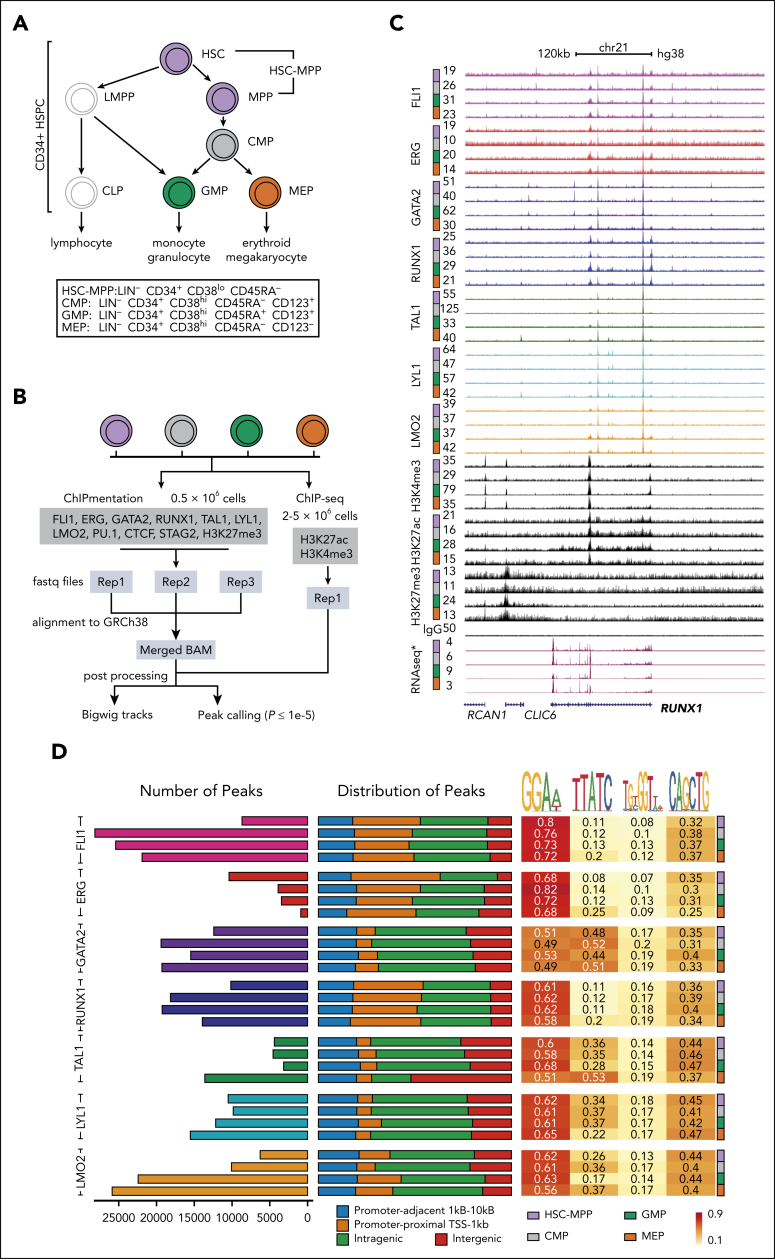
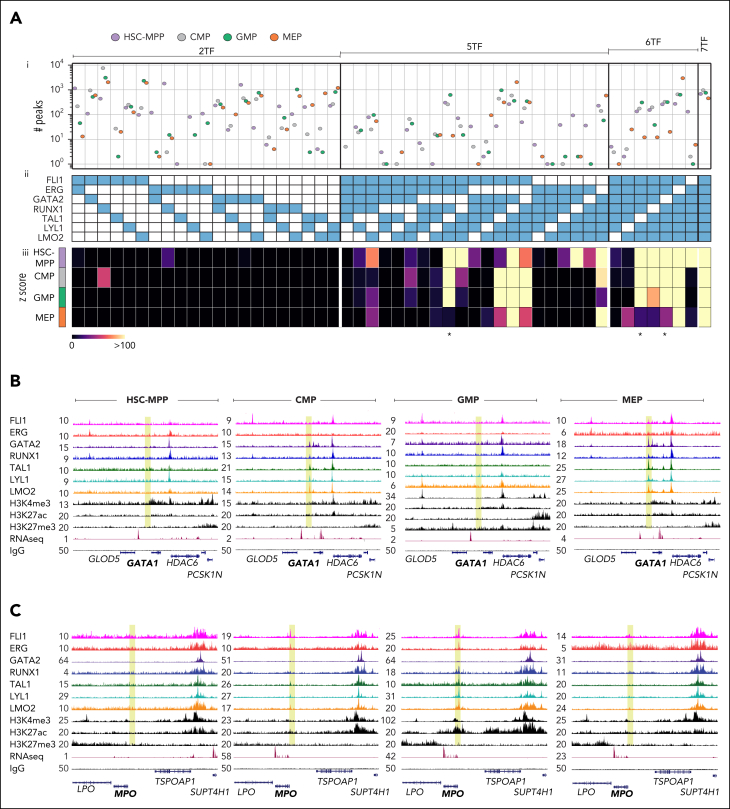
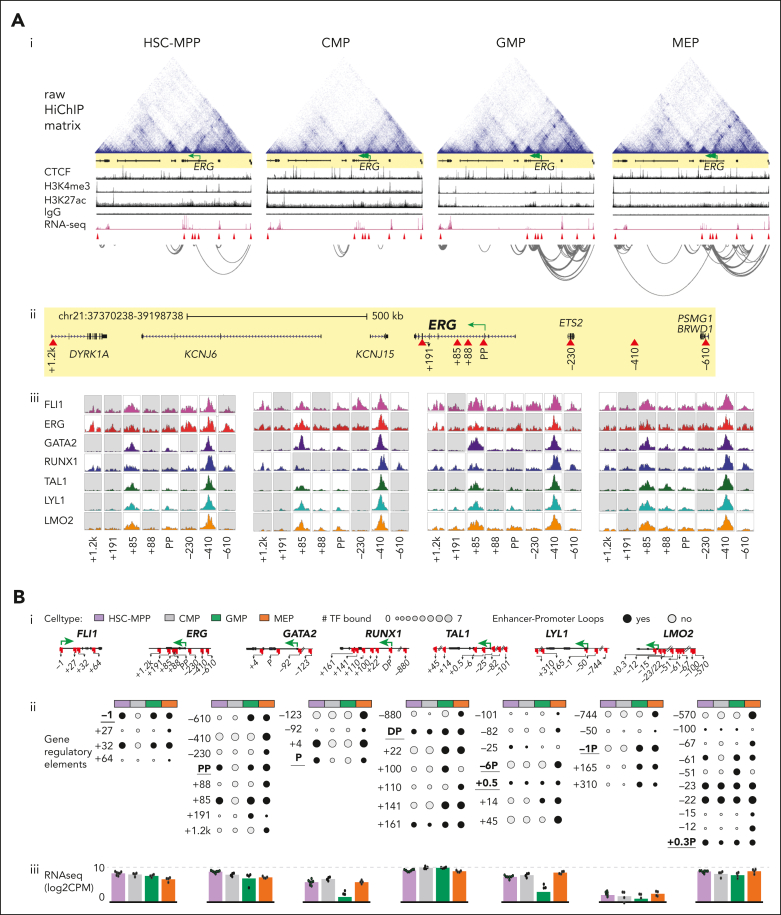
Hematopoietic stem and progenitor cells (HSPCs) rely on a complex interplay among transcription factors (TFs) to regulate differentiation into mature blood cells. A heptad of TFs (FLI1, ERG, GATA2, RUNX1, TAL1, LYL1, LMO2) bind regulatory elements in bulk CD34+ HSPCs. However, whether specific heptad-TF combinations have distinct roles in regulating hematopoietic differentiation remains unknown. We mapped genome-wide chromatin contacts (HiC, H3K27ac, HiChIP), chromatin modifications (H3K4me3, H3K27ac, H3K27me3) and 10 TF binding profiles (heptad, PU.1, CTCF, STAG2) in HSPC subsets (stem/multipotent progenitors plus common myeloid, granulocyte macrophage, and megakaryocyte erythrocyte progenitors) and found TF occupancy and enhancer-promoter interactions varied significantly across cell types and were associated with cell-type-specific gene expression. Distinct regulatory elements were enriched with specific heptad-TF combinations, including stem-cell-specific elements with ERG, and myeloid- and erythroid-specific elements with combinations of FLI1, RUNX1, GATA2, TAL1, LYL1, and LMO2. Furthermore, heptad-occupied regions in HSPCs were subsequently bound by lineage-defining TFs, including PU.1 and GATA1, suggesting that heptad factors may prime regulatory elements for use in mature cell types. We also found that enhancers with cell-type-specific heptad occupancy shared a common grammar with respect to TF binding motifs, suggesting that combinatorial binding of TF complexes was at least partially regulated by features encoded in DNA sequence motifs. Taken together, this study comprehensively characterizes the gene regulatory landscape in rare subpopulations of human HSPCs. The accompanying data sets should serve as a valuable resource for understanding adult hematopoiesis and a framework for analyzing aberrant regulatory networks in leukemic cells.


Conflict of interest statement

Conflict-of-interest disclosure: The authors declare no competing financial interests.

Figures

None
Graphical abstract
Figure 1.
Figure 1.
Genome-wide patterns of heptad TF binding in fractionated primary human HSPCs. (A) Human MNCs were isolated from granulocyte-colony stimulating factor–stimulated donors or patients with a nonhematologic malignancy before being enriched for CD34 expression using magnetic-activated cell sorting (MACS) and further subfractionated into individual stem and progenitor cells based on surface marker expression using fluorescence-activated cell sorting (FACS) (colored cells are those studied in this manuscript). (B) The workflow and analysis pipeline followed for ChIPmentation and ChIP-seq experiments. (C) UCSC browser track at the RUNX1 locus (GRCh38 chr21:34,627,969-35,209,177) showing the reads per kilobase of transcript, per million mapped reads (RPKM)-normalized signal from FLI1, ERG, GATA2, RUNX1, TAL1, LYL1, and LMO2, along with H3K4me3, H3K27ac, H3K27me3, immunoglobulin G (IgG) (control), and publicly available RNA-seq tracks (GSE75384) for the 4 cell types. Full UCSC browser tracks are available http://genome.ucsc.edu/s/PimandaLab/Heptad_Regulome. (D) Characterization of identified peaks. Number of TF peaks were identified by macs2 (P value ≤ 1e−5) and their overall distribution along the genome (as percentages of total peaks identified) is shown. Each peak was assigned as either promoter-like (proximal [orange] or adjacent [blue], based on its distance from the TSS), intragenic [green], or intergenic [red], and enrichment (fraction of peaks containing that motif) calculated for the known ETS, GATA, RUNX, and E-Box motifs.
Figure 2.
Figure 2.
Combinatorial binding of heptad TFs is cell-type specific. (A) A composite graph with 3 components: (i) number of combinatorial binding peaks identified in the 4 cell types, for (ii) combinations of 2, 5, 6, and 7 heptad factors and (iii) heatmap showing z scores for the combinations presented in panel Aii. Star indicates combinations lacking GATA2 and/or TAL1. (B-C) UCSC browser tracks showing RPKM-normalized signal tracks of the heptad factors, H3K4me3, H3K27ac, H3K27me3, RNA-seq (public data: GSE75384), and IgG (control) in HSC-MPP, CMP, GMP, and MEP (left to right), at (B) the GATA1 locus (GRCh38 chrX:48,724,037-48,839,866), a gene vital for erythroid lineage specification, and at (C) the MPO locus (GRCh38 chr17:58,238,087-58,348,896), a gene specific to the monocytic lineage.
Figure 3.
Figure 3.
Heptad regulatory circuits are remodeled during myeloid progenitor development. (A) Stepwise identification of potential regulatory regions interacting with the ERG promoter. (i) Raw HiChIP contact matrix, CTCF, H3K4me3, H3K27ac, IgG, RNA-seq, and significant H3K27ac HiChIP interactions (false discovery rate [FDR] ≤ 0.01) at the ERG locus (GRCh38 chr21:37370238-39198738). The ERG promoter is indicated by the green arrow (only those HiChIP interactions where both interacting ends were found at the given locus are shown). (ii) Magnified view of the ERG locus, with regulators identified to loop to the ERG proximal promoter shown as red triangles. (iii) FLI1, ERG, GATA2, RUNX1, TAL1, LYL1, and LMO2 peaks at the defined regulators in each individual cell type. The peaks shown are RPKM-normalized and white boxes indicate presence of a computationally called ChIP-seq peak at the specific region. (B) Summary plot of gene regulatory interactions across the heptad genes. (i) Individual heptad gene loci with identified regulators indicated by red markers. (ii) Dot plots showing regulatory regions as rows and the 4 cell types as columns, with size of the dot indicating number of heptad factors bound and black color indicating the presence of an active regulatory link to the promoter (using H3K27ac HiChIP). Promoters are underlined. (iii) Bar plots with individual replicates showing average log2 counts of relevant heptad gene expression in the 4 cell types (GSE75384).
Figure 4.
Figure 4.
The role of heptad TFs in regulating lineage-specific gene expression. (A) Schematic of the bioinformatic strategy used to derive regions showing differential heptad factor binding: (i) Candidate regulatory elements (REs) with binding of at least 2 heptad factors were chosen in the 4 cell types; and (ii) DiffBind was used to filter for regions showing differential enrichment for heptad factors with an FDR <0.05. To perform DiffBind analysis only HSC-MPP (HSC), GMP, and MEP populations were chosen. (iii) These DEH regions were linked to genes either directly (present across a 10 kb promoter region) or indirectly (distal links using significant [FDR <0.01] H3K27ac- HiChIP interactions), and (iv) used as input for multiple characterization assays. (B) Gene set enrichment analysis (GSEA) plots showing enrichment of derived gene sets in pairwise gene expression comparisons: (i) DEHGHSC (genes linked to DEH regions in HSC-MPP) enriched in HSC-MPP with respect to GMP, (ii) DEHGGMP enriched in GMP with respect to HSC-MPP, (iii) DEHGHSC enriched in HSC-MPP with respect to MEP, and (iv) DEHGMEP enriched in MEP with respect to HSC-MPP. (C) Scoring cell-specific DEHGs along a (i) single-cell expression map reveals localized enrichment of expression: (ii) DEHGHSC, (iii) DEHGGMP, and (iv) DEHGMEP. ES, enrichment score; NES, normalized enrichment score; q, FDR q value from GSEA.
Figure 5.
Figure 5.
Heptad TFs at promoters and distal regulators of genes crucial for myeloid and erythroid cell development. (A) Genes associated with myeloid development. Left: k-means clustered heatmaps of TF binding intensity at promoters and distal regulatory regions. Profile plots show normalized signal for each TF in each cell type at the regions depicted in the heatmap. Right: z score normalized heatmaps of RNA-seq counts (GSE75384) for the corresponding gene in each cell type. White rows are genes with no expression values in the data set. (B) Genes associated with erythroid development. Left: k-means clustered heatmaps of TF binding intensity at promoters and distal regulatory regions. Profile plots show normalized signal for each TF in each cell type at the regions depicted in the heatmap. Right: z score normalized heatmaps of RNA-seq counts (GSE75384) for the corresponding gene in each cell type.
Figure 6.
Figure 6.
Regulatory regions with cell-type-specific heptad occupancy have distinct epigenetic features. (A) A Uniform Manifold Approximation and Projection (UMAP) depicting the result of clustering 85 100 accessible regions in HSPCs annotated with ChIPmentation/ChIP-seq signal strengths using the Louvain algorithm. (B) Individual violin plots of log normalized signal derived from ATAC, 3 histone marks (H3K27ac, H3K4me3, and H3K27me3), and CTCF, accompanied by a bar plot showing the number of regions in each cluster. Intercluster signal variability allows annotation of individual clusters based on their regulatory potential. (C) UMAPs overlaid with ChromHMM annotation of 85 100 individual regions show striking similarity to annotations shown in Figure 6B. (D) UMAPs colored based on log2 fold change of binding of the heptad TFs in pairwise comparisons between GMP and MEP. MEP- and GMP-specific enrichment of TF binding is identified, and borders demarcated by dashed lines: black (enriched in MEP) or gray (enriched in GMP). (E) Signal of PU.1 in dendritic cells (DC) (GSE58864) across the clustered regions. PU.1 signal enrichment in dendritic cells mirrors heptad factor enrichment patterns in GMP. (F) Signal of GATA1 in proerythroblasts (ProE) (GSE36985) across the clustered regions. GATA1 signal enrichment in proerythroblasts mirrors heptad factor enrichment patterns at these regions in MEP.
Figure 7.
Figure 7.
Cell-type specificity of regulatory elements is encoded in the underlying motif composition. (A) (i) UMAP representation of ATAC-seq regions in CD34+ cells (gray) with heptad TF bound HSC-MPP specific regions colored in purple. (ii) An XGBoost machine learning model was trained and tested with motif counts from a mixture of regions specified in panel Ai and background regions, to predict cell type with high accuracy. The receiver operating characteristic (ROC) curve shows the predictive performance of the constructed model to predict HSC-MPP specific regions. (iii) A beeswarm plot depicting the top 12 representative motifs in HSC-MPP specific regions, ranked based on their absolute importance in contributing to the predictive model. Each row shows the motif (and canonical TF family if known), and the corresponding SHAP values for the cell type in question (right) and the others (left). The feature count indicates the normalized motif counts with a range of 0 to 1. (B) (i) UMAP representation of ATAC-seq regions in CD34+ cells (gray) with heptad TF bound GMP specific regions colored in green. (ii) ROC curve showing the performance of the model to predict GMP specific regions. (iii) A beeswarm plot depicting the top 12 representative motifs in GMP specific regions, ranked based on their absolute importance in contributing to the predictive model. (C) (i) UMAP representation of ATAC-seq regions in CD34+ cells (gray) with heptad TF bound MEP specific regions colored in orange. (ii) ROC curve showing the performance of the model to predict MEP specific regions. (iii) A beeswarm plot depicting the top 12 representative motifs in MEP specific regions, ranked based on their absolute importance in contributing to the predictive model.

Comment in

References

    1. Doulatov S, Notta F, Laurenti E, Dick JE. Hematopoiesis: a human perspective. Cell Stem Cell. 2012;10(2):120–136. - PubMed
    1. Laurenti E, Gottgens B. From haematopoietic stem cells to complex differentiation landscapes. Nature. 2018;553(7689):418–426. - PMC - PubMed
    1. Setty M, Kiseliovas V, Levine J, Gayoso A, Mazutis L, Pe'er D. Characterization of cell fate probabilities in single-cell data with Palantir. Nat Biotechnol. 2019;37(4):451–460. - PMC - PubMed
    1. Corces MR, Buenrostro JD, Wu B, et al. Lineage-specific and single-cell chromatin accessibility charts human hematopoiesis and leukemia evolution. Nat Genet. 2016;48(10):1193–1203. - PMC - PubMed
    1. Novershtern N, Subramanian A, Lawton LN, et al. Densely interconnected transcriptional circuits control cell states in human hematopoiesis. Cell. 2011;144(2):296–309. - PMC - PubMed

MeSH terms

Substances