. 2023 Aug 17;83(16):3010-3026.e8.
doi: 10.1016/j.molcel.2023.07.017.

FAM120A couples SREBP-dependent transcription and splicing of lipogenesis enzymes downstream of mTORC1

Affiliations

FAM120A couples SREBP-dependent transcription and splicing of lipogenesis enzymes downstream of mTORC1

Sungyun Cho et al. Mol Cell. .

Abstract

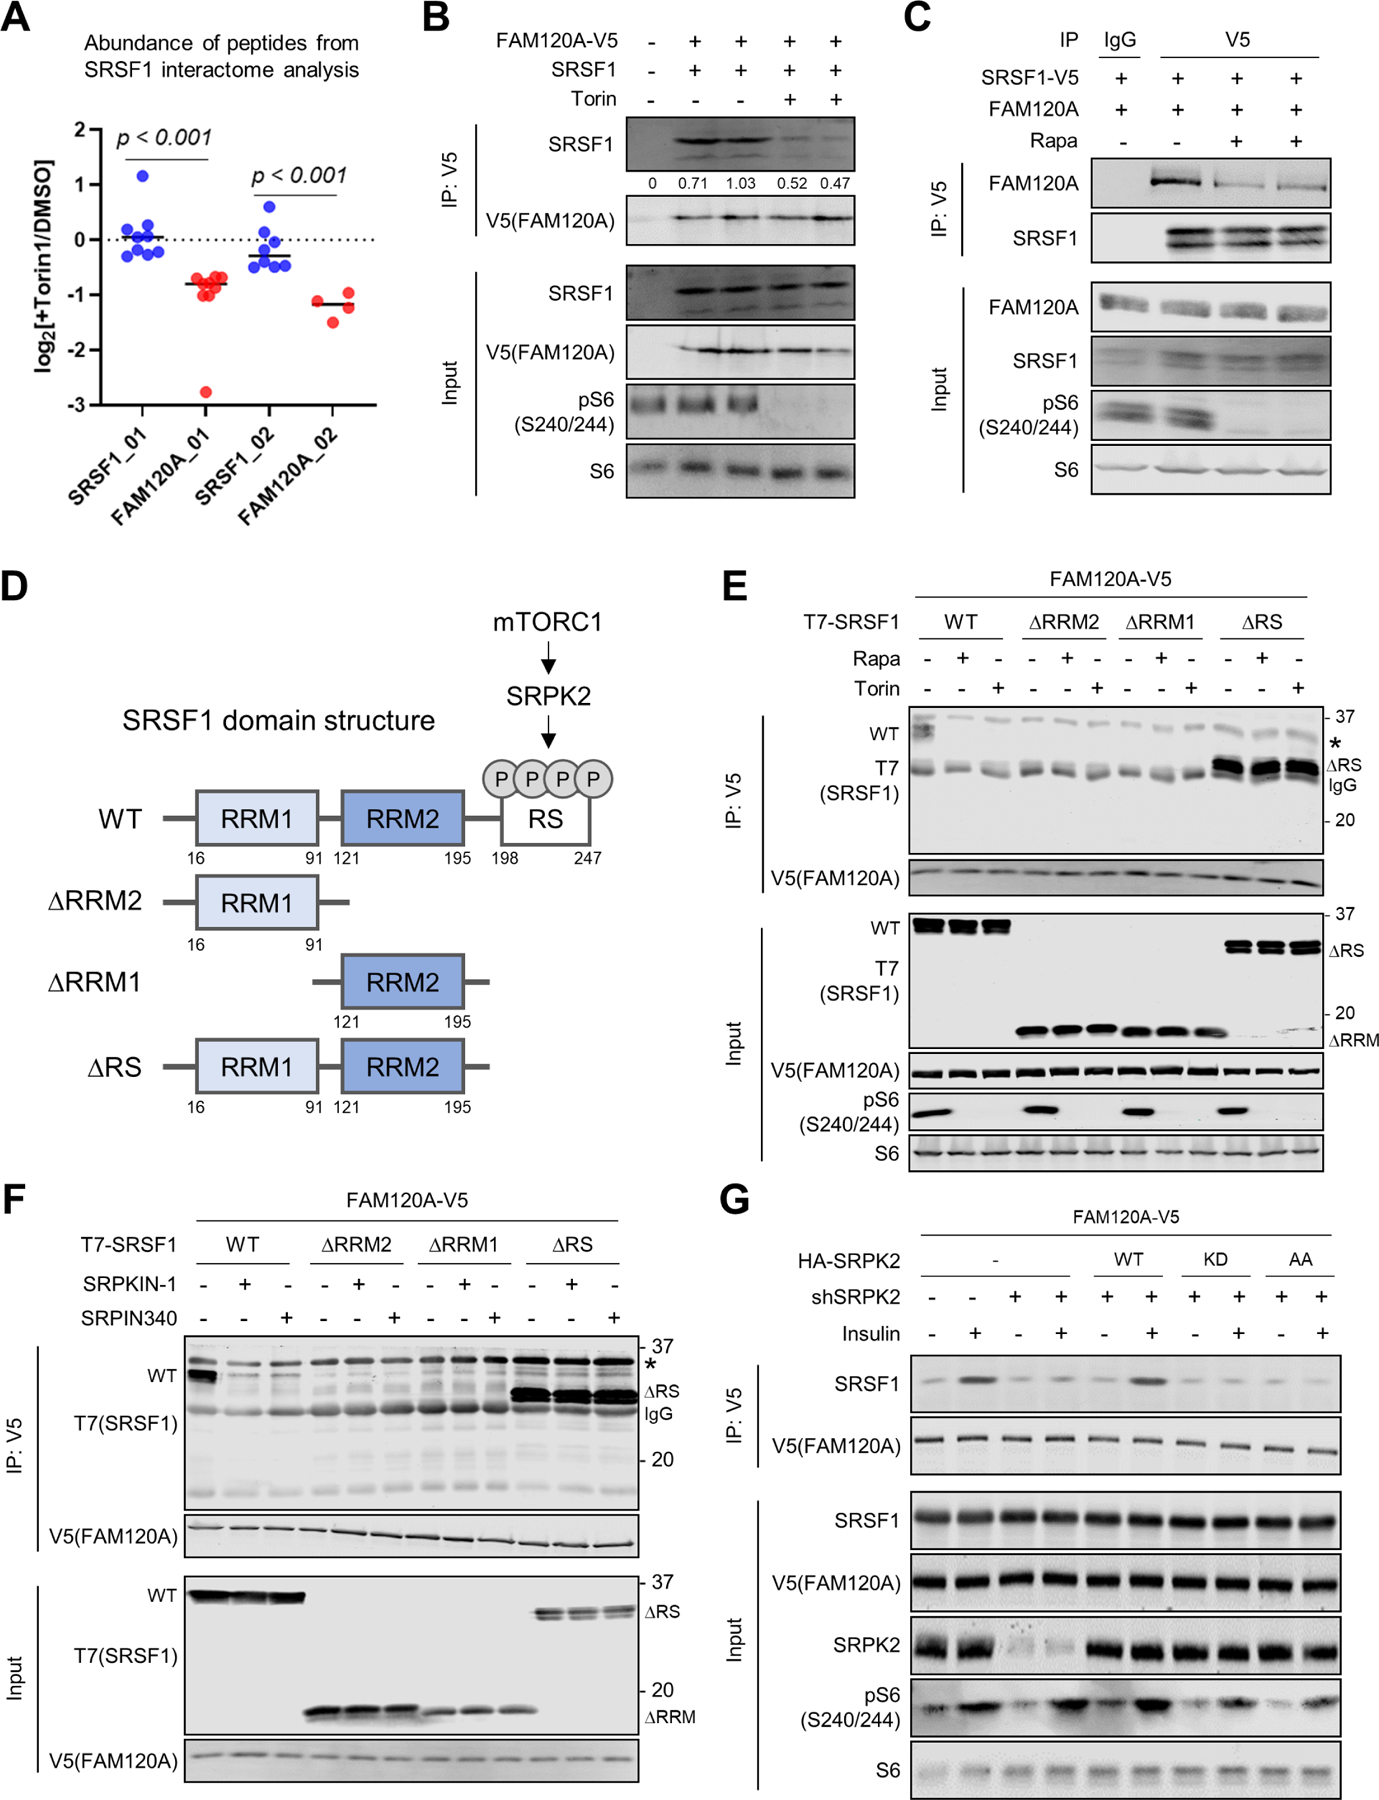
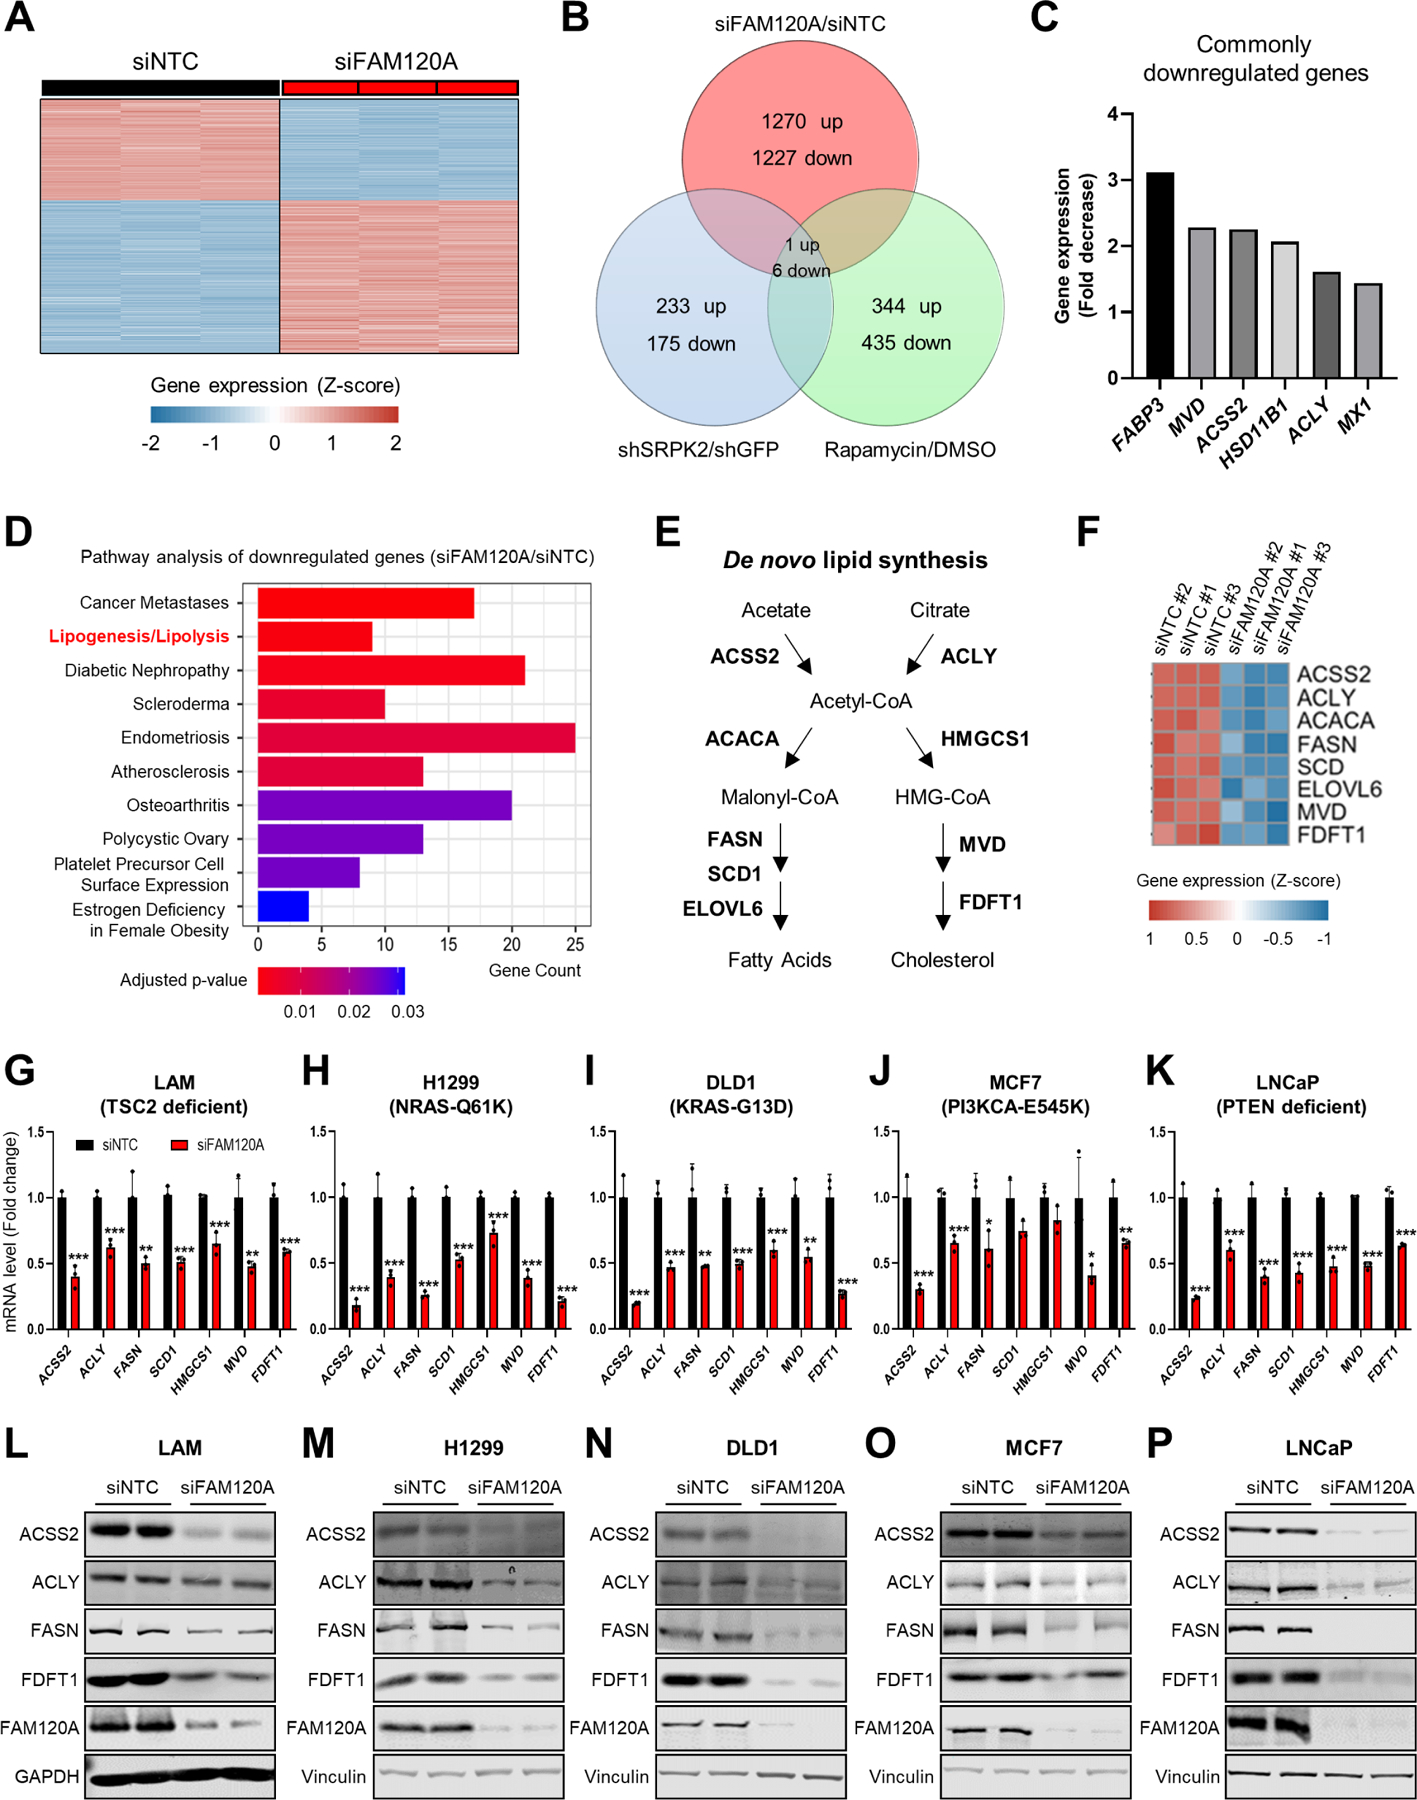
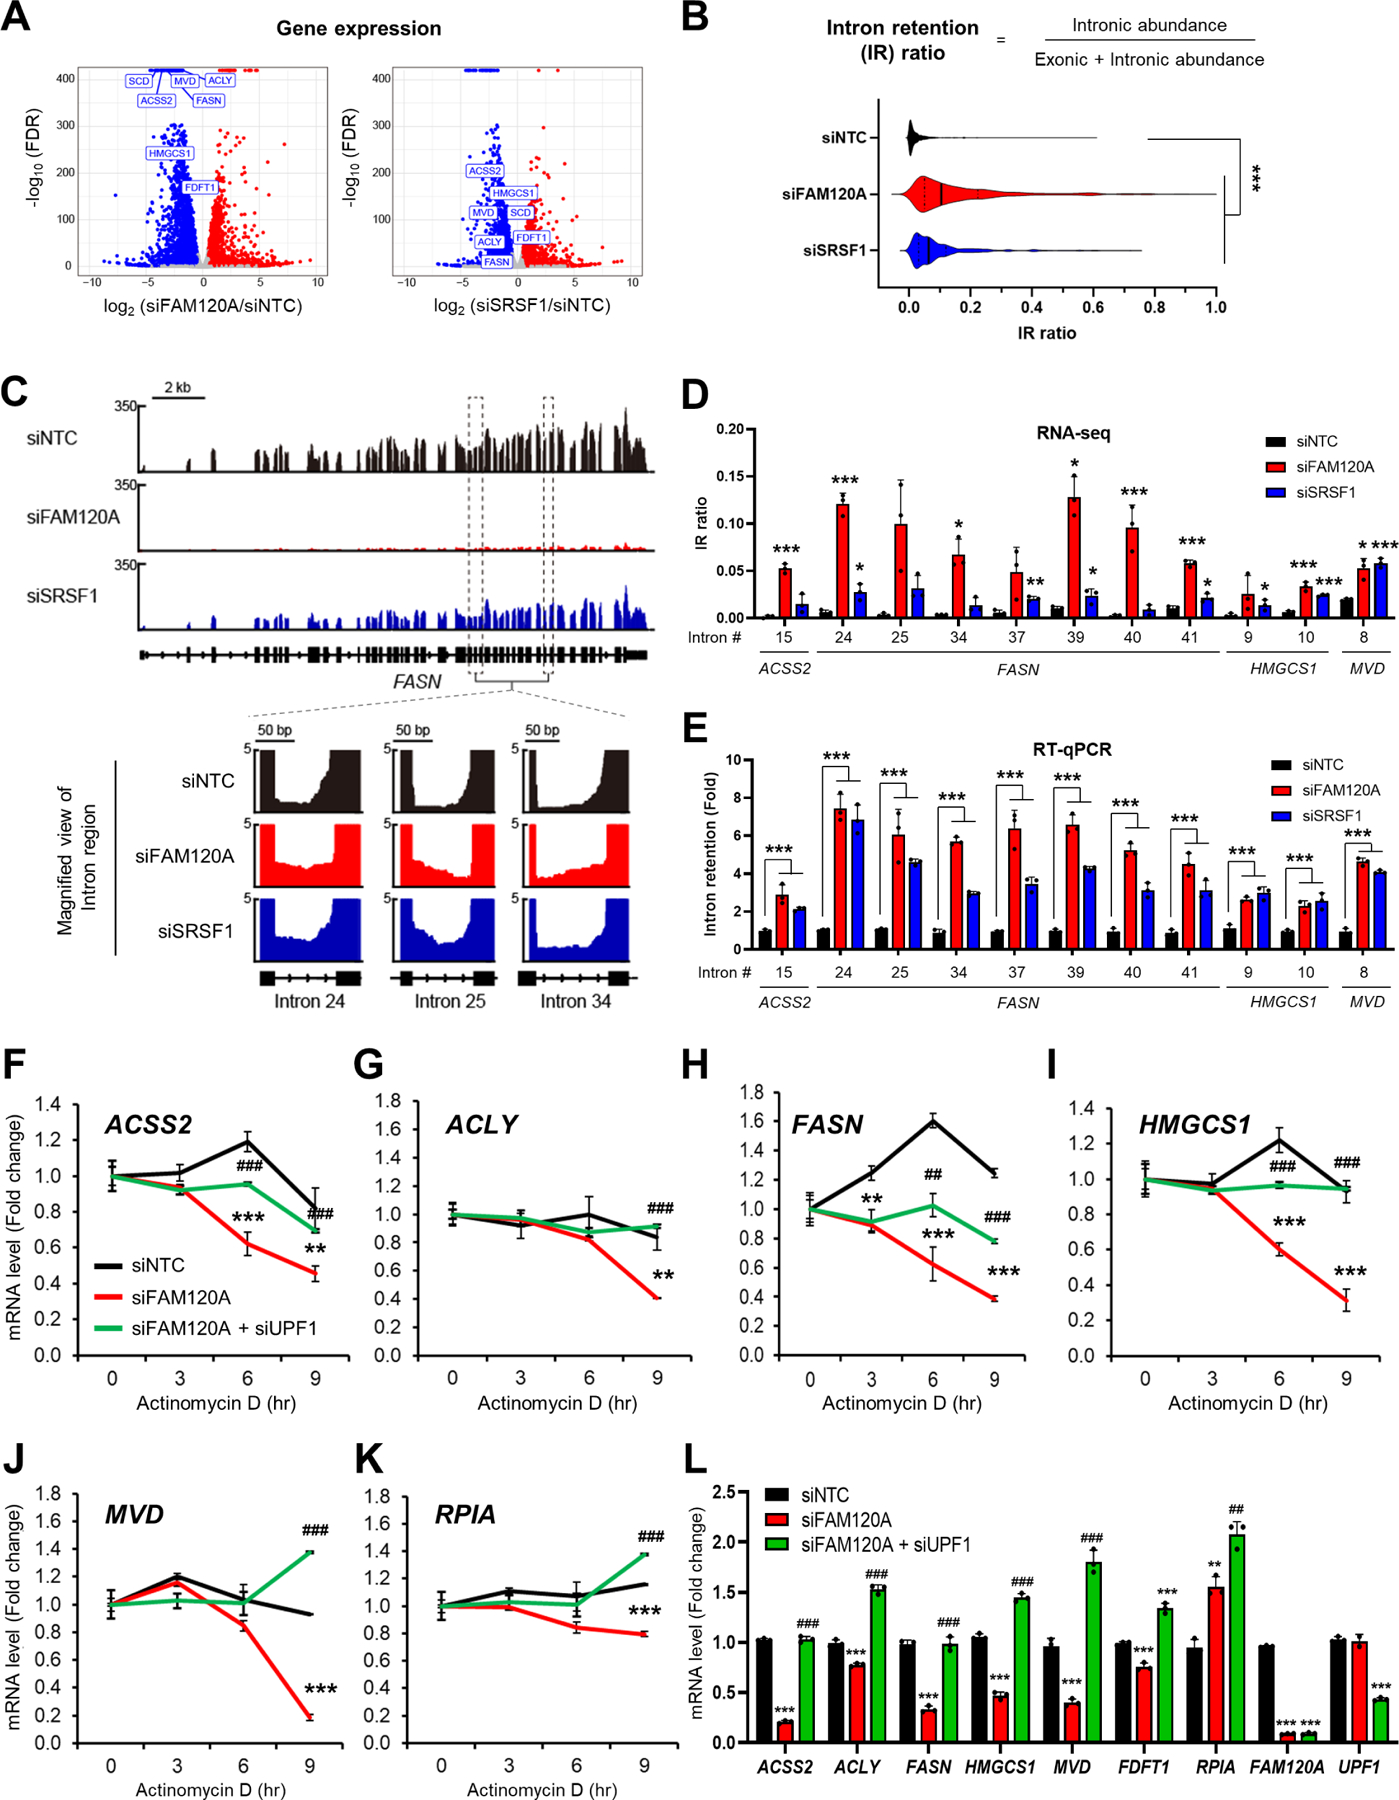
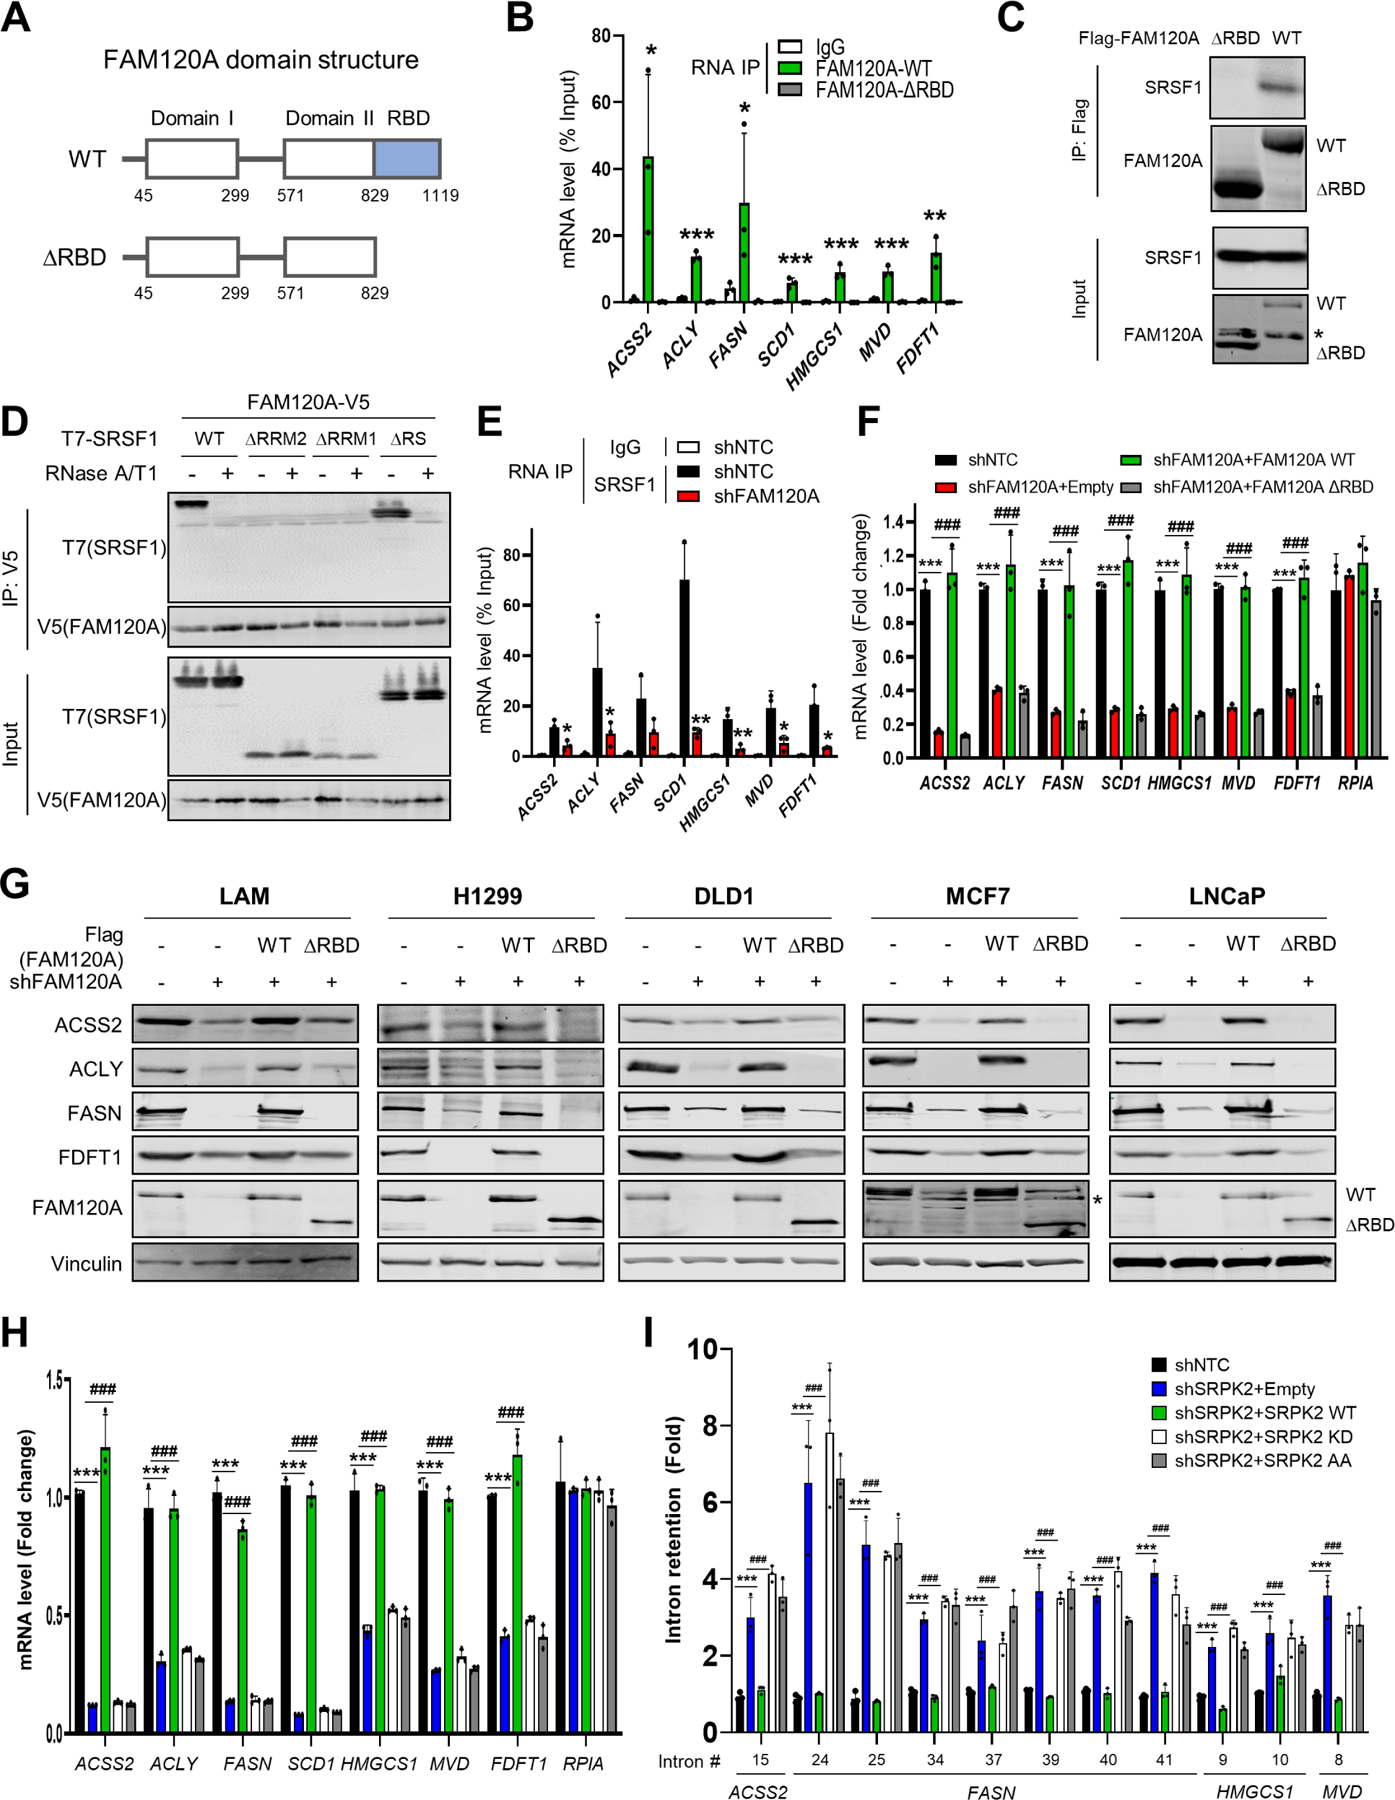
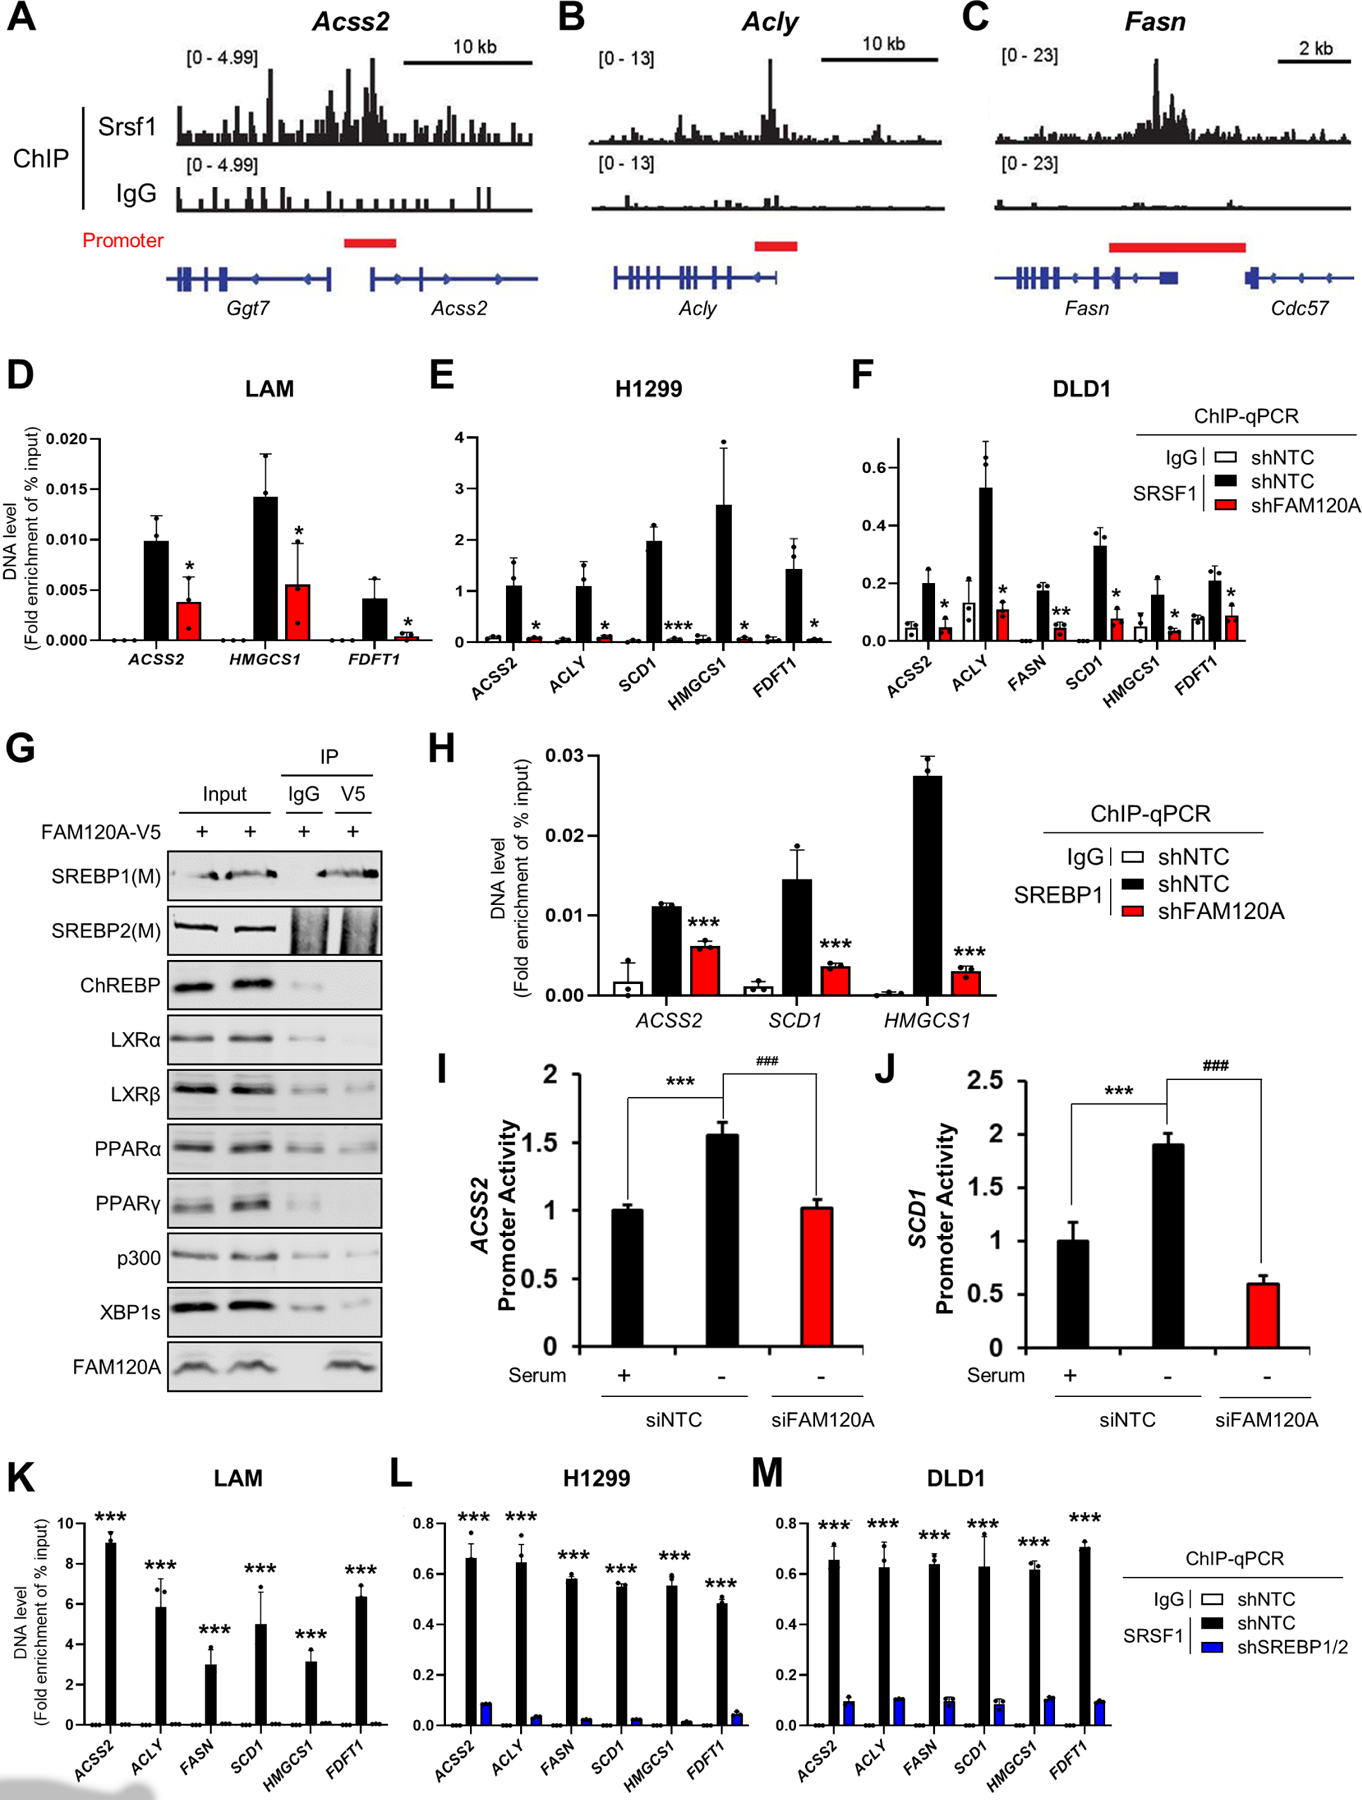
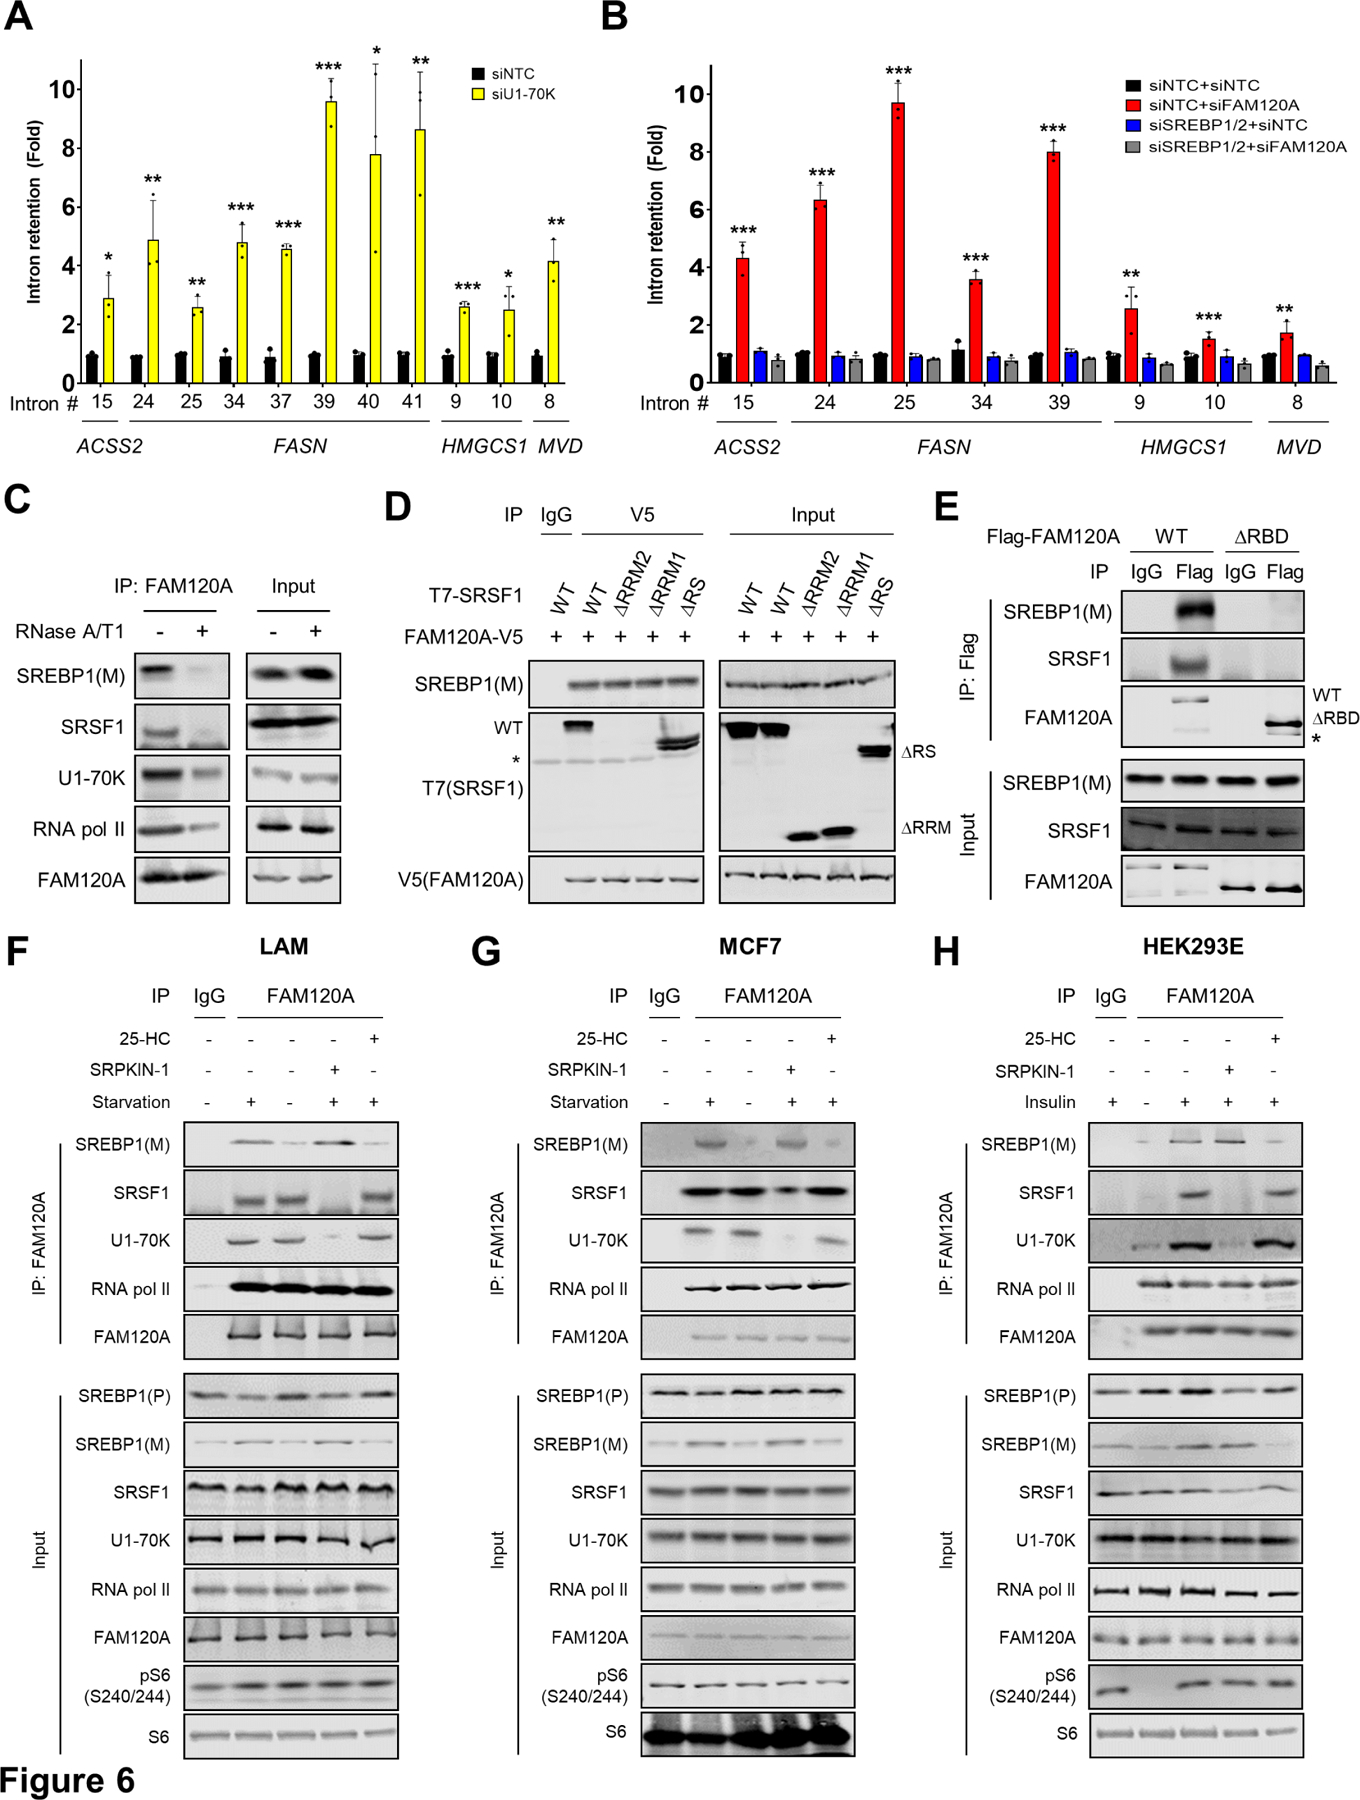
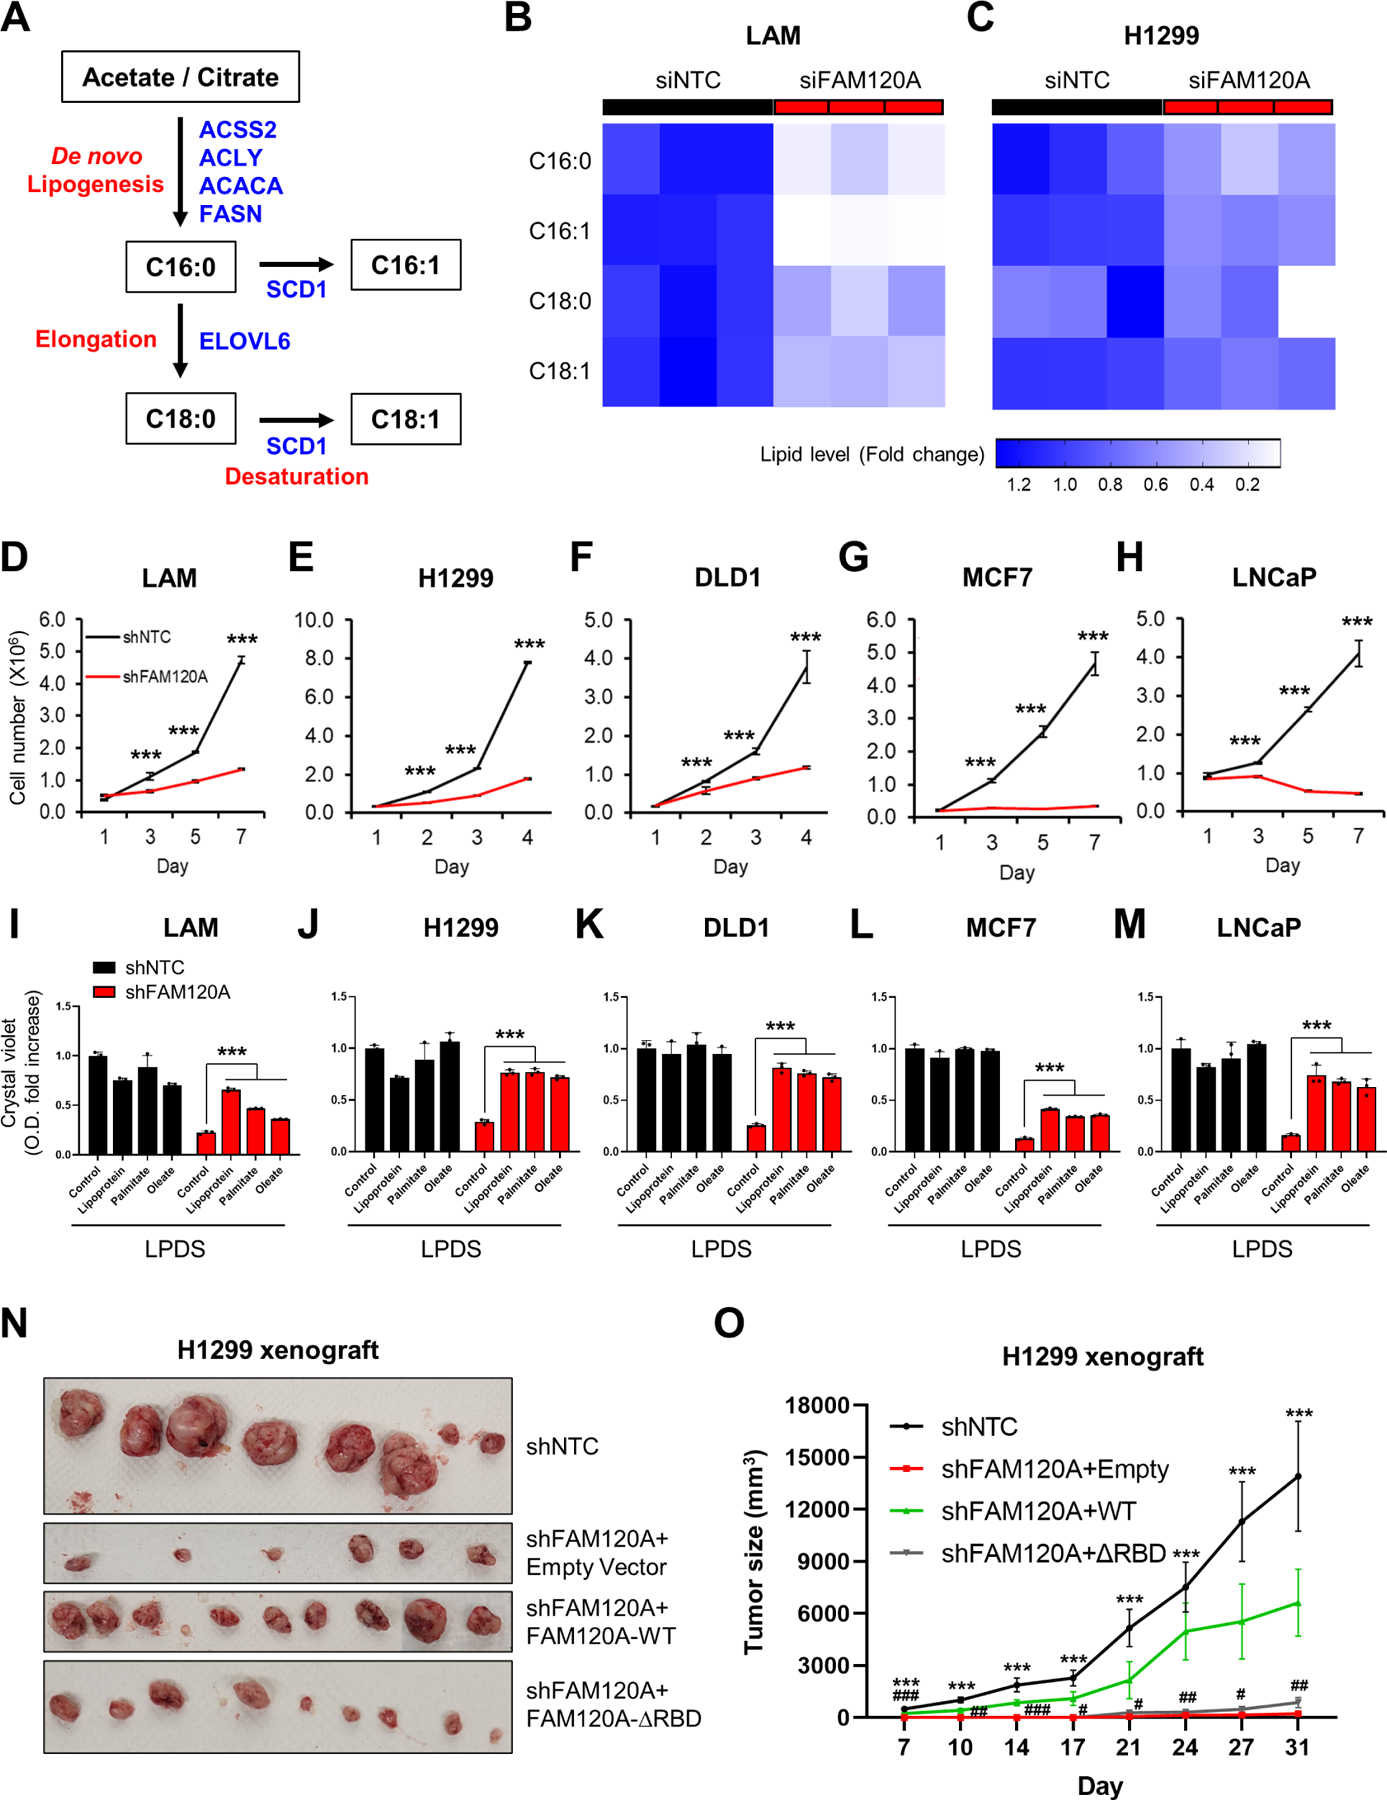
The mechanistic target of rapamycin complex 1 (mTORC1) is a master regulator of cell growth that stimulates macromolecule synthesis through transcription, RNA processing, and post-translational modification of metabolic enzymes. However, the mechanisms of how mTORC1 orchestrates multiple steps of gene expression programs remain unclear. Here, we identify family with sequence similarity 120A (FAM120A) as a transcription co-activator that couples transcription and splicing of de novo lipid synthesis enzymes downstream of mTORC1-serine/arginine-rich protein kinase 2 (SRPK2) signaling. The mTORC1-activated SRPK2 phosphorylates splicing factor serine/arginine-rich splicing factor 1 (SRSF1), enhancing its binding to FAM120A. FAM120A directly interacts with a lipogenic transcription factor SREBP1 at active promoters, thereby bridging the newly transcribed lipogenic genes from RNA polymerase II to the SRSF1 and U1-70K-containing RNA-splicing machinery. This mTORC1-regulated, multi-protein complex promotes efficient splicing and stability of lipogenic transcripts, resulting in fatty acid synthesis and cancer cell proliferation. These results elucidate FAM120A as a critical transcription co-factor that connects mTORC1-dependent gene regulation programs for anabolic cell growth.

Keywords: FAM120A; RNA splicing; RNA stability; SREBP; SRPK2; SRSF1; lipid metabolism; mTOR signaling.


Conflict of interest statement

Declaration of interests J.B. is an advisory board member for Molecular Cell.

Figures

Figure 1.
Figure 1.. mTORC1-SRPK promotes interaction of SRSF1 with FAM120A.
(A) Mass spectrometry analysis of peptides identified in the SRSF1 interactome. HEK293E cells expressing SRSF1-V5 were treated with DMSO or torin1 (250 nM) for 4 hr, and SRSF1-binding proteins were co-immunoprecipitated (Co-IP) by anti-V5 antibody. Each dot represents abundance of individual peptides (N = 4~9 for each protein) in log2[Torin1/DMSO]. Data are reanalyzed from a previous publication. (B, C) Co-IP analysis of HEK293E cells expressing FAM120A-V5 and SRSF1 (B) or FAM120A and SRSF1-V5 (C). Cells were treated with torin1 (250 nM) or rapamycin (100 nM) for 4 hr. 1% of total cell lysate was loaded as an input. (D) Schematic diagram describing mTORC1-SRPK2-dependent phosphorylation of SRSF1 and the domains of wild-type (WT) and mutant SRSF1 constructs. RRM: RNA recognition motif. RS: Arginine/serine-rich domain. (E, F) Co-IP analysis of HEK293E cells expressing FAM120A-V5 and T7-SRSF1 (WT or mutants). Cells were treated with torin1 (250 nM) (E) or SRPK inhibitors (SRPKIN-1, 5 µM; SRPIN340, 30 µM) (F) for 4 hr. 1% of total cell lysate was loaded as an input. IgG light chain (IgG, 25 kDa) and non-specific bands (asterisks) are indicated. (G) Co-IP analysis of HEK293E cells expressing FAM120A-V5 and HA-SRPK2 (WT (wild type), KD (kinase dead, SRPK2-K110M), or AA (non-phosphorylatable, SRPK2-S394A/S397A)). Endogenous SRPK2 was knocked down by shRNA targeting 3’UTR of SRPK2. Cells were serum starved overnight followed by insulin (100 nM) stimulation for 4 hr. 1% of total cell lysate was loaded as an input. See also Supplemental Figure S1.
Figure 2.
Figure 2.. FAM120A is required for the expression of lipogenic enzymes.
(A) Heatmap of z-scores for differentially expressed gene levels (cutoff: |Log2(Fold Change or FC)| ≥ 1, q-value < 0.005) in LAM 621–101 cells (hereinafter referred to as LAM cells) transfected with siRNAs targeting FAM120A or non-targeting control (NTC, hereinafter referred to as control) (GSE207172). N = 3. Same RNA-seq results are used in (A-F). (B) Venn diagram analysis of the differentially regulated genes (cutoff: Linear fold change ≥ 1.5) identified from the whole-transcriptome microarray and RNA-seq analyses in LAM cells. The gene expression analyses were conducted on cells treated with rapamycin (20 nM) or vehicle for 24 hr, on cells stably expressing shRNAs targeting SRPK2 or GFP (GSE104335)12, or on cells transfected with siRNAs targeting FAM120A or control (GSE207172). (C) Fold decrease of 6 commonly downregulated genes from the Venn diagram analysis in (B). Fold decrease values from siNTC vs. siFAM120A RNAseq analysis are shown. (D) Pathway analysis of downregulated genes by FAM120A knockdown. (E) Schematic of de novo lipogenesis. (F) Heatmap of z-scores for the lipogenic gene levels decreased by FAM120A knockdown. (G-K) QPCR analysis of LAM (G), H1299 (H), DLD1 (I), MCF7 (J), and LNCaP (K) cells transfected with siRNAs targeting FAM120A or control and serum starved overnight. N = 3. Data are represented as mean ± SD. *p < 0.05, **p < 0.01, and ***p < 0.001. (L-P) Immunoblot analysis of LAM (L), H1299 (M), DLD1 (N), MCF7 (O), and LNCaP (P) cells transfected with siRNAs targeting FAM120A or control and serum-starved overnight. See also Supplemental Figure S1.
Figure 3.
Figure 3.. FAM120A is required for the splicing and stability of lipogenic genes.
(A) Volcano plot of gene expression from RNA-seq results in LAM cells transfected with siRNAs targeting FAM120A, SRSF1 or control with overnight serum starvation (GSE229657). Lipogenic genes are highlighted in rectangles. N = 3. Same RNA-seq results are used in (A-D). (B) Violin plot of 408 intron loci that show significant intron retention (IR) in siFAM120A and siSRSF1 compared to control. (C) (Upper) Representative genome browser example of RNA-seq on FASN1 locus. (Lower) Zoom-in view of intron loci of FASN that are retained by FAM120A or SRSF1 knockdown. (D) Individual IR ratio calculated from IRFinderS of lipogenic genes from RNA-seq data. (E) Validation of intron retention by qPCR analysis of LAM cells transfected with siRNAs targeting FAM120A, SRSF1 or control. Intron retention = (Expression of intron-included region) / (Expression of intron-excluded region). (F-L) QPCR analysis of LAM cells transfected with siRNAs targeting FAM120A, UPF1, or control, and serum starved overnight. Actinomycin D (Act D, 5 μg/mL) was treated for the indicated time points for mRNA stability analysis (F-K). N = 3. p-value (*) was calculated between siNTC and siFAM120A. p-value (#) was calculated between siFAM120A and siFAM120A+siUPF1. Data are represented as mean ± SD. *p < 0.05, **p < 0.01, ***p < 0.001, ##p < 0.01, and ###p < 0.001. See also Supplemental Figure S2 and Supplemental Table S1.
Figure 4.
Figure 4.. FAM120A interacts with SRSF1 through lipogenic gene RNAs.
(A) Schematic diagram of the domains in wild-type (WT) and RNA binding domain (RBD)-deleted (∆RBD) FAM120A. (B) RNA immunoprecipitation qPCR (RIP-qPCR) analysis of LAM cells expressing FAM120A WT or ∆RBD. IP was performed with IgG or anti-FAM120A antibodies. The graph shows qPCR analysis of RIP products. N = 3. p-value was calculated between IgG and FAM120A-WT. (C) Co-IP analysis of HEK293E cells expressing SRSF1 with Flag-FAM120A WT or ∆RBD. 1% of total cell lysate was loaded as an input. Asterisk indicates a non-specific band. (D) Co-IP analysis of HEK293E cells expressing FAM120A-V5 and T7-SRSF1 (WT or mutants). Cell lysates were treated with RNases before IP. 1% of total cell lysate was loaded as an input. (E) RIP-qPCR analysis of LAM cells stably expressing shRNAs targeting FAM120A or control. Immunoprecipitation was performed with IgG or anti-SRSF1 antibodies. The graph shows qPCR analysis of RIP products. N = 3. p-value was calculated between SRSF1-IP samples from shNTC and shFAM120A. (F) QPCR analysis of LAM cells stably expressing FAM120A WT or ∆RBD in FAM120A knockdown cells. Cells were serum-starved overnight. N = 3. (G) Immunoblot analysis of LAM, H1299, and DLD1 cells stably expressing FAM120A WT or ∆RBD in FAM120A knockdown cells. Cells were serum-starved overnight. (H-I) QPCR analysis of LAM cells stably expressing HA-SRPK2 (WT (wild type), KD (kinase dead, SRPK2-K110M), or AA (non-phosphorylatable, SRPK2-S394A/S397A)). Endogenous SRPK2 was knocked down by shRNA targeting 3’UTR of SRPK2. Cells were serum-starved overnight. Graphs show mRNA levels (H) and intron retention (I). N = 3. Data are represented as mean ± SD. *p < 0.05, **p < 0.01, ***p < 0.001, and ###p < 0.001. See also Supplemental Figure S3.
Figure 5.
Figure 5.. FAM120A bridges SRSF1 to SREBP1 to induce lipogenic enzyme expression.
(A-C) Analysis of Srsf1 chromatin immunoprecipitation (ChIP)-seq results (GSE45517) in MEF cells near the transcription start sites of Acss2 (A), Acly (B), and Fasn (C). (D-F) ChIP-qPCR analysis of SRSF1 in target gene promoters. Immunoprecipitation was performed using IgG or anti-SRSF1 antibodies in LAM (D), H1299 (E), and DLD1 (F) cells stably expressing shRNAs targeting FAM120A or control. Cells were serum-starved overnight. p-value was calculated between shNTC and shFAM120A. N = 3. (G) Co-IP analysis of transcription factors in HEK293E cells expressing FAM120A-V5. 1% of total cell lysate was loaded as an input. (H) ChIP-qPCR analysis of SREBP1 on target gene promoters. Immunoprecipitation was performed using IgG or anti-SREBP1 antibodies in LAM cells stably expressing shRNAs targeting FAM120A or control. Cells were serum-starved overnight. p-value was calculated between shNTC and shFAM120A. N = 3. (I, J) Promoter activity analysis of ACSS2 (H) and SCD1 (I) in LAM cells transfected with promoter constructs and siRNAs targeting FAM120A or control. N = 3. (K-M) ChIP-qPCR analysis of SRSF1 in target gene promoters. Immunoprecipitation was performed using IgG or anti-SRSF1 antibodies in LAM (K), H1299 (L), and DLD1 (M) cells stably expressing shRNAs targeting SREBP1/2 or control. Cells were serum-starved overnight. p-value was calculated between shNTC and shSREBP1/2. N = 3. Data are represented as mean ± SD. *p < 0.05, **p < 0.01, ***p < 0.001, and ###p < 0.001. See also Supplemental Figure S4.
Figure 6.
Figure 6.. FAM120A promotes efficient splicing of lipogenic genes by associating with transcriptional and splicing machineries.
(A, B) QPCR analysis of intron retention in LAM cells transfected with siRNAs targeting U1-70K or control (A), and FAM120A, SREBP1/2, SREBP1/2+FAM120A or control (B). Cells were serum starved overnight. N = 3. Data are represented as mean ± SD. *p < 0.05, **p < 0.01, and ***p < 0.001. p-value was calculated between siNTC and siFAM120A (B). N = 3. (C) Co-IP analysis of HEK293E cells. Immunoprecipitation was performed using anti-FAM120A antibodies. Cell lysates were treated with RNases before IP. 1% of total cell lysate was loaded as an input. (D) Co-IP analysis of HEK293E cells expressing FAM120A-V5 and T7-SRSF1 (WT or mutants). 1% of total cell lysate was loaded as an input. Asterisk indicates a non-specific band. (E) Co-IP analysis of HEK293E cells expressing Flag-FAM120A WT or ∆RBD. 1% of total cell lysate was loaded as an input. Asterisk indicates a non-specific band. (F-H) Co-IP analysis of LAM (F) and MCF7 (G) cells serum starved overnight (to induce SREBP cleavage) and treated with SREBP cleavage inhibitor (25-HC, 10 µM), or SRPK inhibitor (SRPKIN-1, 5 µM) for 4 hr (F, G); HEK239E cells serum starved overnight followed by insulin stimulation (100 nM) (to induce SREBP cleavage) with or without 25-HC (10 µM) or SRPKIN-1 (5 µM) for 4 hr (H). Note that serum starvation decreases mTORC1 activity in HEK293E cells (H) but does not affect constitutively active mTORC1 activity in LAM and MCF7 cancer cells (F, G). Immunoprecipitation was performed using IgG or anti-FAM120A antibodies. 1% of total cell lysate was loaded as an input. SREBP1(P), precursor SREBP1; SREBP1(M), cleaved and matured SREBP1. See also Supplemental Figure S5.
Figure 7.
Figure 7.. FAM120A RNA binding is essential for lipogenesis and tumor growth.
(A) Schematic of de novo fatty acid synthesis pathway. (B, C) Heatmap of fatty acid levels. LC-MS analysis was performed on LAM cells transfected with siRNAs targeting FAM120A or control (B) and H1299 cells stably expressing shRNAs targeting FAM120A or control (C) with overnight serum starvation. N = 3. (D-H) Cell proliferation analysis of LAM (D), H1299 (E), DLD1 (F), MCF7 (G), and LNCaP (H) cells stably expressing shRNAs targeting FAM120A or control. N = 3. Data are represented as mean ± SD. (I-M) Crystal violet (CV) analysis of LAM (I), H1299 (J), DLD1 (K), MCF7 (L), and LNCaP (M) cells stably expressing shRNAs targeting FAM120A or control. Cells were grown in lipoprotein-deficient serum (LPDS)-containing media supplemented with lipoprotein (25 μg/ml), palmitate-albumin (10 μM, palmitate), oleate-albumin (50 μM, oleate), or fatty acid-free albumin (25 μM, control). The graph shows the quantified absorbance of solubilized CV stain. N = 3. Data are represented as mean ± SD. (N-O) Xenograft tumor growth assay of H1299 cells stably expressing shNTC or shFAM120A with FAM120A WT or ∆RBD. N ≥ 4. Data are represented as mean ± SEM. p-value (*) was calculated between shNTC and shFAM120A+Empty. p-value (#) was calculated between shFAM120A+Empty and shFAM120A+WT. Data are represented as mean ± SD. ***p < 0.001, #p < 0.05, ##p < 0.01, and ###p < 0.001. See also Supplemental Figure S7.

References

    1. Saxton RA, and Sabatini DM (2017). mTOR Signaling in Growth, Metabolism, and Disease. Cell 169, 361–371. 10.1016/j.cell.2017.03.035. - DOI - PubMed
    1. Shimobayashi M, and Hall MN (2014). Making new contacts: the mTOR network in metabolism and signalling crosstalk. Nat. Rev. Mol. Cell Biol 15, 155–162. 10.1038/nrm3757. - DOI - PubMed
    1. Ben-Sahra I, Hoxhaj G, Ricoult SJH, Asara JM, and Manning BD (2016). mTORC1 induces purine synthesis through control of the mitochondrial tetrahydrofolate cycle. Science 351, 728–733. 10.1126/science.aad0489. - DOI - PMC - PubMed
    1. Dibble CC, and Manning BD (2013). Signal integration by mTORC1 coordinates nutrient input with biosynthetic output. Nat. Cell Biol 15, 555–564. 10.1038/ncb2763. - DOI - PMC - PubMed
    1. Han J, Li E, Chen L, Zhang Y, Wei F, Liu J, Deng H, and Wang Y (2015). The CREB coactivator CRTC2 controls hepatic lipid metabolism by regulating SREBP1. Nature 524, 243–246. 10.1038/nature14557. - DOI - PubMed

Publication types

MeSH terms

Substances