. 2023 Sep;299(9):105169.
doi: 10.1016/j.jbc.2023.105169. Epub 2023 Aug 16.

Molecular dynamics simulations support a multistep pathway for activation of branched actin filament nucleation by Arp2/3 complex

Affiliations

Molecular dynamics simulations support a multistep pathway for activation of branched actin filament nucleation by Arp2/3 complex

Yuvraj Singh et al. J Biol Chem. 2023 Sep.

Abstract

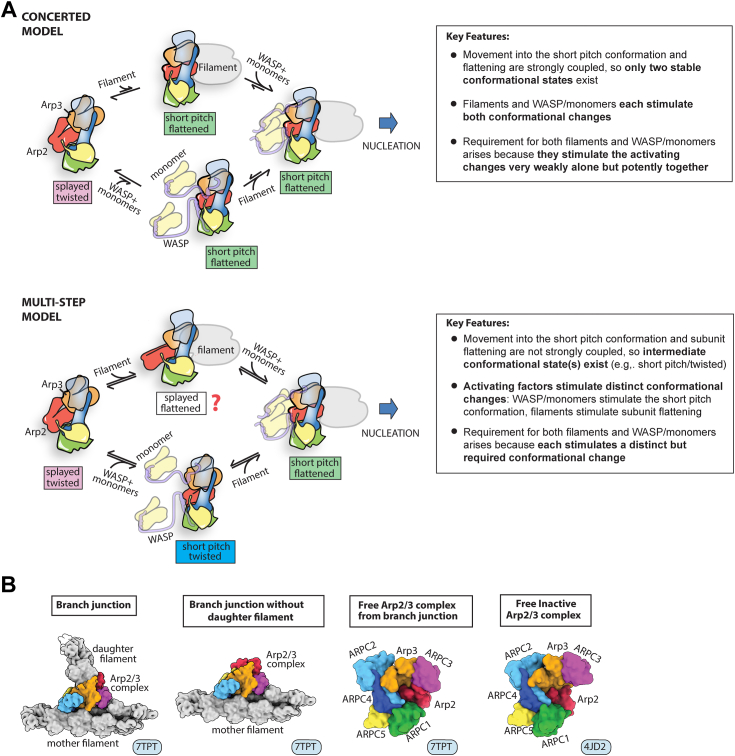
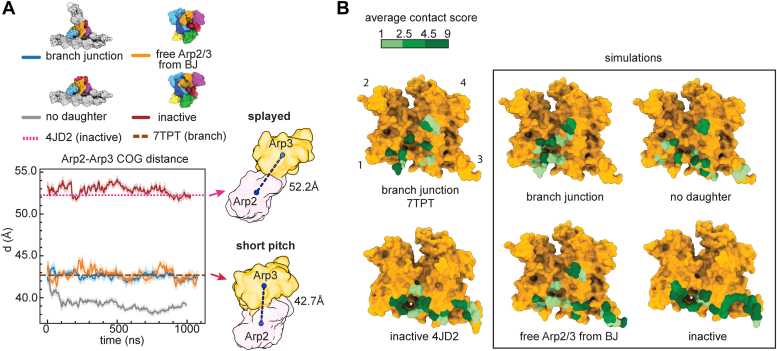
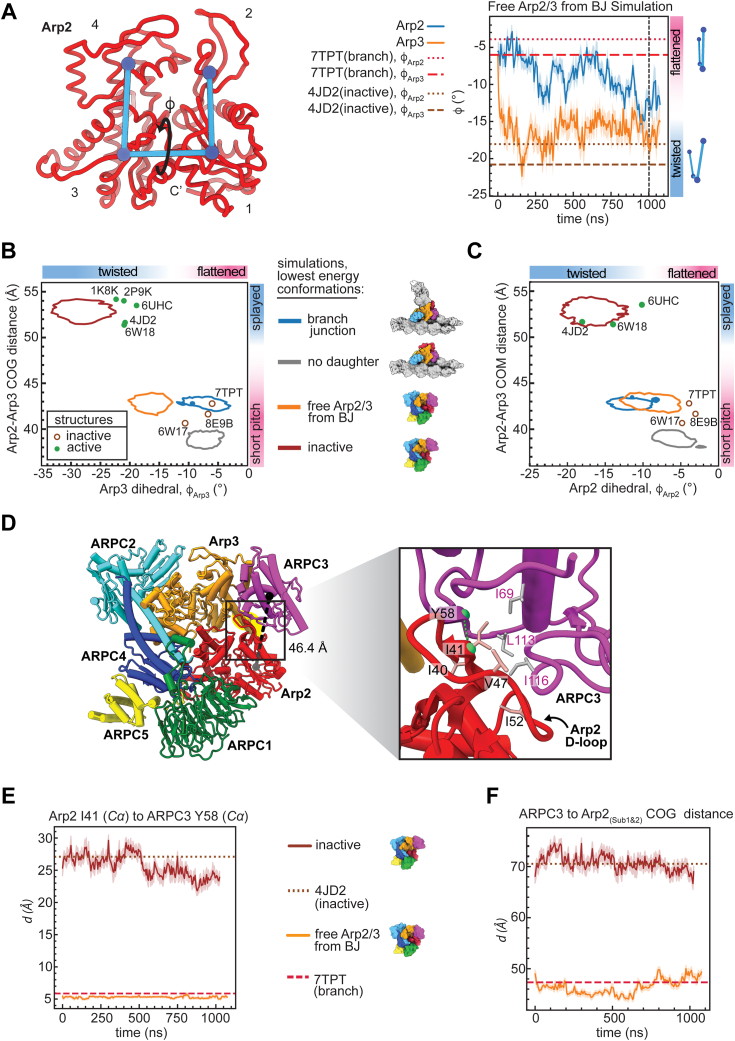
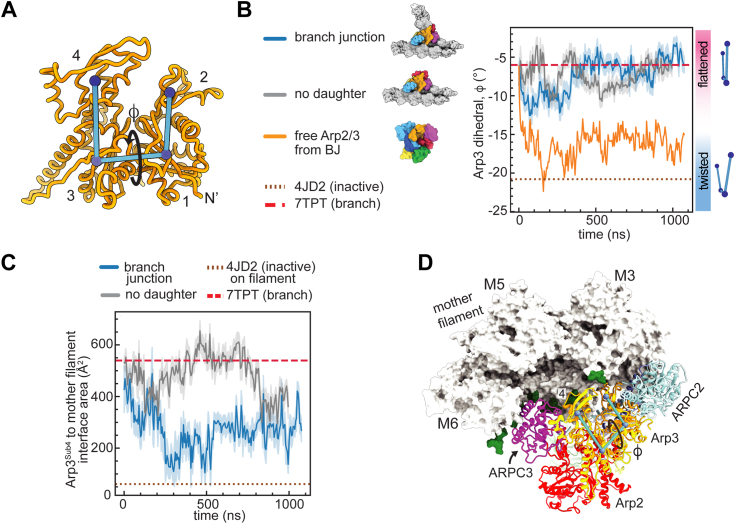
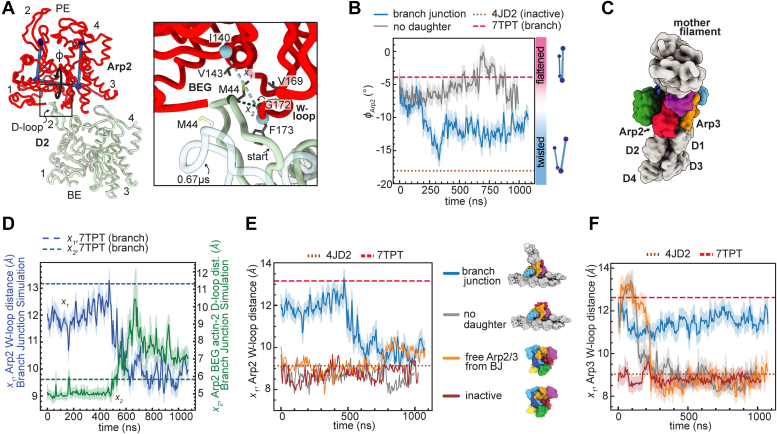
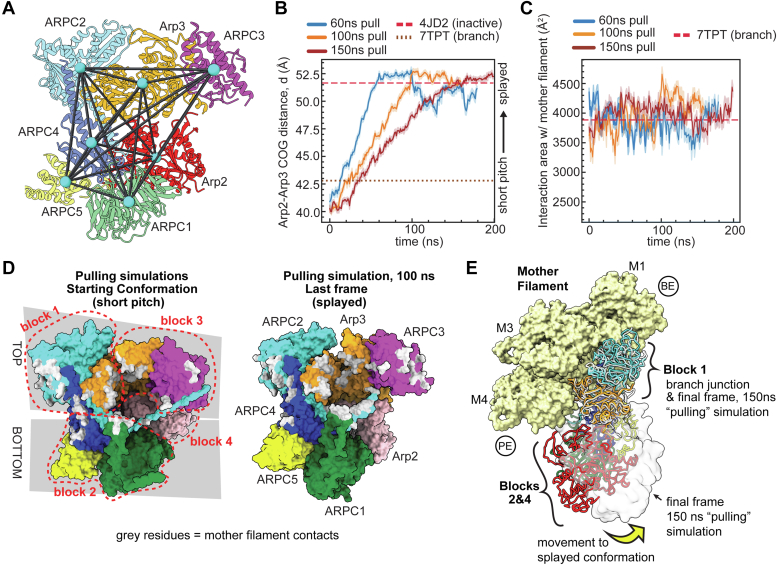
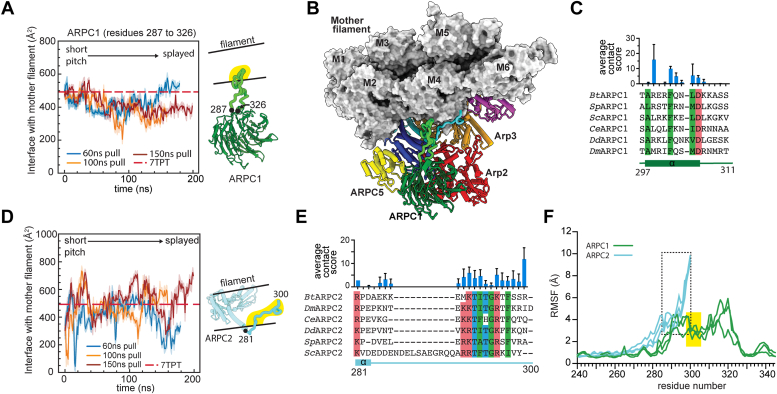
Actin-related protein 2/3 complex (Arp2/3 complex) catalyzes the nucleation of branched actin filaments that push against membranes in processes like cellular motility and endocytosis. During activation by WASP proteins, the complex must bind WASP and engage the side of a pre-existing (mother) filament before a branched filament is nucleated. Recent high-resolution structures of activated Arp2/3 complex revealed two major sets of activating conformational changes. How these activating conformational changes are triggered by interactions of Arp2/3 complex with actin filaments and WASP remains unclear. Here we use a recent high-resolution structure of Arp2/3 complex at a branch junction to design all-atom molecular dynamics simulations that elucidate the pathway between the active and inactive states. We ran a total of ∼4.6 microseconds of both unbiased and steered all-atom molecular dynamics simulations starting from three different binding states, including Arp2/3 complex within a branch junction, bound only to a mother filament, and alone in solution. These simulations indicate that the contacts with the mother filament are mostly insensitive to the massive rigid body motion that moves Arp2 and Arp3 into a short pitch helical (filament-like) arrangement, suggesting actin filaments alone do not stimulate the short pitch conformational change. In contrast, contacts with the mother filament stabilize subunit flattening in Arp3, an intrasubunit change that converts Arp3 from a conformation that mimics an actin monomer to one that mimics a filamentous actin subunit. Our results support a multistep activation pathway that has important implications for understanding how WASP-mediated activation allows Arp2/3 complex to assemble force-producing actin networks.

Keywords: Arp2/3 complex; WASP; actin; molecular dynamics; nucleation.


Conflict of interest statement

Conflict of interest The authors declare that they have no conflicts of interest with the contents of this article.

Figures

Figure 1
Figure 1
Proposed mechanisms for pathway to Arp2/3 complex activation and overview of simulation setup.A, simplified schematics of the conformational pathway to activation of Arp2/3 complex in a concerted versus multistep model of activation. Previous data indicate that while WASP triggers the splayed to short pitch conformational change, both states can exist with or without WASP bound to the complex (17, 18). For clarity, neither these conformational states nor their reversibility is depicted here. For a more detailed diagram of the two proposed mechanisms that includes these states, see Fig. S1. Text boxes to the right of each scheme list the key features of each mechanism. The splayed/flattened state (marked with red question mark) may not be adopted because of steric clash (see Discussion). B, starting structures used for each of the four unbiased all-atom MD simulations described here. The PDB file used to build each structure is indicated in the lower right corner. Arp2/3 complex, actin-related protein 2/3 complex; MD, molecular dynamics.
Figure 2
Figure 2
The splayed and short pitch conformations are maintained in microsecond unbiased MD simulations. A, plot of the distance of the center of geometry (COG) of subdomains 3 and 4 of Arp2 to the COG of subdomain 3 and 4 of Arp3 as a function of simulation time. Dashed and dotted lines show the corresponding distance in the branch junction structure, 7TPT, and the inactive Arp2/3 complex structure, 4JD2, respectively. Data for simulations are shown as average smoothed over 5 ns (50 frames) for this and all other plots from the unbiased simulations. The shaded area shows the standard deviation over the smoothing window. B, surface representation of Arp3 from inactive (4JD2) or active structure (7TPT) showing average contact scores over the entire trajectory for Arp3 residues that contact Arp2. Contact scores for 4JD2 and 7TPT are shown on the left for reference. Contact scores were calculated using PyContact, as described in the methods. Arp2/3 complex, actin-related protein 2/3 complex; MD, molecular dynamics.
Figure 3
Figure 3
Unbiased simulations show that flattening and adoption of the short pitch conformation arenot strongly linked.A, (left) backbone trace of Arp2 showing measurement of the twisting/flattening angle. Subdomains of Arp2 are labeled 1 to 4. (right) Plot of Arp2 and Arp3 twisting/flattening angle (φ) versus simulation time for the free Arp2/3 complex from branch junction simulation. Arp2 and Arp3 twisting/flattening angles from inactive (4JD2) and the active Arp2/3 complex structure (7TPT) are shown as dashed or dotted lines, as indicated. Vertical dashed line shows the simulation frame used to generate panel D. B, plot of the Arp3 subunit twisting/flattening dihedral versus the Arp2-Arp3 COG, which measures movement into the short pitch conformation. Enclosed regions indicate the most probable conformations in the simulation, as defined by conformations that are within a radius of one free energy unit from the lowest energy conformation. Circles show the corresponding measurements for selected active and inactive cryo-EM or X-ray crystal structures. C, plot as described in B, except the Arp2 twisting/flattening dihedral angle is plotted on the x-axis. D, ribbon diagram of the free Arp2/3 complex from branch junction simulation output at 1 μs showing that the Arp2 D-loop maintains contact with ARPC3 even when the complex moves into a short-pitch, twisted conformation. The D-loop of Arp2 is highlighted in yellow. The distance between the globular domain of ARPC3 and subdomains 1 and 2 of Arp2 is indicated with a black line. Inset shows a zoomed in view of the interaction. Green dashed line shows the distance between I41Arp2 Cα and Y58ARPC3 Cα plotted in panel E. E, plot showing the distance between Arp2 D-loop and ARPC3 for Arp2/3 complex (active) and (inactive) simulations versus simulation time, with 7TPT and 4JD2 plotted for reference. F, plot showing the distance between the COGs of Arp2Sub1&2 and ARPC3 versus simulation time in the Arp2/3 complex active simulation. Arp2/3 complex, actin-related protein 2/3 complex; cryo-EM, cryo-electron microscopy; COG, center of geometry.
Figure 4
Figure 4
Contacts with the mother filament stabilize flattened Arp3.A, diagram showing the twisting/flattening angle (φ) of Arp3. The four subdomains of Arp3 are labeled 1 to 4. B, plot of Arp3 twisting/flattening dihedral angle versus simulation time for all unbiased simulations that started in the active conformation. Arp3 twisting/flattening angles from inactive (4JD2) and active Arp2/3 complex structures (7TPT) are shown in dotted or dashed lines, as indicated. Data for the free Arp2/3 complex from branch junction is replotted from Fig. 3A. C, plot of the surface area of subdomain 4 of Arp3 buried on the mother filament versus simulation time. Buried surface area of subdomain 4 in the branch junction structure (7TPT) and a model of 4JD2 on an actin filament are shown as dotted or dashed lines. D, ribbon and surface representation of the last frame of the branch junction without daughter filament simulation showing residues within actin filament that interact with Arp2/3 complex upon subunit flattening in Arp3. Actin filament residues that interact with ARPC3 or Arp3Sub4 in the MF-bound Arp2/3 complex simulation (average contact score > 1, colored green) are mapped onto the surface of the actin filament. Subdomain 4 of Arp3 is labeled. The Arp3 dihedral angle that flattens Arp3 is shown as angle φ. Arp2/3 complex, actin-related protein 2/3 complex.
Figure 5
Figure 5
Twisting of Arp2 closes the barbed end groove and weakens its interactions with the daughter filament.A, ribbon diagram showing the interaction of the D-loop of actin D2 with the barbed end groove of Arp2. Arp2 and actin D2 subdomains are labeled 1 to 4. PE: pointed end, BE: barbed end. Right panel shows closeup of the interaction with distances measured in B. Actin D2 from 0.67 μs (transparent light blue ribbon) in the branch junction simulation was placed by overlaying Arp2 from the 0.67 μs frame in the trajectory with Arp2 from 7TPT. BEG: Barbed-end groove. Start: position of actin D-loop at the beginning of the simulation. B, plot of twisting/flattening angle of Arp2 (φ) in the branch junction and the branch junction without daughter filament (no daughter) simulations. Arp2 twisting/flattening angles from inactive (4JD2) and active Arp2/3 complex structures (7TPT) are shown in dotted or dashed lines, as indicated. C, surface representation of branch junction model (7TPT) showing the interface between Arp2 and Arp3 and the pointed end of the nucleated daughter filament. D, plot of the W-loop opening (x1) and D-loop to Arp2 distance (x2) in the branch junction simulation. See panel A for definition of x1 and x2. Distances x1 and x2 in the branch junction structure are plotted for reference. E, plot of W-loop distance (x1) in Arp2 subunits for all unbiased simulations. Distance x1 in the branch junction (7TPT) and inactive Arp2/3 complex structure (4JD2) is plotted as dashed or dotted lines, as indicated. F, identical to E, except x1 for Arp3 from each simulation is plotted. Arp2/3 complex, actin-related protein 2/3 complex.
Figure 6
Figure 6
Splayed Arp2/3 complex maintains approximately the same interface area with the mother filament as short pitch Arp2/3 complex. A, ribbon diagram of inactive Arp2/3 complex (4JD2) showing the center of geometry (COG) of each subunit. For the steered MD simulations, a bias was applied to move the COGs from their positions in the active complex to their positions in the inactive (4JD2) complex. B, plot of the distance between the Arp2 and Arp3 subdomains 3 and 4 COGs as a function of simulation time. The same distances for the inactive (4JD2) and branch junction (7TPT) structures are plotted as dashed and dotted lines, as indicated. C, plot of the total interaction area of Arp2/3 complex with the mother filament in all three steered simulations. Data for simulations are shown as an average smoothed over 1 ns (10 frames) for this and all other plots for the steered simulations. The standard deviation over the smoothing window is shaded. Interaction surface area in the branch junction (7TPT) is plotted as a dashed line for reference. D, (Left panel) surface representation of Arp2/3 complex rendered using the starting coordinates of the 100 ns pulling simulation. The four rigid blocks that move independently when the complex undergoes subunit flattening (see Video S1) are outlined with red dashes. The “top” and “bottom” rigid blocks that move independently when the clamp twists are indicated with gray boxes behind the complex. Residues of Arp2/3 complex that contact the mother filament at the start of the simulation (PyContact calculated contact score >1) are colored gray. (Right panel) Same as left panel except surface representation is rendered from the final frame of the simulation and residues that have an average contact score > 1 over the last 1 ns of the simulation are colored gray. Arp2/3 complex is in the splayed conformation at the end of the simulation. E, comparison of mother filament binding contacts of activated (flattened, short pitch) Arp2/3 complex (7TPT) to those of the splayed Arp2/3 complex (final frame of MF-bound 150 ns pulling simulation—rendered in gray ribbon or transparent gray surface). The splayed Arp2/3 complex was modeled onto the mother filament by superposing block 1 onto block 1 in the branch junction model. Yellow arrow shows movement of blocks 2 and 4 stimulated by clamp twisting. Block 3 is omitted for clarity. BE: Barbed end of mother filament. PE: pointed end of mother filament. Arp2/3 complex, actin-related protein 2/3 complex.
Figure 7
Figure 7
Flexible segments in Arp2/3 complexmake contacts to the mother filament that are insensitive to the Arp2/3 complex conformation. A, plot of the interaction area of ARPC1 residues 287 to 326 with the mother filament versus simulation time for all pulling simulations. Dashed line shows the corresponding interaction areas in the branch junction structure 7TPT. B, surface and cartoon representation of Arp2/3 complex bound to the mother filament in the last frame of the 100 ns pulling simulation. The two flexible segments from the bottom half of the complex (ARPC1 287–326, green, and ARPC2 281–300, cyan) are shown in thicker cartoon representation. C, sequence alignment of the ARPC1 insert sequence from a diverse range of species showing conserved hydrophobic (green) and acidic (red) residues. The average contact score over the course of all three pulling simulations is plotted above the sequence for each residue. Error bars: standard deviation. D, plot of the interaction area of ARPC2 residues 281 to 300 with the mother filament versus the simulation time for all pulling simulations. E, sequence alignment of ARPC2 C-terminal extension from a diverse range of species showing conserved hydrophobic (green), basic (red), or hydrophilic (cyan) residues. The average contact score over the course of the three pulling simulations is plotted above the sequence for each residue. Error bars: standard deviation. F, plot of the root mean squared fluctuation (RMSF) from the initial conformation for backbone atoms of the ARPC1 insert (green) or the ARPC2 C terminus (cyan) over the entire simulation, plotted separately for each pulling simulation. Black dashed rectangle highlights RMSF values for residues in ARPC2 C-terminal extension with the closest contacts to the mother filament. Yellow rectangle highlights RMSF values for residues in the ARPC1 insert with the closest contacts to the mother filament. Arp2/3 complex, actin-related protein 2/3 complex.

Similar articles

Cited by

References

    1. Siton-Mendelson O., Bernheim-Groswasser A. Functional actin networks under construction: the cooperative action of actin nucleation and elongation factors. Trends Biochem. Sci. 2017;42:414–430. - PubMed
    1. Fujiwara I., Vavylonis D., Pollard T.D. Polymerization kinetics of ADP- and ADP-Pi-actin determined by fluorescence microscopy. Proc. Natl. Acad. Sci. U. S. A. 2007;104:8827–8832. - PMC - PubMed
    1. Dominguez R. The WH2 domain and actin nucleation: necessary but insufficient. Trends Biochem. Sci. 2016;41:478–490. - PMC - PubMed
    1. Amann K.J., Pollard T.D. The Arp2/3 complex nucleates actin filament branches from the sides of pre-existing filaments. Nat. Cell Biol. 2001;3:306–310. - PubMed
    1. Molinie N., Gautreau A. The Arp2/3 regulatory system and its deregulation in cancer. Physiol. Rev. 2018;98:215–238. - PubMed

Publication types

MeSH terms

Substances

LinkOut - more resources