. 2023 Sep 5;10(9):ENEURO.0058-23.2023.
doi: 10.1523/ENEURO.0058-23.2023. Print 2023 Sep.

Excessive Thyroid Hormone Signaling Induces Photoreceptor Degeneration in Mice

Affiliations

Excessive Thyroid Hormone Signaling Induces Photoreceptor Degeneration in Mice

Hongwei Ma et al. eNeuro. .

Abstract

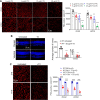
Rod and cone photoreceptors degenerate in inherited and age-related retinal degenerative diseases, ultimately leading to loss of vision. Thyroid hormone (TH) signaling regulates cell proliferation, differentiation, and metabolism. Recent studies have shown a link between TH signaling and retinal degeneration. This work investigates the effects of excessive TH signaling on photoreceptor function and survival in mice. C57BL/6, Thra1 -/-, Thrb2 -/-, Thrb -/-, and the cone dominant Nrl -/- mice received triiodothyronine (T3) treatment (5-20 μg/ml in drinking water) for 30 d, followed by evaluations of retinal function, photoreceptor survival/death, and retinal stress/damage. Treatment with T3 reduced light responses of rods and cones by 50-60%, compared with untreated controls. Outer nuclear layer thickness and cone density were reduced by ∼18% and 75%, respectively, after T3 treatment. Retinal sections prepared from T3-treated mice showed significantly increased numbers of TUNEL-positive, p-γH2AX-positive, and 8-OHdG-positive cells, and activation of Müller glial cells. Gene expression analysis revealed upregulation of the genes involved in oxidative stress, necroptosis, and inflammation after T3 treatment. Deletion of Thra1 prevented T3-induced degeneration of rods but not cones, whereas deletion of Thrb2 preserved both rods and cones. Treatment with an antioxidant partially preserved photoreceptors and reduced retinal stress responses. This study demonstrates that excessive TH signaling induces oxidative stress/damage and necroptosis, induces photoreceptor degeneration, and impairs retinal function. The findings provide insights into the role of TH signaling in retinal degeneration and support the view of targeting TH signaling for photoreceptor protection.

Keywords: cone; mice; photoreceptor; retina; rod; thyroid hormone.


Conflict of interest statement

The authors declare no competing financial interests.

Figures

Figure 1.
Figure 1.
Treatment with T3 reduces retinal function. A–D, C57BL/6 mice at 1 month received T3 treatment (5–20 μg/ml via drinking water) for 4 weeks and were evaluated for scotopic and photopic light responses by ERG recordings. Shown are representative scotopic waveforms and quantitative results of scotopic a/b wave amplitudes (A, B), and representative photopic waveforms and quantitative results of photopic b wave amplitudes (C, D). E, C57BL/6 mice at 17 months received T3 treatment (20 μg/ml via drinking water) for 4 weeks and were evaluated for photoreceptor function. Shown are results of the ERG recordings. Data are represented as the mean ± SEM for 5–23 mice/group. Data were analyzed by one-way ANOVA, followed by Dunn’s multiple-comparisons test for B and D, and were analyzed by unpaired Student’s t test/Mann–Whitney test for E. **p <0.01, ***p <0.001, n.s., not statistically significant.
Figure 2.
Figure 2.
Treatment with T3 reduces ONL thickness and deletion of Thra1 or Thrb2 reverses this reduction. A, C57BL/6, Thra1−/−, and Thrb2−/− mice at 1 month received T3 treatment (20 μg/ml via drinking water) for 4 weeks and were evaluated for retinal morphology and ONL thickness. Shown are representative light microscopic images of H&E-stained retinal sections and corresponding quantitative analysis of ONL thickness. B, C57BL/6 mice at 17 months received T3 treatment (20 μg/ml via drinking water) for 4 weeks and were evaluated for retinal integrity/ONL. Shown are representative light microscopic images of H&E-stained retinal sections and corresponding quantitative analysis of ONL thickness. ONL, outer nuclear layer; INL, Inner nuclear layer; GCL, ganglion cell layer. Data are represented as the mean ± SEM for 3–10 mice/group. Data were analyzed by unpaired Student’s t test/Mann–Whitney test for the two-group comparisons. *p <0.05, **p <0.01.
Figure 3.
Figure 3.
Treatment with T3 reduces cone density. A, C57BL/6 mice at 1 month received T3 treatment (5–20 μg/ml via drinking water) for 4 weeks and were evaluated for cone density. Shown are representative confocal images of PNA labeling on retinal whole mounts and corresponding quantitative analysis of PNA-positive cells. B, Shown are representative confocal images of immunofluorescence labeling of M-opsin on retinal sections and corresponding quantitative analysis. C, C57BL/6 mice at 17 months received T3 treatment (20 μg/ml via drinking water) for 4 weeks and were evaluated for cone density. Shown are representative confocal images of PNA labeling on retinal whole mounts and corresponding quantitative analysis of PNA-positive cells. Data are represented as the mean ± SEM for 6–12 mice/group. ONL, outer nuclear layer; INL, Inner nuclear layer; GCL, ganglion cell layer. Data were analyzed by one-way ANOVA, followed by Dunn’s multiple-comparisons test for A, and were analyzed by unpaired Student’s t test/Mann–Whitney test for B and C. **p <0.01, ***p <0.001.
Figure 4.
Figure 4.
Deletion of Thrb2 but not Thra1 preserves cones from T3-induced degeneration. C57BL/6 (WT), Thra1−/−, and Thrb2−/− mice at 1 month received T3 treatment (20 μg/ml via drinking water) for 4 weeks and were evaluated for cone density and serum T3 level. A, Shown are representative confocal images of PNA labeling on retinal whole mounts and corresponding quantitative analysis of PNA-positive cells. B, Shown are serum T3 levels analyzed by ELISA. Data are presented as the mean ± SEM for 3–8 mice/group. Data were analyzed by unpaired Student’s t test/Mann–Whitney test. *p <0.05, ***p <0.001; $p <0.05, compared with WT.
Figure 5.
Figure 5.
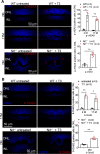
Treatment with T3 induces photoreceptor cell death. C57BL/6 mice at 1 month and 17 months and Nrl−/− mice at 1 month received T3 treatment (20 μg/ml via drinking water) for 4 weeks and were evaluated for photoreceptor cell death. Shown are representative confocal images of TUNEL labeling on retinal sections and corresponding quantitative analysis of TUNEL-positive cells. ONL, outer nuclear layer; INL, Inner nuclear layer. Data are represented as the mean ± SEM for 3–4 mice/group. Data were analyzed by unpaired Student’s t test/Mann–Whitney test. ***p <0.001.
Figure 6.
Figure 6.
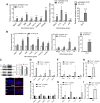
Treatment with T3 induces expression of genes involved in necroptosis and inflammation in the retina and the distinct involvement of TH receptors. A, B, C57BL/6 mice and Nrl−/− mice at 1 month received T3 treatment (20 μg/ml via drinking water) for 4 weeks and were evaluated for expression levels of the genes involved in cellular stress responses and death signaling in the retina. Shown are the qRT-PCR results for expression levels of the genes involved in necroptosis and inflammatory responses in C57BL/6 (A) and Nrl−/− (B) mice. C, Shown are the results of immunoblotting with corresponding quantitative analysis and immunolabeling for phospho-MLKL and phospho-RIPK3 in Nrl−/− mice. D–I, Thra1−/− mice and Thrb−/− mice at 1 month received T3 treatment (20 μg/ml via drinking water) for 2 weeks and were evaluated for gene expression. Shown are the qRT-PCR results for expression levels of the genes involved in necroptosis (D, E) and inflammatory (F, G) responses in Thra1−/− mice (D, F), and Thrb−/− mice (E, G), and expression levels of Dio3 (H, I). Data are represented as the mean ± SEM of 3–5 assays using retinas prepared from 3–9 mice/group. Data were analyzed by unpaired Student’s t test/Mann–Whitney test. *p <0.05, **p <0.01, ***p <0.001.
Figure 7.
Figure 7.
Treatment with T3 increases oxidative stress/damage in the retina. C57BL/6 mice at 1 month and 17 months, and Nrl−/− mice at 1 month received T3 treatment (20 μg/ml via drinking water) for 4 weeks and were evaluated for oxidative stress/damage in the retina. A, B, Shown are representative confocal images of p-γH2AX (A) and 8-OHdG (B) labeling on retinal sections and corresponding quantitative analysis. Data are represented as the mean ± SEM for 3–4 mice/group. ONL, outer nuclear layer; INL, Inner nuclear layer. Data were analyzed by unpaired Student’s t test/Mann–Whitney test. *p <0.05, **p <0.01.
Figure 8.
Figure 8.
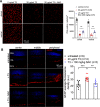
Treatment with NAC reduces T3-induced cone degeneration and inhibits Müller cell activation. C57BL/6 mice at 1 month received T3 treatment (20 μg/ml via drinking water) for 4 weeks in the absence and presence of NAC (200 mg/kg/d, i.p.) and were evaluated for cone density and Müller cell activation. A, Shown are representative confocal images of PNA labeling on retinal whole mounts and corresponding quantitative analysis. B, Shown are representative confocal images of GFAP labeling on retinal sections and corresponding quantitative analysis. ONL, outer nuclear layer; INL, Inner nuclear layer; GCL, ganglion cell layer. Data are represented as the mean ± SEM for 5–12 mice/group. Data were analyzed by unpaired Student’s t test/Mann–Whitney test for A and were analyzed by one-way ANOVA, followed by Dunn’s multiple-comparisons test for B. **p <0.01, ***p <0.001.

References

    1. Abdelkader M, Abass N (2019) The relation between age related macular degeneration and thyroid disorders. Int J Ophthalmol Vis Sci 4:101–105. 10.11648/j.ijovs.20190404.18 - DOI
    1. Age-Related Eye Disease Study Research Group (2000) Risk factors associated with age-related macular degeneration. A case-control study in the age-related eye disease study: age-related eye disease study report number 3. Ophthalmology 107:2224–2232. - PMC - PubMed
    1. Allocca M, Corrigan JJ, Mazumder A, Fake KR, Samson LD (2019) Inflammation, necrosis, and the kinase RIP3 are key mediators of AAG-dependent alkylation-induced retinal degeneration. Sci Signal 12:eaau9216. 10.1126/scisignal.aau9216 - DOI - PMC - PubMed
    1. Applebury ML, Farhangfar F, Glösmann M, Hashimoto K, Kage K, Robbins JT, Shibusawa N, Wondisford FE, Zhang H (2007) Transient expression of thyroid hormone nuclear receptor TRbeta2 sets S opsin patterning during cone photoreceptor genesis. Dev Dyn 236:1203–1212. 10.1002/dvdy.21155 - DOI - PubMed
    1. Barabino A, Plamondon V, Abdouh M, Chatoo W, Flamier A, Hanna R, Zhou S, Motoyama N, Hébert M, Lavoie J, Bernier G (2016) Loss of Bmi1 causes anomalies in retinal development and degeneration of cone photoreceptors. Development 143:1571–1584. 10.1242/dev.125351 - DOI - PubMed

Publication types

Substances

LinkOut - more resources