. 2023 Sep 13;43(37):6460-6475.
doi: 10.1523/JNEUROSCI.0724-23.2023. Epub 2023 Aug 18.

Dietary Fiber and Microbiota Metabolite Receptors Enhance Cognition and Alleviate Disease in the 5xFAD Mouse Model of Alzheimer's Disease

Affiliations

Dietary Fiber and Microbiota Metabolite Receptors Enhance Cognition and Alleviate Disease in the 5xFAD Mouse Model of Alzheimer's Disease

Yichen Zhou et al. J Neurosci. .

Abstract

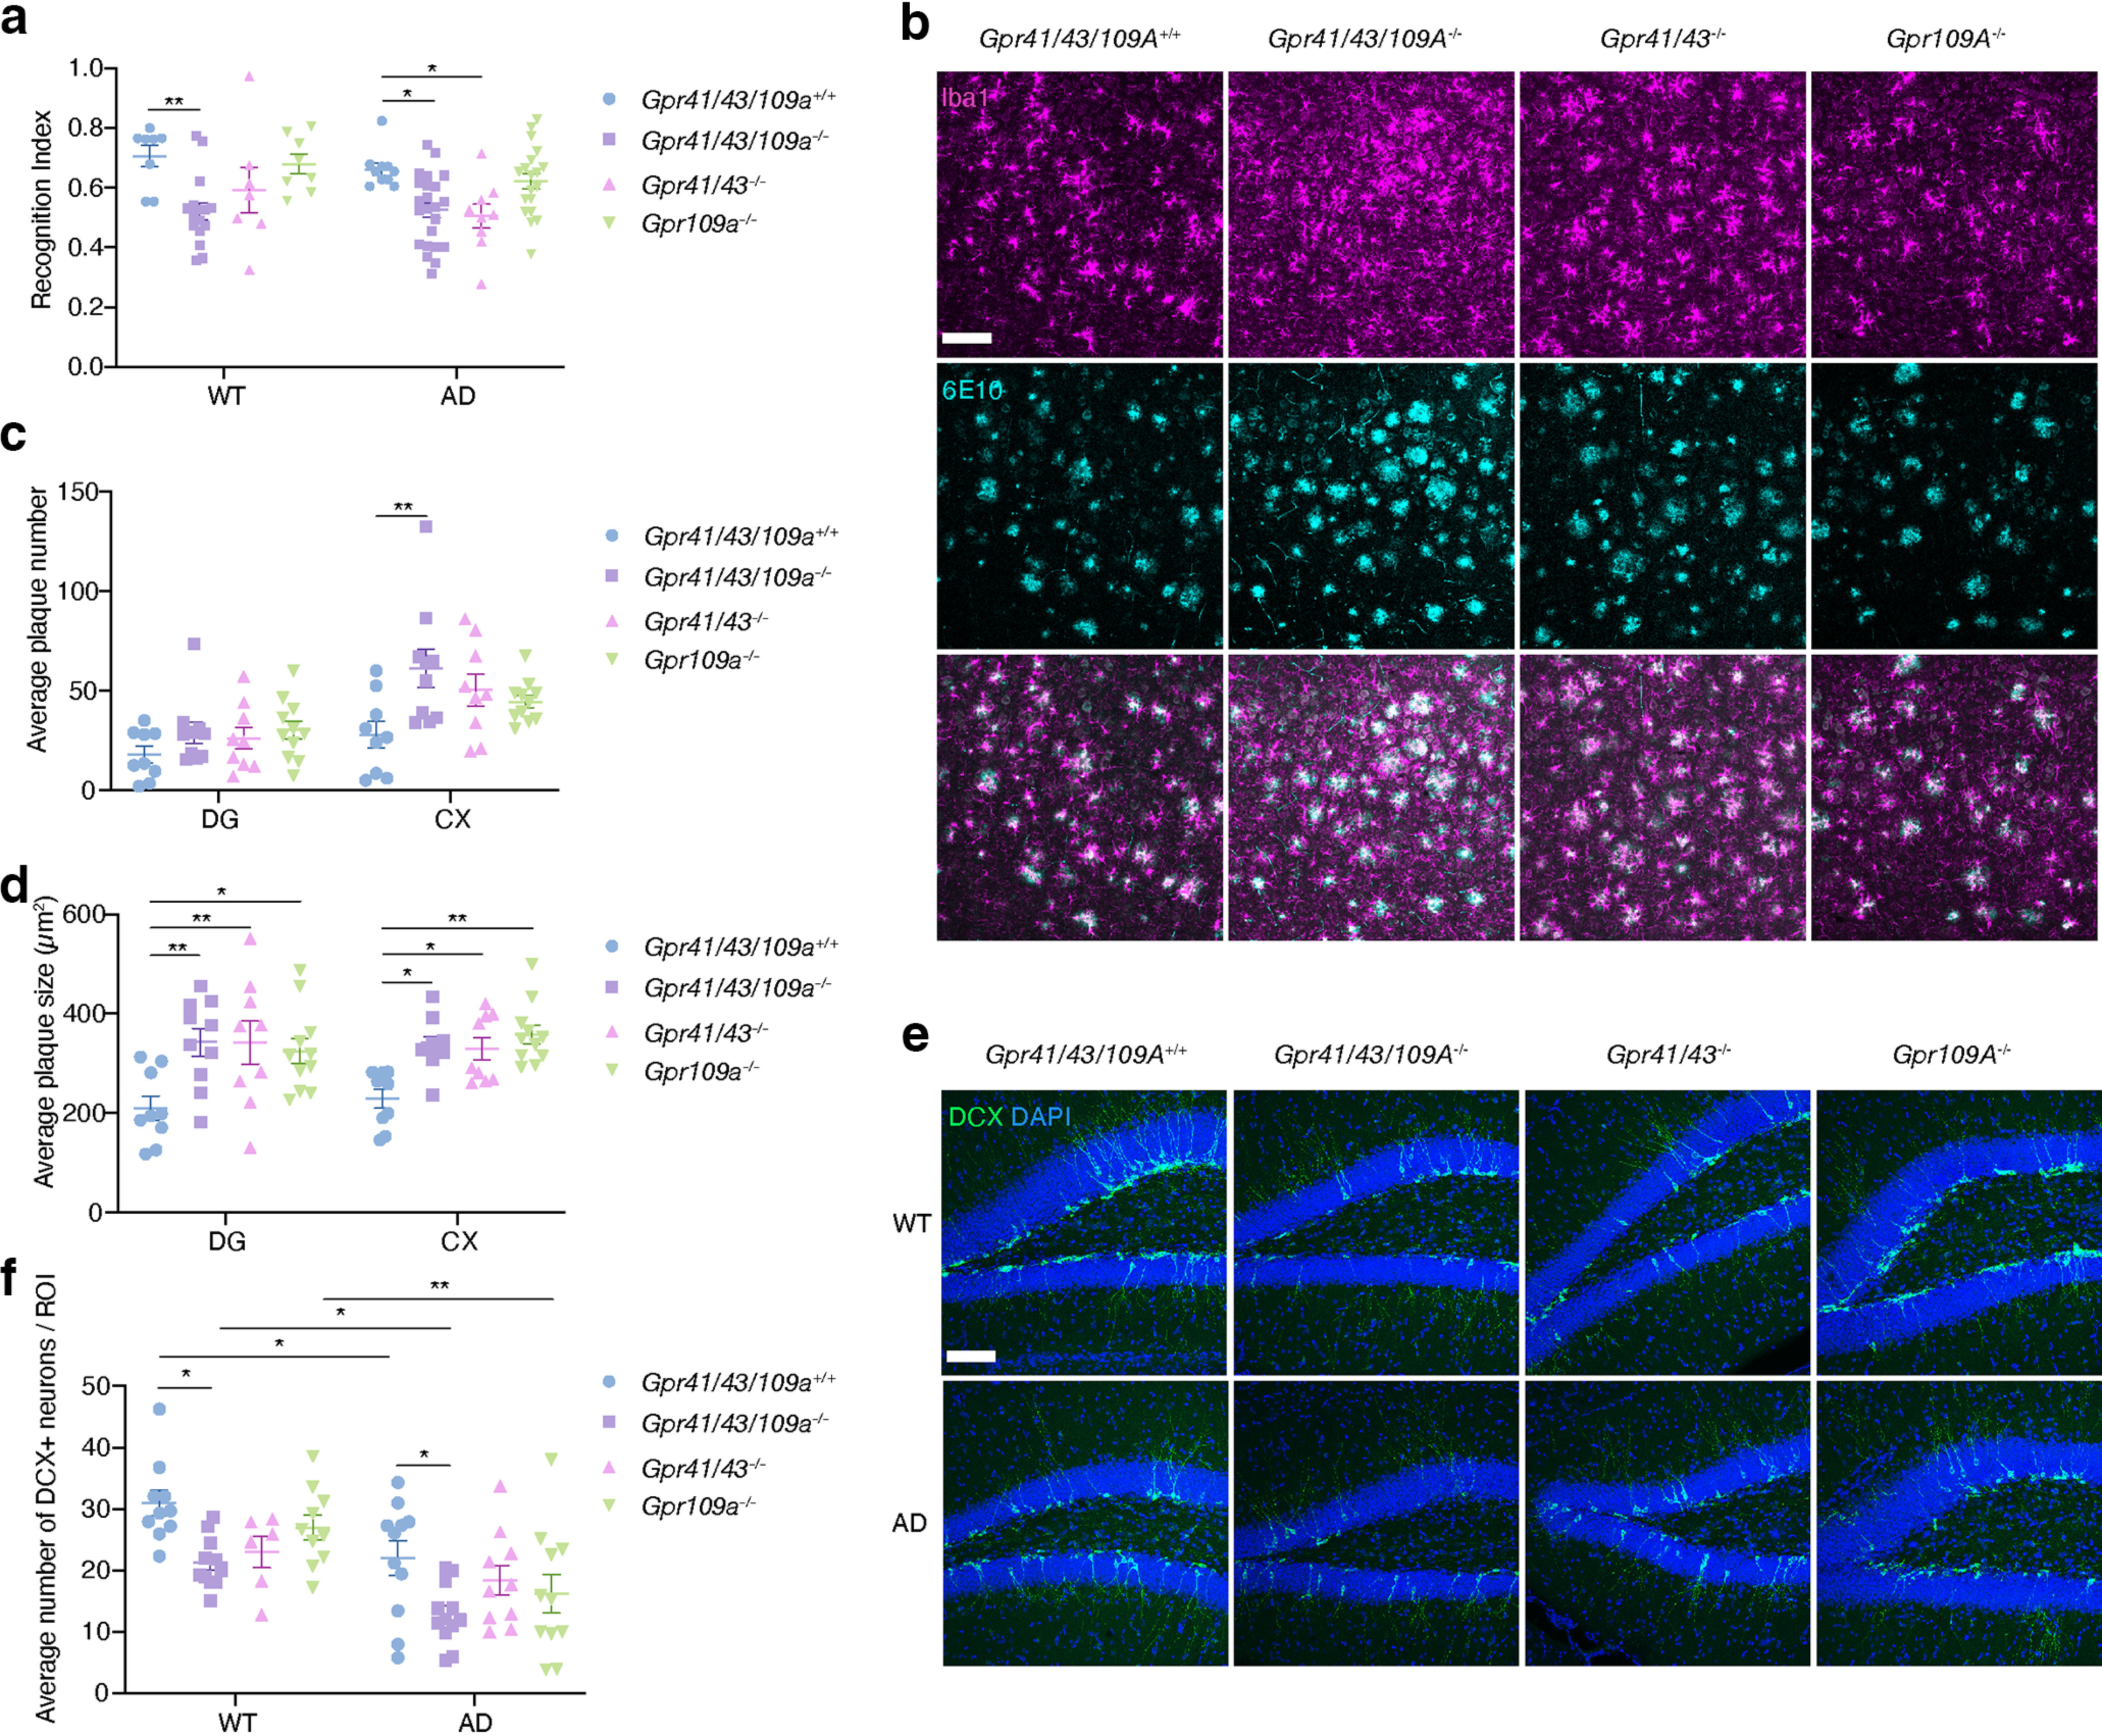
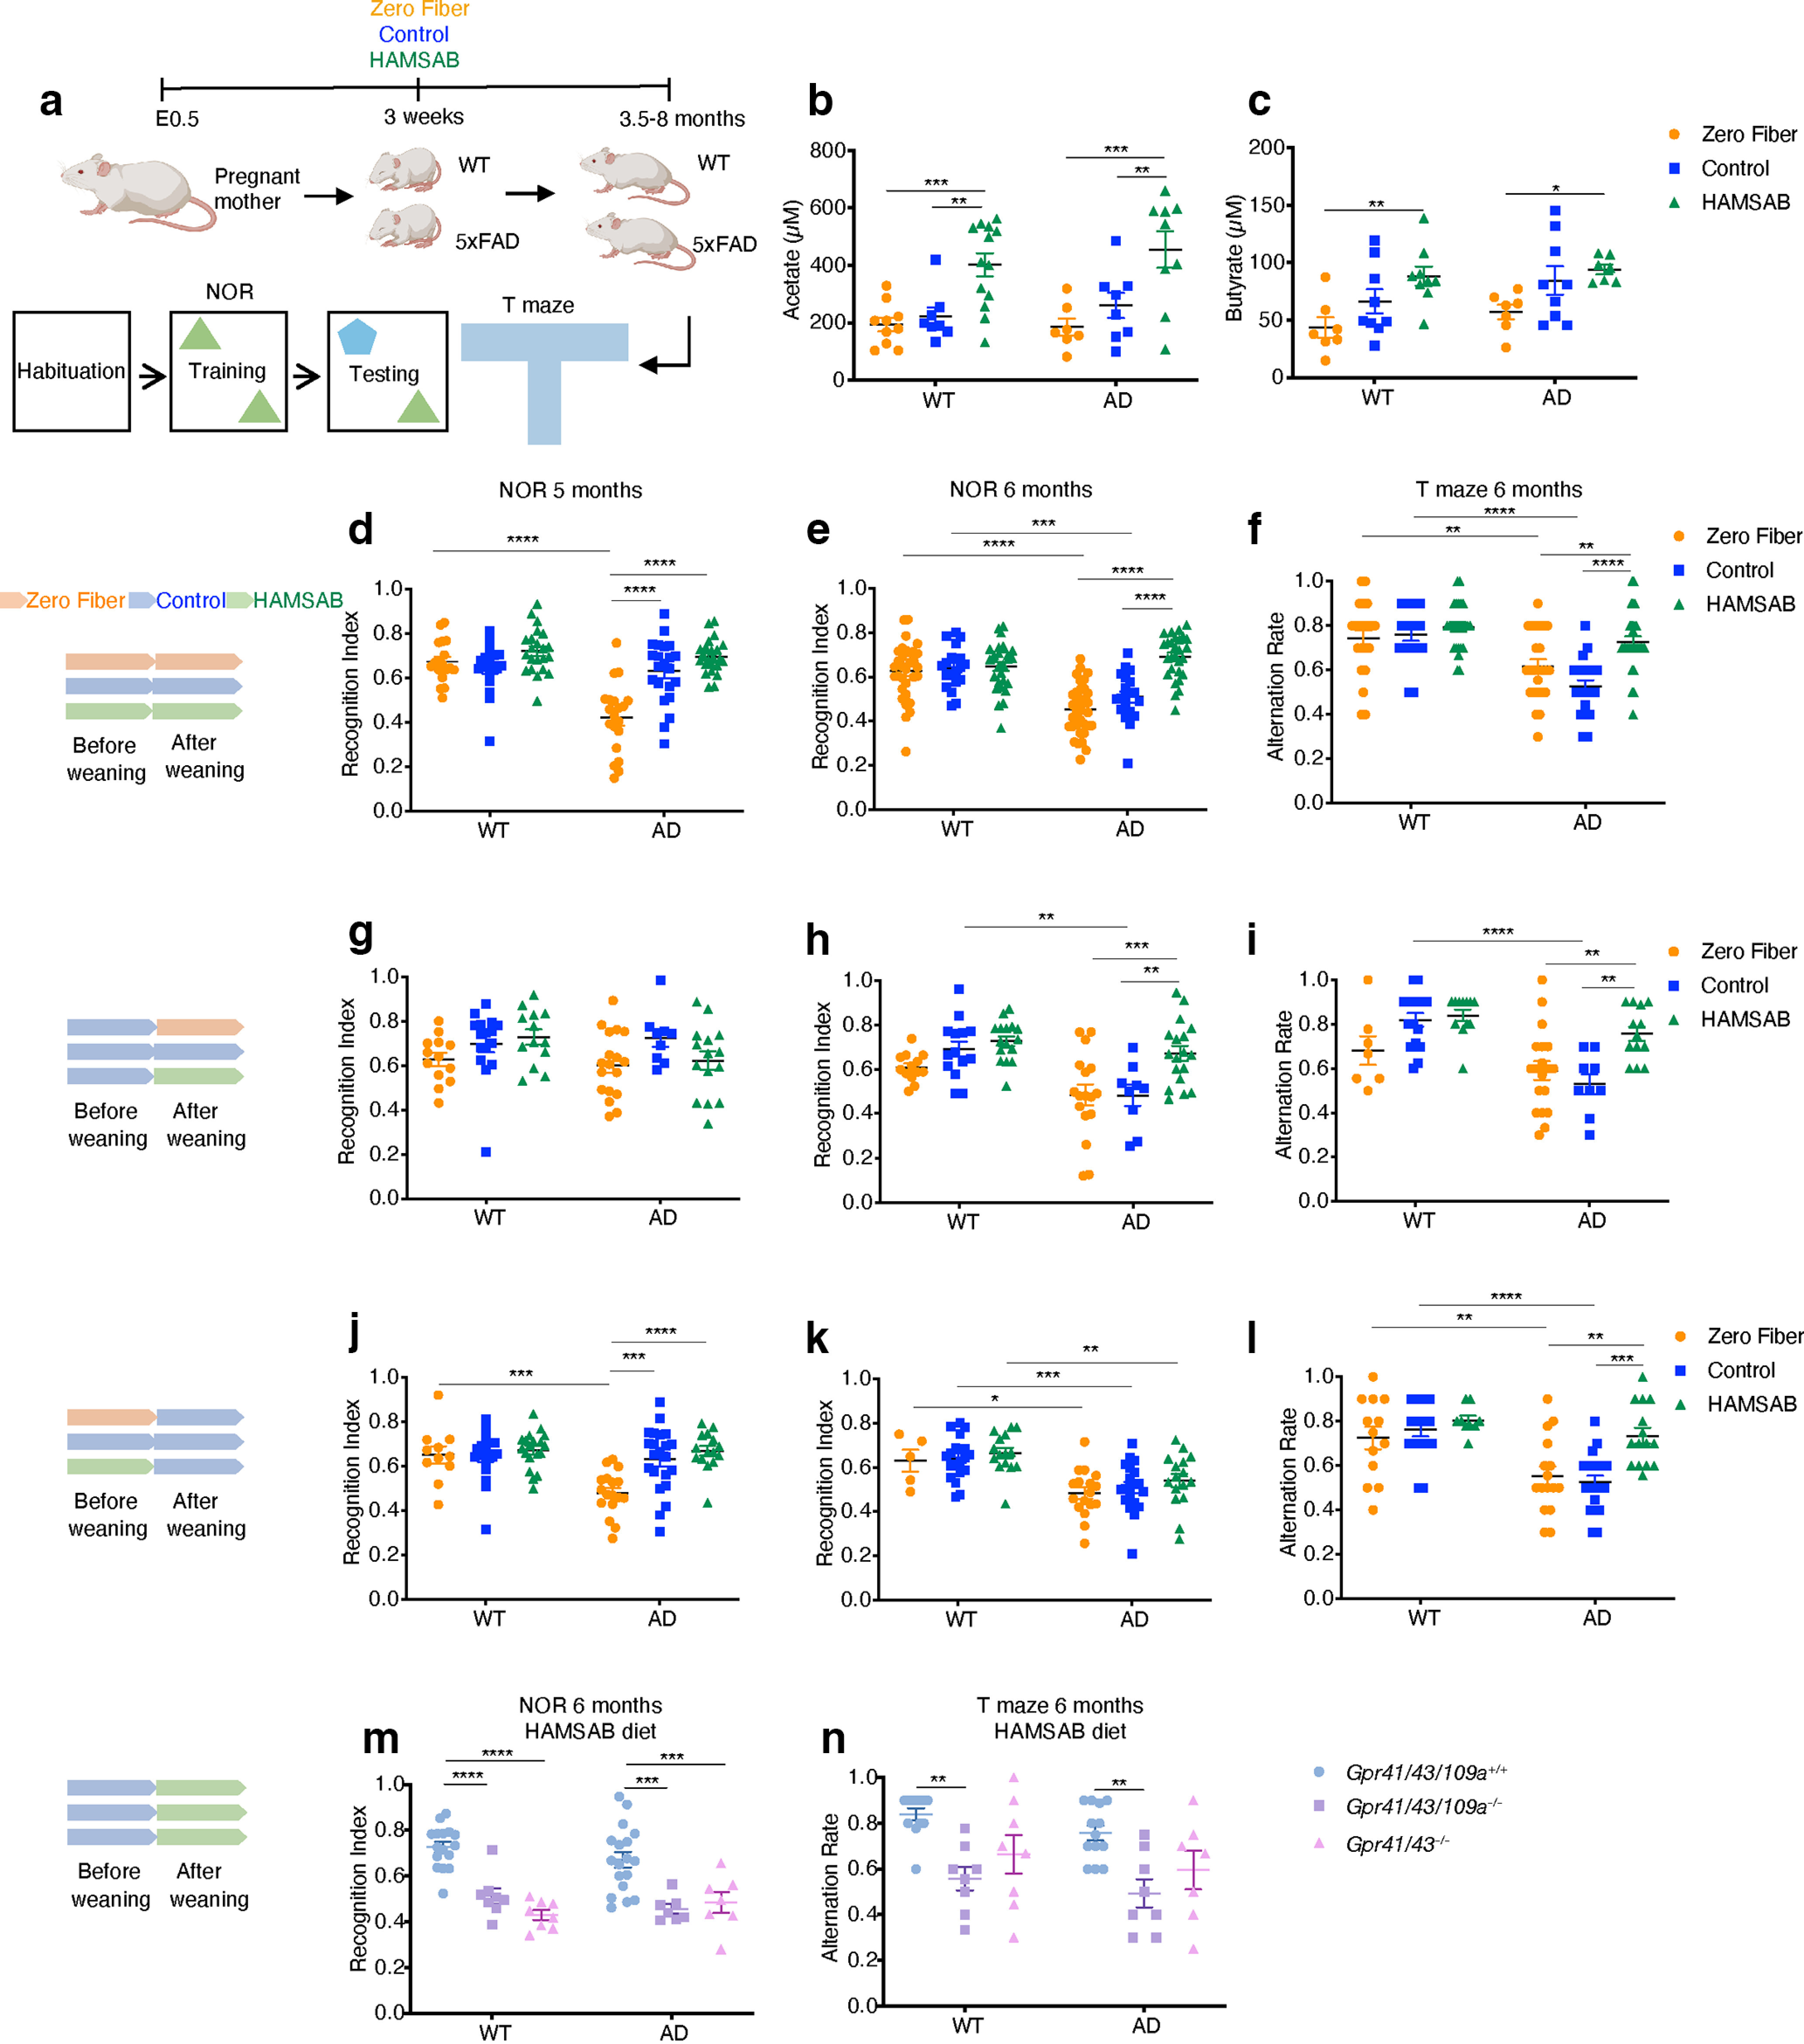
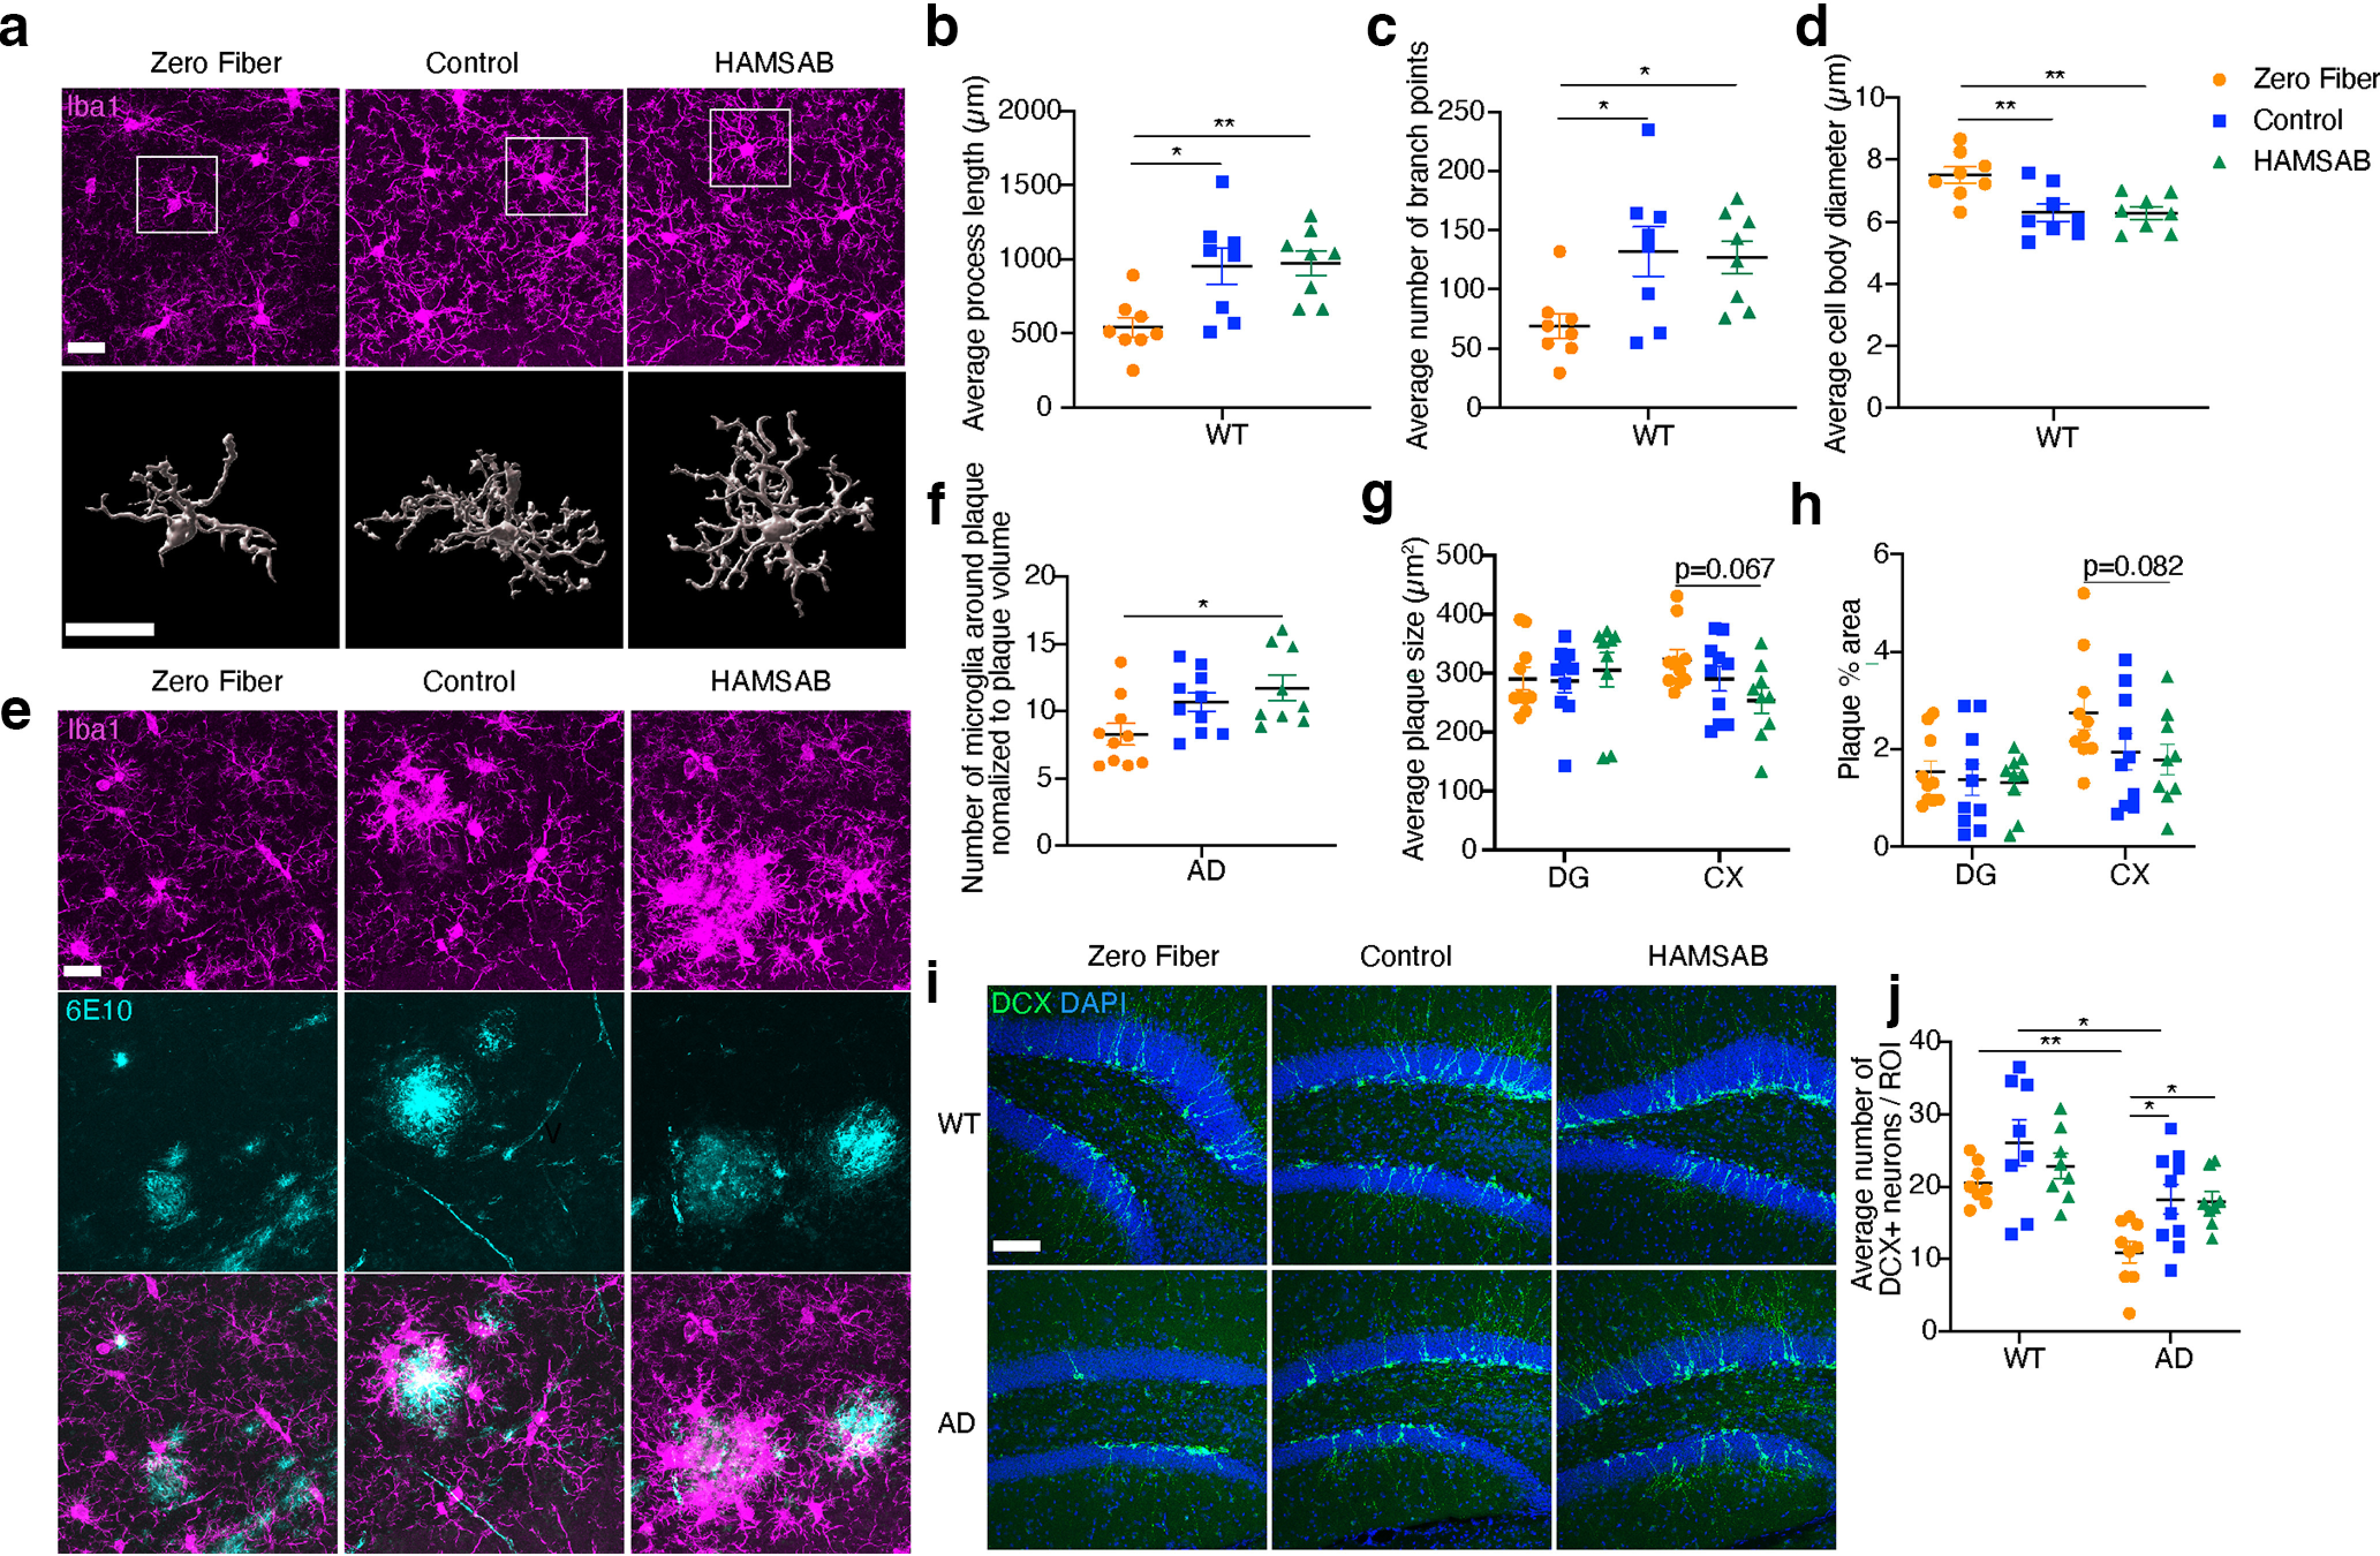
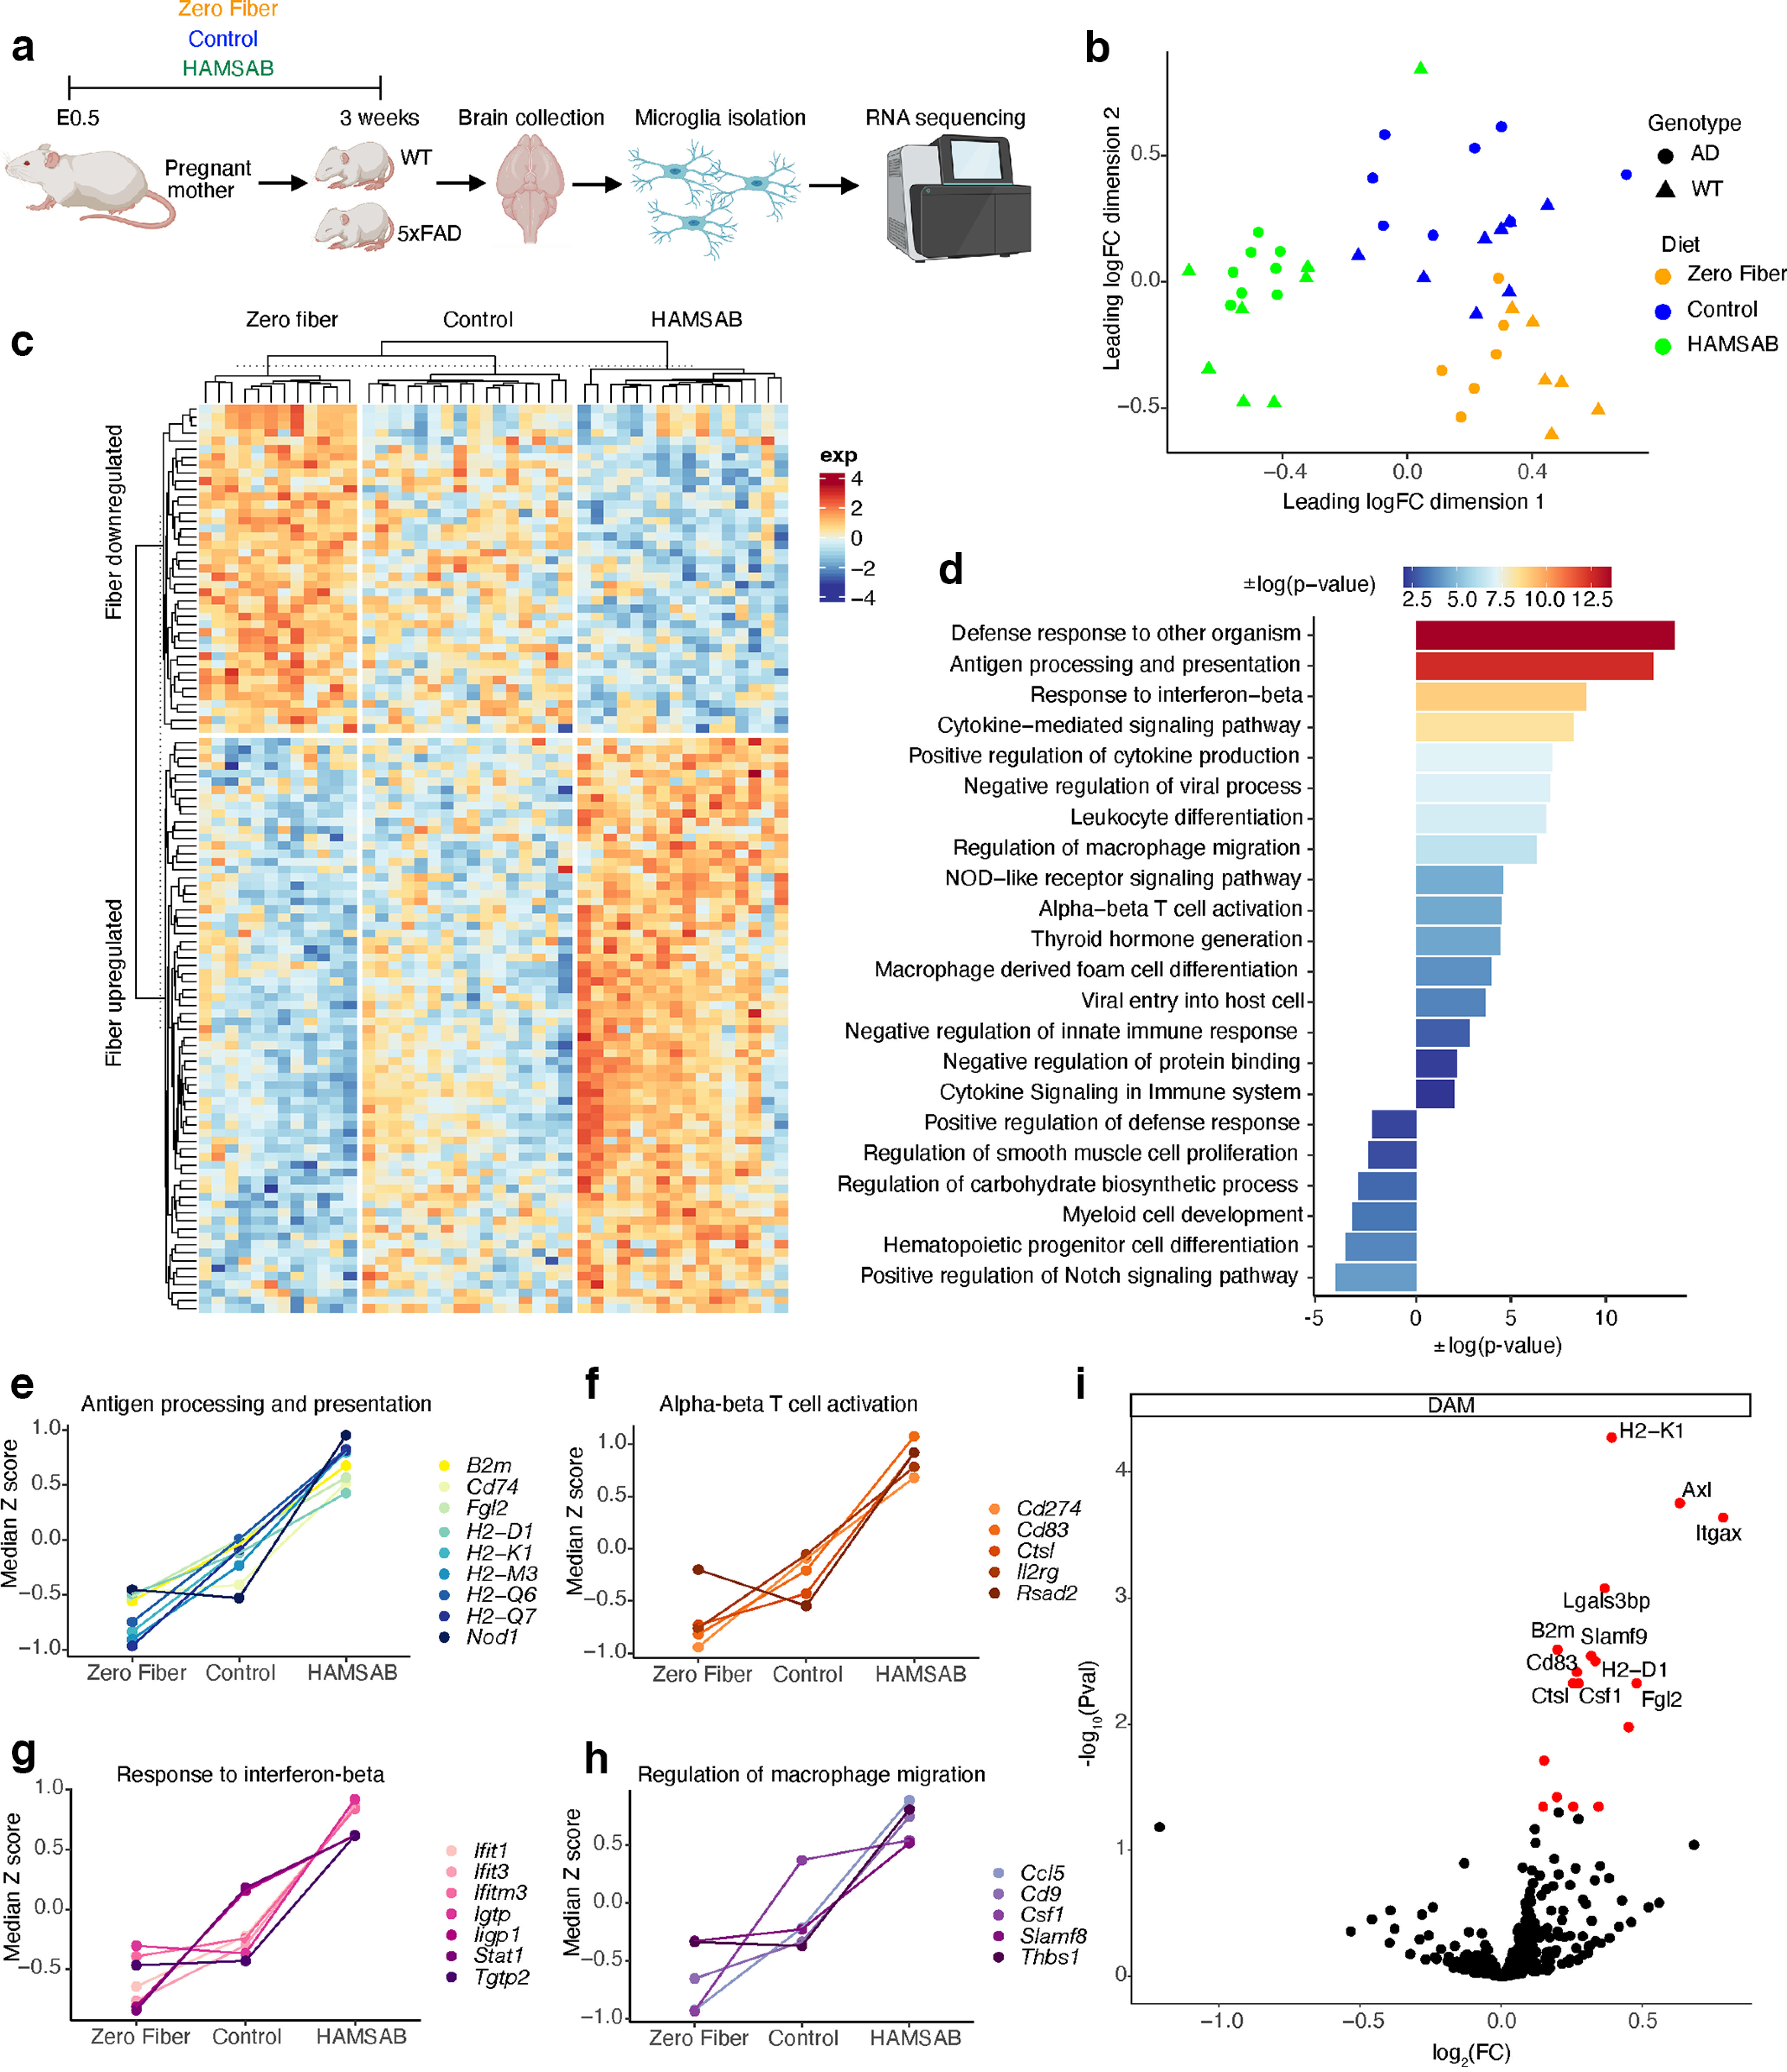
Alzheimer's disease (AD) is a neurodegenerative disorder with poorly understood etiology. AD has several similarities with other "Western lifestyle" inflammatory diseases, where the gut microbiome and immune pathways have been associated. Previously, we and others have noted the involvement of metabolite-sensing GPCRs and their ligands, short-chain fatty acids (SCFAs), in protection of numerous Western diseases in mouse models, such as Type I diabetes and hypertension. Depletion of GPR43, GPR41, or GPR109A accelerates disease, whereas high SCFA yielding diets protect in mouse models. Here, we extended the concept that metabolite-sensing receptors and SCFAs may be a more common protective mechanism against Western diseases by studying their role in AD pathogenesis in the 5xFAD mouse model. Both male and female mice were included. Depletion of GPR41 and GPR43 accelerated cognitive decline and impaired adult hippocampal neurogenesis in 5xFAD and WT mice. Lack of fiber/SCFAs accelerated a memory deficit, whereas diets supplemented with high acetate and butyrate (HAMSAB) delayed cognitive decline in 5xFAD mice. Fiber intake impacted on microglial morphology in WT mice and microglial clustering phenotype in 5xFAD mice. Lack of fiber impaired adult hippocampal neurogenesis in both W and AD mice. Finally, maternal dietary fiber intake significantly affects offspring's cognitive functions in 5xFAD mice and microglial transcriptome in both WT and 5xFAD mice, suggesting that SCFAs may exert their effect during pregnancy and lactation. Together, metabolite-sensing GPCRs and SCFAs are essential for protection against AD, and reveal a new strategy for disease prevention.Significance Statement Alzheimer's disease (AD) is one of the most common neurodegenerative diseases; currently, there is no cure for AD. In our study, short-chain fatty acids and metabolite receptors play an important role in cognitive function and pathology in AD mouse model as well as in WT mice. SCFAs also impact on microglia transcriptome, and immune cell recruitment. Out study indicates the potential of specialized diets (supplemented with high acetate and butyrate) releasing high amounts of SCFAs to protect against disease.

Keywords: Alzheimer’s disease; dietary fiber; metabolite-sensing GPCRs.


Figures

Figure 1.
Figure 1.
GPR41 and/or GPR43 play an important role in cognition and pathology. a, Recognition index of NOR test of 5 month Gpr41/43/109a+/+, Gpr41/43/109a−/−, Gpr41/43−/−, Gpr109a−/− WT/5xFAD mice (WT Gpr41/43/109a+/+ n = 8, WT Gpr41/43/109a−/− n = 16, WT Gpr41/43−/− n = 7, WT Gpr109a−/− n = 8, AD Gpr41/43/109a+/+ n = 10, AD Gpr41/43/109a−/− n = 23, AD Gpr41/43−/− n = 9, AD Gpr109a−/− n = 19). b, Representative immunofluorescence images of Iba1+ microglia (magenta) and 6E10+ plaques (cyan) from the cortex of 6 month Gpr41/43/109a+/+, Gpr41/43/109a−/−, Gpr41/43−/− mice, Gpr109a−/− 5xFAD mice. Scale bar, 100 μm c, d, Average plaque number (c) and plaque size (d) in DG and cortex. AD Gpr41/43/109a+/+ n = 9, AD Gpr41/43/109a−/− n = 10, AD Gpr41/43−/− n = 9, AD Gpr109a−/− n = 11. e, f, Representative immunofluorescence images (e) and quantification (f) of DCX+ newly born neurons (green) from the DG of 6 month Gpr41/43/109a+/+, Gpr41/43/109a−/−, Gpr41/43−/− mice, Gpr109a−/− 5xFAD mice. Scale bar, 100 μm. WT Gpr41/43/109a+/+ n = 10, WT Gpr41/43/109a−/− n = 11, WT Gpr41/43−/− n = 6, WT Gpr109a−/− n = 10, AD Gpr41/43/109a+/+ n = 11, AD Gpr41/43/109a−/− n = 12, AD Gpr41/43−/− n = 10, AD Gpr109a−/− n = 11. Data are mean ± SEM. *p < 0.05, **p < 0.01; two-way ANOVA and Tukey’s multiple comparison test. Extended Data Figure 1-1 supports Figure 1.
Figure 2.
Figure 2.
Dietary fiber improves cognitive function. a, Schematic of experimental design created with Biorender.com. b, c, Concentration of acetate (b) and butyrate (c) in the brains of 6 month WT and 5xFAD mice fed zero fiber, control, HAMSAB diet (acetate: WT zero fiber n = 10, WT control n = 8, WT HAMSAB n = 13, AD zero fiber n = 7, AD control n = 8, AD HAMSAB n = 9; butyrate: WT zero fiber n = 7, WT control n = 9, WT HAMSAB n = 9, AD zero fiber n = 7, AD control n = 9, AD HAMSAB n = 7). d, e, Recognition index of NOR test of 5 month (d) and 6 month (e) WT mice and 5xFAD mice fed zero fiber, control, or HAMSAB diet from E0.5 (5 month NOR: WT zero fiber n = 18, WT control n = 19, WT HAMSAB n = 22, AD zero fiber n = 20, AD control n = 22, AD HAMSAB n = 23; 6 month NOR: WT zero fiber n = 32, WT control n = 20, WT HAMSAB n = 28, AD zero fiber n = 34, AD control n = 20, AD HAMSAB n = 28). f, Alternation rate of T maze of 6 month WT mice and 5xFAD mice fed zero fiber, control, or HAMSAB diet from E0.5 (WT zero fiber n = 21, WT control n = 18, WT HAMSAB n = 26, AD zero fiber n = 25, AD control n = 20, AD HAMSAB n = 31). g, h, Recognition index of NOR test of 5 month (g) and 6 month (h) WT mice and 5xFAD mice fed zero fiber, control, or HAMSAB diet from 1 month (5 month NOR: WT zero fiber n = 13, WT control n = 16, WT HAMSAB n = 13, AD zero fiber n = 18, AD control n = 9, AD HAMSAB n = 15; 6 month NOR: WT zero fiber n = 13, WT control n = 14, WT HAMSAB n = 16, AD zero fiber n = 17, AD control n = 9, AD HAMSAB n = 18). i, Alternation rate of T maze of 6 month WT mice and 5xFAD mice fed zero fiber, control, or HAMSAB diet from 1 month (WT zero fiber n = 7, WT control n = 16, WT HAMSAB n = 12, AD zero fiber n = 19, AD control n = 9, AD HAMSAB n = 13). j, k, Recognition index of NOR test of 5 month (j) and 6 month (k) WT mice and 5xFAD mice whose mothers were fed zero fiber, control, or HAMSAB diet (5 month NOR: WT zero fiber n = 11, WT control n = 19, WT HAMSAB n = 19, AD zero fiber n = 17, AD control n = 22, AD HAMSAB n = 15; 6 month NOR: WT zero fiber n = 5, WT control n = 20, WT HAMSAB n = 15, AD zero fiber n = 17, AD control n = 20, AD HAMSAB n = 16). l, Alternation rate of T maze of 6 month WT mice and 5xFAD mice whose mothers were fed with zero fiber, control, or HAMSAB diet (WT zero fiber n = 13, WT control n = 18, WT HAMSAB n = 9, AD zero fiber n = 16, AD control n = 20, AD HAMSAB n = 15). m, n, Recognition index of NOR test (m) and alternation rate of T maze test (n) of 6 month Gpr41/43/109a+/+, Gpr41/43/109a−/−, Gpr41/43−/−, WT/5xFAD mice fed HAMSAB diet from 1 month (NOR: WT Gpr41/43/109a+/+ n = 16, WT Gpr41/43/109a−/− n = 8, WT Gpr41/43−/− n = 8, AD Gpr41/43/109a+/+ n = 18, AD Gpr41/43/109a−/− n = 7, AD Gpr41/43−/− n = 7; T maze: WT Gpr41/43/109a+/+ n = 12, WT Gpr41/43/109a−/− n = 8, WT Gpr41/43−/− n = 8, AD Gpr41/43/109a+/+ n = 13, AD Gpr41/43/109a−/− n = 8, AD Gpr41/43−/− n = 7). Data are mean ± SEM. *p < 0.05; **p < 0.01; ***p < 0.001; ****p < 0.0001; two-way ANOVA and Tukey’s multiple comparison test. Extended Data Figures 2-1, 2-2, and 2-3 support Figure 2.
Figure 3.
Figure 3.
Dietary fiber influences microglia, Aβ pathology, and neurogenesis. a, Representative immunofluorescence images and Imaris 3D reconstruction of Iba1+ microglia (magenta) from the DG of 6 month WT mice fed zero fiber, control, or HAMSAB diet. Scale bar, 20 μm. bd, Imaris-based automatic quantification of microglial morphology (n = 8). e, Representative immunofluorescence images of Iba1+ microglia (magenta) and 6E10+ plaques (cyan) from the DG of 6 month 5xFAD mice fed zero fiber, control, or HAMSAB diet. Scale bar, 20 μm. f, Average number of microglia surrounding 20 μm radius of a plaque in DG, normalized to plaque volume (AD zero fiber n = 10, AD control n = 10, AD HAMSAB n = 9). g, h, Average plaque size (g) and the percentage of 6E10+ area (h) in DG and cortex of 6-month-old 5xFAD mice fed zero fiber, control, or HAMSAB diet (AD zero fiber n = 10, AD control n = 10, AD HAMSAB n = 9). i, j, Representative immunofluorescence images (i) and quantification (j) of DCX+ newly born neurons (green) from the DG of 6 month 5xFAD mice fed zero fiber, control, or HAMSAB diet. Scale bar, 100 μm. WT zero fiber n = 8, WT control n = 8, WT HAMSAB n = 8, AD zero fiber n = 10, AD control n = 10, AD HAMSAB n = 9. Data are mean ± SEM. *p < 0.05; **p < 0.01; two-way ANOVA (g,h,j) or one-way ANOVA (b–d,f) and Tukey’s multiple comparison test. Extended Data Figure 3-1 supports Figure 3.
Figure 4.
Figure 4.
Maternal dietary fiber intake alters the microglial transcriptome at 3 weeks. a, Schematic of experimental design created with Biorender.com. WT zero fiber n = 6, WT control n = 8, WT HAMSAB n = 8, AD zero fiber n = 6, AD control n = 8, AD HAMSAB n = 8. b, Multidimensional scaling of gene expression profiles of microglia isolated from 3 week WT and 5xFAD mice whose mothers were fed zero fiber, control, or HAMSAB diet. c, Hierarchical clustering of microglial transcriptomes. d, Gene Ontology analysis shows fiber-upregulated and fiber-downregulated pathways. eh, Representative fiber-upregulated gene clusters. i, Volcano plot of DAM core gene expression. Red dots indicate fiber-upregulated DEGs. Positive log2FC indicates that gene expression is positively associated with fiber. Negative log2FC indicates that gene expression is negatively associated with fiber. Extended Data Figure 4-1 supports Figure 4.
Figure 5.
Figure 5.
Dietary fiber affects brain T-cell signature. a, A gating strategy used to identify populations of immune cells. b–e, Quantification of the number of CD4+ T cells (b), CD8+ T cells (c), CD69+ CD4+ T cells (d), and CD69+ CD8+ T cells (e) from 6 month WT mice and 5xFAD mice fed zero fiber, control, or high-fiber diet (WT zero fiber n = 7, WT control n = 9, WT HAMSAB n = 10, AD zero fiber n = 10, AD control n = 5, AD HAMSAB n = 6). Data are mean ± SEM. *p < 0.05; **p < 0.01; ***p < 0.001; ****p < 0.0001; two-way ANOVA and Tukey’s multiple comparison test.

References

    1. Bachem A, et al.. (2019) Microbiota-derived short-chain fatty acids promote the memory potential of antigen-activated CD8+ T cells. Immunity 51:285–297.e5. 10.1016/j.immuni.2019.06.002 - DOI - PubMed
    1. Bachiller S, Jiménez-Ferrer I, Paulus A, Yang Y, Swanberg M, Deierborg T, Boza-Serrano A (2018) Microglia in neurological diseases: a road map to brain-disease dependent-inflammatory response. Front Cell Neurosci 12:488. 10.3389/fncel.2018.00488 - DOI - PMC - PubMed
    1. Ballarini T, et al.., DELCODE Study Group (2021) Mediterranean diet, Alzheimer disease biomarkers and brain atrophy in old age. Neurology 96:e2920. 10.1212/WNL.0000000000012067 - DOI - PMC - PubMed
    1. Berti V, et al.. (2018) Mediterranean diet and 3-year Alzheimer brain biomarker changes in middle-aged adults. Neurology 90:e1789. 10.1212/WNL.0000000000005527 - DOI - PMC - PubMed
    1. Blacher E, et al.. (2019) Potential roles of gut microbiome and metabolites in modulating ALS in mice. Nature 572:474–480. 10.1038/s41586-019-1443-5 - DOI - PubMed

Publication types