. 2023 Aug 18;14(1):5023.
doi: 10.1038/s41467-023-40679-y.

A genome-wide association study of blood cell morphology identifies cellular proteins implicated in disease aetiology

Affiliations

A genome-wide association study of blood cell morphology identifies cellular proteins implicated in disease aetiology

Parsa Akbari et al. Nat Commun. .

Abstract

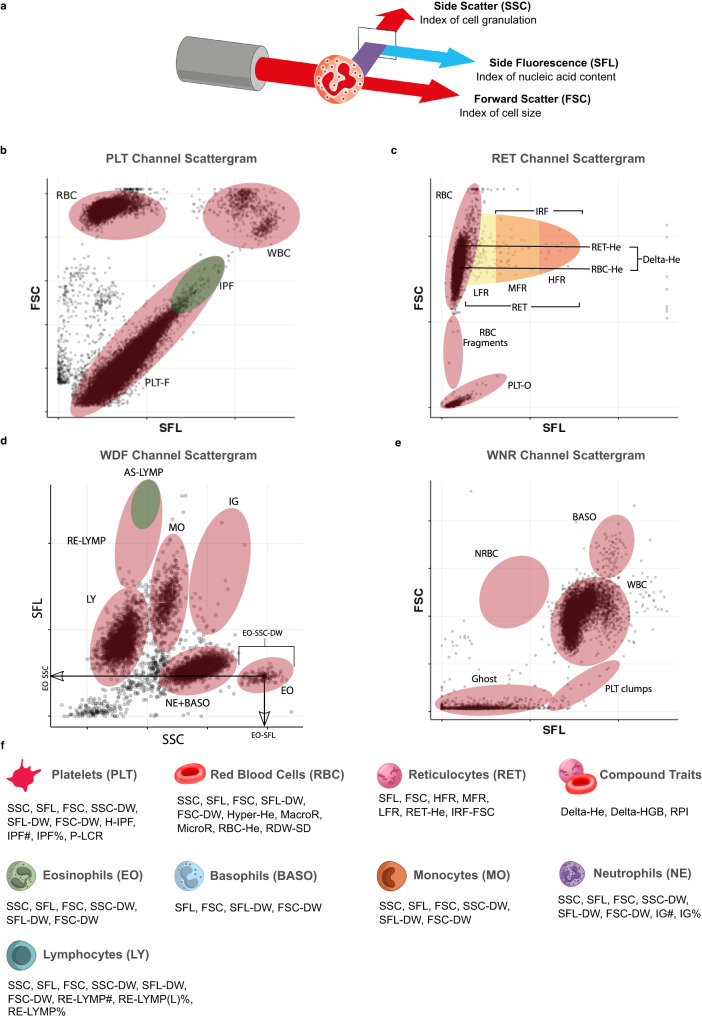
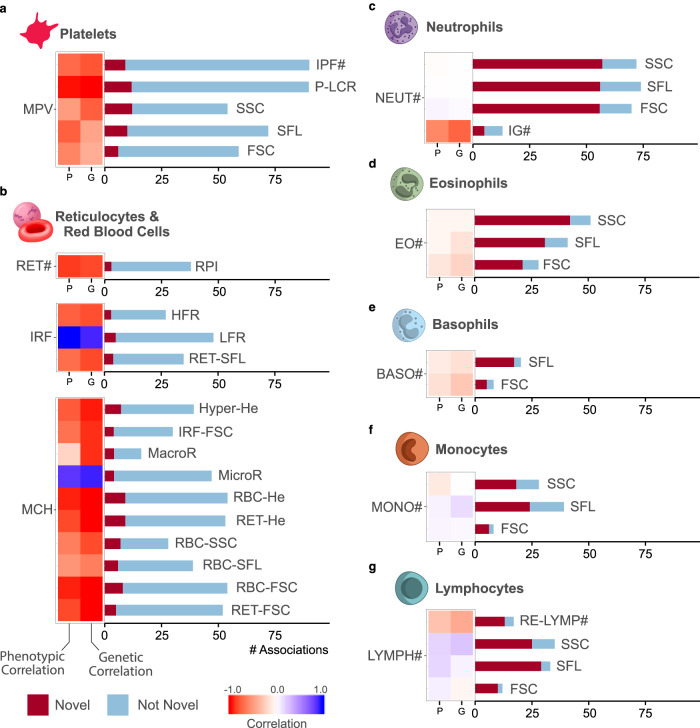
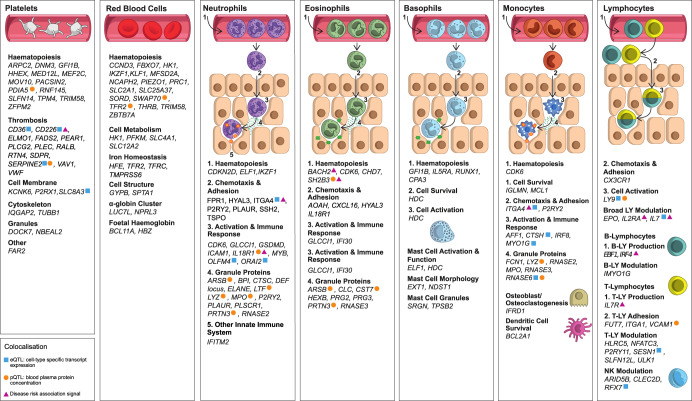
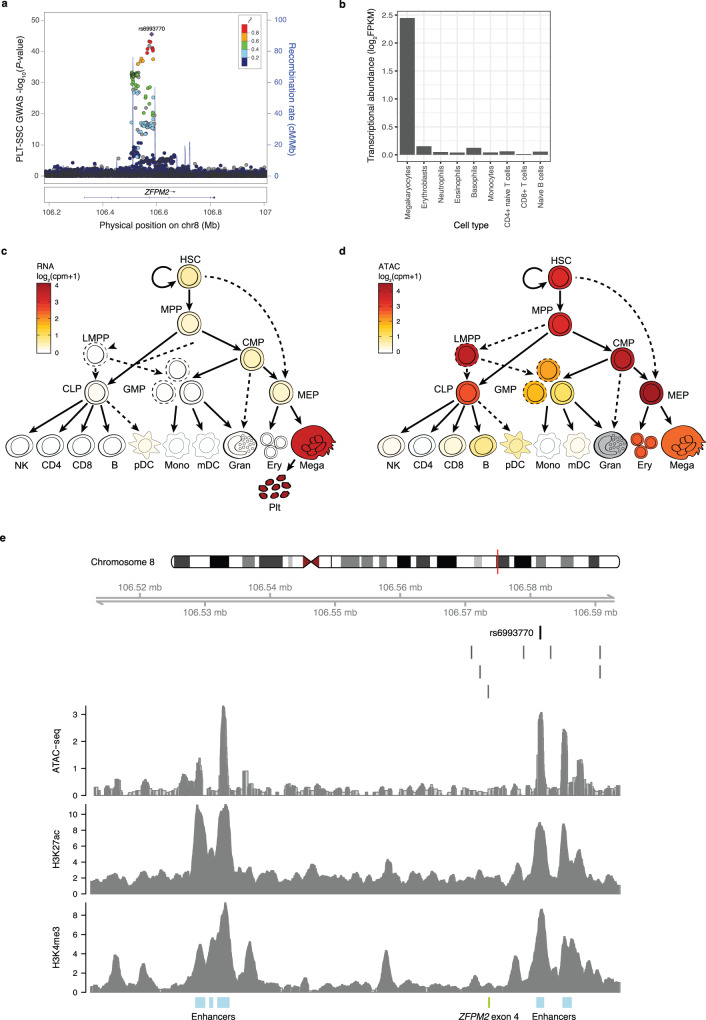
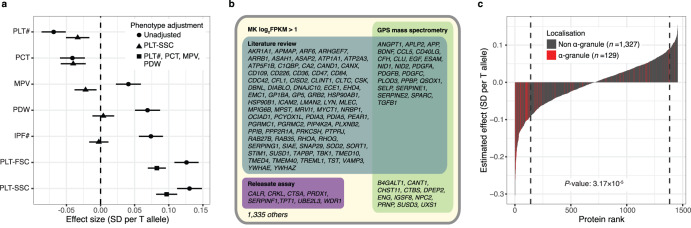
Blood cells contain functionally important intracellular structures, such as granules, critical to immunity and thrombosis. Quantitative variation in these structures has not been subjected previously to large-scale genetic analysis. We perform genome-wide association studies of 63 flow-cytometry derived cellular phenotypes-including cell-type specific measures of granularity, nucleic acid content and reactivity-in 41,515 participants in the INTERVAL study. We identify 2172 distinct variant-trait associations, including associations near genes coding for proteins in organelles implicated in inflammatory and thrombotic diseases. By integrating with epigenetic data we show that many intracellular structures are likely to be determined in immature precursor cells. By integrating with proteomic data we identify the transcription factor FOG2 as an early regulator of platelet formation and α-granularity. Finally, we show that colocalisation of our associations with disease risk signals can suggest aetiological cell-types-variants in IL2RA and ITGA4 respectively mirror the known effects of daclizumab in multiple sclerosis and vedolizumab in inflammatory bowel disease.


Conflict of interest statement

P.A. is an employee of Regeneron Pharmaceuticals and receives salary from and owns options and/or stock of the company. The remaining authors declare no competing interests.

Figures

Fig. 1
Fig. 1. Flow-cytometry traits measured by the Sysmex XN-1000 haematology analyser (adapted from Sysmex XN-1000 Manual).
a Schematic of a granulocyte cell passing through the laser of the internal flow-cytometer of the analyser. The instrument measures the intensities of incident light scattered sidewise (SSC, cell complexity/granularity) by the cell and forward (FSC, cell volume) by the cell and the intensity of the light which is absorbed by the cell and fluoresced at a new wavelength (SFL, cell nucleic acid content). be Cytometry scattergrams from an arbitrary participant in the INTERVAL study: 2-dimensional projections of the cell level intensity data (SSC, SFL, FSC) measured in each of the four XN-1000 flow-cytometry channels active for the INTERVAL study: PLT-F (platelet flow) channel (b), RET (reticulocyte) channel (c), WDF (white cell differential) channel (d), WNR (white cell and nucleated red cell) channel (e). Many of the traits correspond to averages or distribution widths (DWs) of cell level measurements in scattergram regions (indicated approximately by ellipses) occupied by cells of particular types. This is illustrated for three eosinophil traits (in panel d). Supplementary Data 2 contains a full description of the measurement procedure for each trait. f The 63 cytometry traits classified by the type of cells which they measure: platelets (PLT), mature red blood cells (RBC), reticulocytes (RET), neutrophils (NE), eosinophils (EO), basophils (BASO), monocytes (MO) and lymphocytes (LY). The three compound traits (Delta-HE, Delta-HGB, and RPI) depend on measurements of both mature red cells and reticulocytes. We thank Joanna Westmoreland for the artwork in (a) and (f).
Fig. 2
Fig. 2. The distributions of selected ncCBC traits and their covariation with age, sex and BMI.
Summary plots for two exemplar technically adjusted traits (Methods) using data from participants who contribute to the GWAS of the respective trait. The upper row and lower row panels correspond respectively to the platelet side scatter (PLT-SSC, n = 29,675) and monocyte side fluorescence (MO-SFL, n = 39,586) phenotypes. a, b Probability density histograms stratified by sex: female (orange) and male (blue). c, d Covariation between the phenotype and participant age stratified by sex. Parameters of the stratified trait distributions were estimated in bins corresponding to years of age. The linearly interpolated coloured points show estimates of the within strata-means and the underlying coloured ribbons show the corresponding 95% confidence intervals. The dashed lines show estimates of the upper and lower quartiles. e, f Covariation between each trait and body mass index (BMI). Estimates of sex stratified summaries were made in bins of 1 kg m−2. The components of the plots are as for (c, d). Analogous plots for all 63 traits are presented in Supplementary Figs. 1–3.
Fig. 3
Fig. 3. The distribution and novelty of association signals by cell-type.
ag Each panel presents statistics for selected ncCBC traits of the given cell-type. The heat map on the left of each subplot shows the estimated phenotypic (left) and genetic (right) correlation between the cCBC trait indicated to its left and the ncCBC trait corresponding to each horizontal bar. (Each ncCBC trait has been grouped with the cCBC trait studied in Vuckovic et al., with which it has maximal absolute phenotypic correlation in the study sample.) The bar plot on the right of each subplot indicates the number of distinct (conditionally significant) associations identified for each ncCBC trait and the number of distinct associations with variants that do not fall into a LD clump with a variant reported to be associated with a blood trait of the same cell-type by Vuckovic et al. or Chen et al. (‘Novel’),. The absolute genetic correlations between the ncCBC and cCBC traits of white cells are lower than those of red cells and platelets. This is reflected in the variation between cell-types of the proportion of identified associations that are novel. We thank Joanna Westmoreland for the artwork in (ag).
Fig. 4
Fig. 4. Summary of the biological functions of the genes assigned to associated variants identified from a survey of the literature.
Each panel contains a list of genes assigned by VEP or by eQTL/pQTL colocalisation to genetic associations with traits corresponding to the given cell-type, for which a literature search identified evidence of known function. Each list is stratified into functional categories relevant to the cell-type. Supplementary Data 4 contains a complete list of the associated variants, their VEP annotated genes, and relevant references to literature. The coloured symbolic annotations indicate genes assigned to variants which colocalise with eQTL (blue square), pQTL (orange circle), or disease GWAS associations (purple triangle). The gene(s) assigned by eQTL or pQTL colocalisation occasionally differ from the gene(s) assigned by VEP. We thank Joanna Westmoreland for the artwork.
Fig. 5
Fig. 5. The association of rs6993770 with PLT-SSC is mediated by ZFPM2 expression.
a A LocusZoom plot for the ZFPM2 locus. Each dot corresponds to a variant tested for association. The x-axis represents the physical position on chromosome 8 in GRCh37 coordinates. The (left-hand) y-axis represents the −log10(P-value) from a univariable BOLT-LMM test for additive allelic association between the imputed genotypes of the variant and PLT-SSC (n = 29,675). The colour of the dot represents the LD (r2) in the study sample between the corresponding variant and rs6993770. The blue line represents an estimate of the local recombination rate (right-hand y-axis). Conditional analysis identified a single association signal in the 82 kb interval of low recombination containing rs6993770. b The abundance of ZFPM2 transcripts (log2FPKM) in MKs, erythroblasts, neutrophils, eosinophils, basophils, monocytes, CD4+ naive T cells, CD8+ T cells, and naive B cells, in which cell-types ZFPM2 transcription is limited to MKs. c ZFPM2 transcript expression is higher in platelets, MKs and their precursor cell-types—MEP (megakaryocyte-erythroid progenitor cells), CMP (common myeloid progenitor), MPP (multipotent progenitor), and HSC (hematopoietic stem cell)—than in other blood cell and blood cell precursor cell-types. d ATAC-seq applied to multiple blood cell-types show that rs6993770 lies in an open chromatin region in the platelet precursor cell-types MK, MEP, CMP, MPP and HSC. e Measurements of epigenetic activity in MKs across the 82 kb recombination interval containing the association signal. The x-axis represents the physical position on chromosome 8. The dark vertical line indicates the position of rs6993770. The nearby light vertical lines indicate the locations of seven variants in high LD (r2 > 0.9) with rs6993770. The y-axis of each panel corresponds to the sequencing read depth of an epigenetic assay. From top to bottom the panels correspond to ATAC-seq (open chromatin), H3K27ac (a mark of active enhancers) and H3K4me3 (a mark of accessibility to transcription factors). The blue rectangles at the bottom of the figure indicate enhancer regions in MKs inferred from a set of six histone modifications (H3K4me1, H3K4me3, H3K9me3, H3K27ac, H3K27me3 and H3K36me3) using the IDEAS chromatin segmentation algorithm,. The green rectangle indicates the position of exon 4 of ZFPM2. Panels c-d are adapted with permission from Ulirsch, J. C. et al. Interrogation of human hematopoiesis at single-cell and single-variant resolution. Nat. Genet. 51, 683–693 (2019), Springer Nature.
Fig. 6
Fig. 6. ZFPM2 is a regulator of platelet α-granularity.
a Forest plot showing the additive allelic effect of rs6993770-T on the means of the inverse rank normalised distributions of the platelet traits PLT# (platelet count, n = 29,657), PCT (plateletcrit, n = 28,044), MPV (mean platelet volume, n = 28,050), PDW (platelet distribution width, n = 28,052), IPF# (immature platelet fraction count, n = 30,587), PLT-FSC (platelet volume, n = 29,662), and PLT-SSC (platelet granularity, n = 29,675) measured in the INTERVAL study. Circles correspond to estimates of direct effects, triangles correspond to estimates of effects adjusted for PLT-SSC and squares correspond to estimates of effects adjusted for PLT#, PCT, MPV, and PDW. The horizontal lines correspond to 95% confidence intervals. The effect of rs6993770-T on PLT-SSC and PLT-FSC does not appear to be mediated substantially through the four cCBC phenotypes. b A Venn diagram cross classifying the 1456 genes coding for proteins studied by Sun et al. that are expressed in MKs (mRNA transcript log2FPKM > 1). The classifying categories indicate that the protein was implicated as an α-granule protein coding gene by one of: a literature review (turquoise), detection by mass spectrometry of significant under expression in the platelets of grey platelet syndrome patients (which lack α-granules) compared to those of healthy volunteers (green), identification in the platelet releasate—proteins expelled from activated platelets (purple). c The estimated per allele effect of rs6993770-T on the mean concentration of the 1456 plasma proteins. The y-axis measures the per allele effect size and the x-axis its rank. Bars corresponding to proteins localised to platelet α-granules are coloured red. Proteins with ranks in the tails bounded by the dashed lines exhibit significant evidence for an association with rs6993770-T at a relaxed critical threshold (unadjusted P-value < 10−3). α-granule proteins are significantly (embedded two-sided Fisher’s exact test unadjusted P-value) enriched in the negative compared to the positive tail.

References

    1. Johnson AD, et al. Genome-wide meta-analyses identifies seven loci associated with platelet aggregation in response to agonists. Nat. Genet. 2010;42:608–613. - PMC - PubMed
    1. Astle WJ, et al. The allelic landscape of human blood cell trait variation and links to common complex disease. Cell. 2016;167:1415–1429.e19. - PMC - PubMed
    1. Vuckovic D, et al. The polygenic and monogenic basis of blood traits and diseases. Cell. 2020;182:1214–1231.e11. - PMC - PubMed
    1. Chen M-H, et al. Trans-ethnic and ancestry-specific blood-cell genetics in 746,667 individuals from 5 global populations. Cell. 2020;182:1198–1213.e14. - PMC - PubMed
    1. Amulic B, Cazalet C, Hayes GL, Metzler KD, Zychlinsky A. Neutrophil function: from mechanisms to disease. Annu. Rev. Immunol. 2012;30:459–489. - PubMed

Publication types

Substances