. 2023 Aug 18;14(1):5029.
doi: 10.1038/s41467-023-40271-4.

Spatial transcriptomics reveals distinct and conserved tumor core and edge architectures that predict survival and targeted therapy response

Affiliations

Spatial transcriptomics reveals distinct and conserved tumor core and edge architectures that predict survival and targeted therapy response

Rohit Arora et al. Nat Commun. .

Abstract

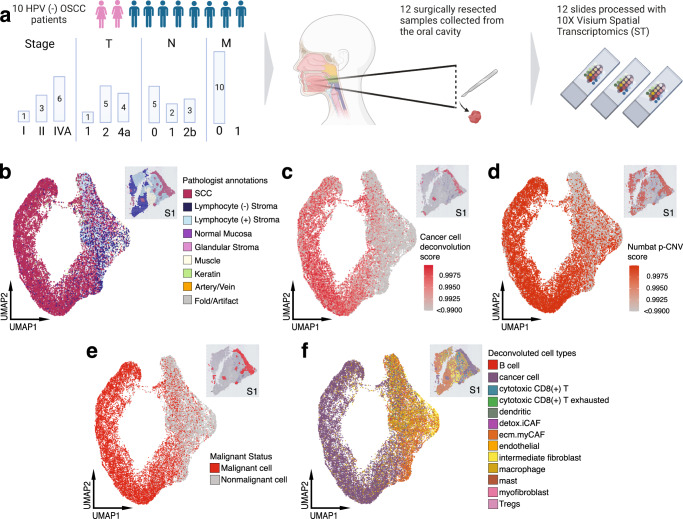
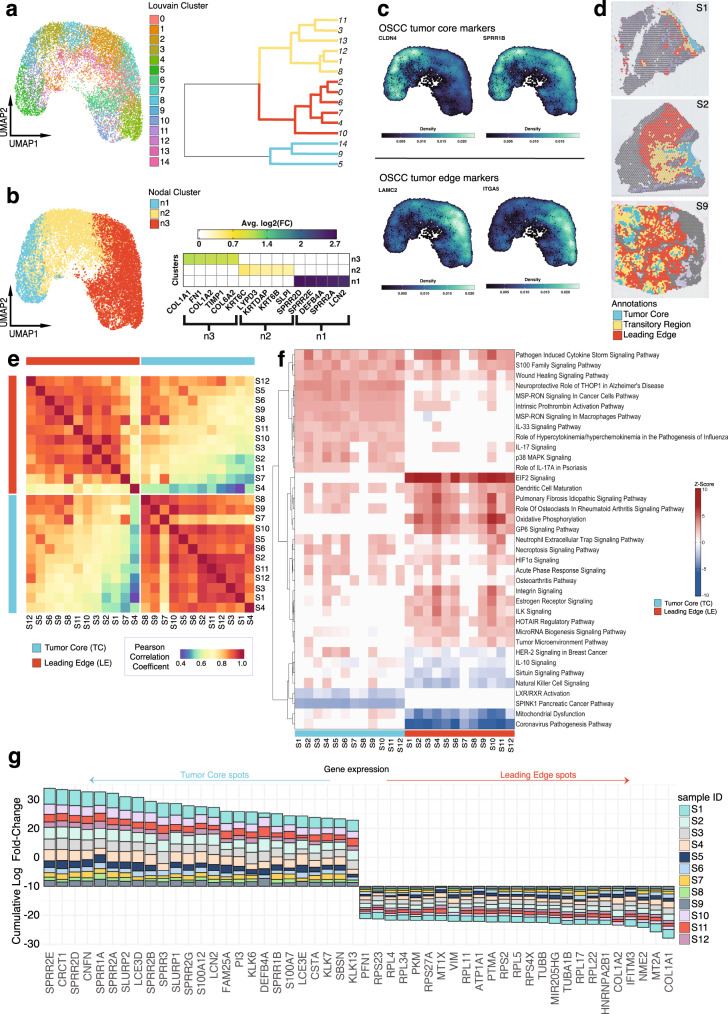
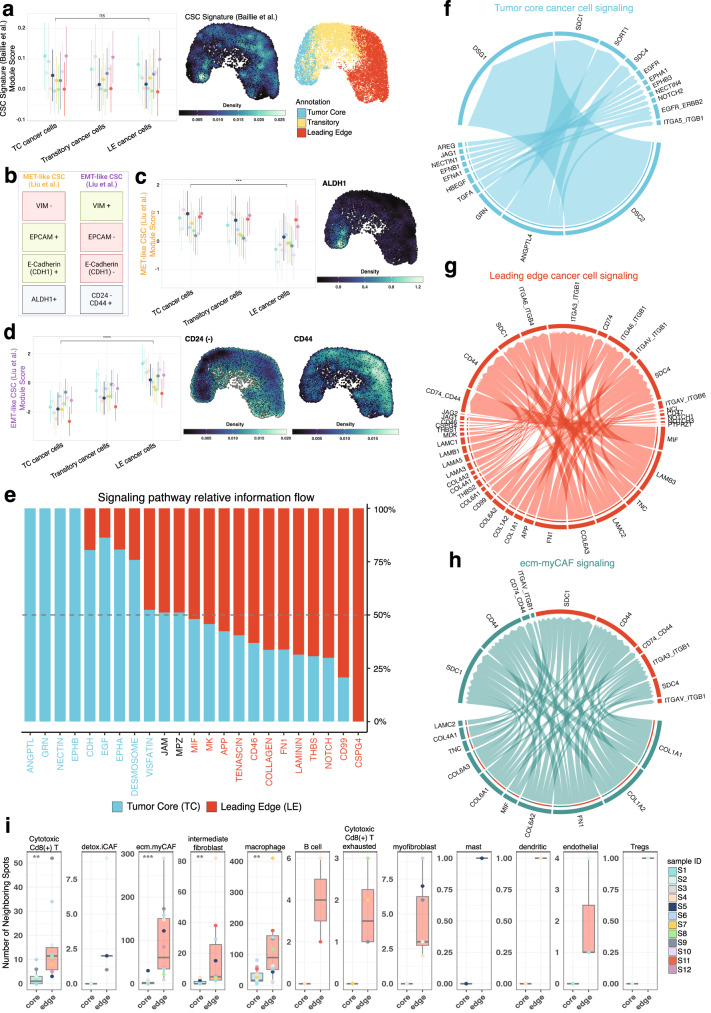
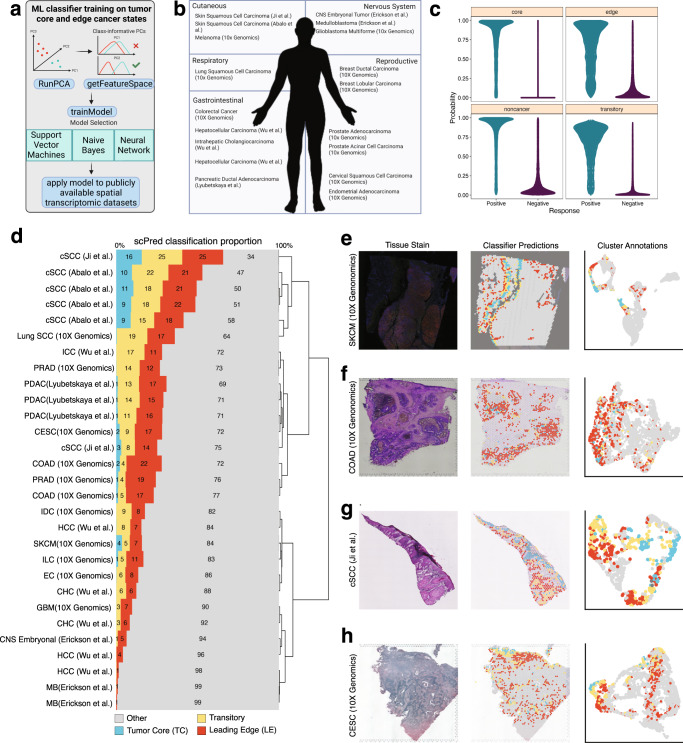
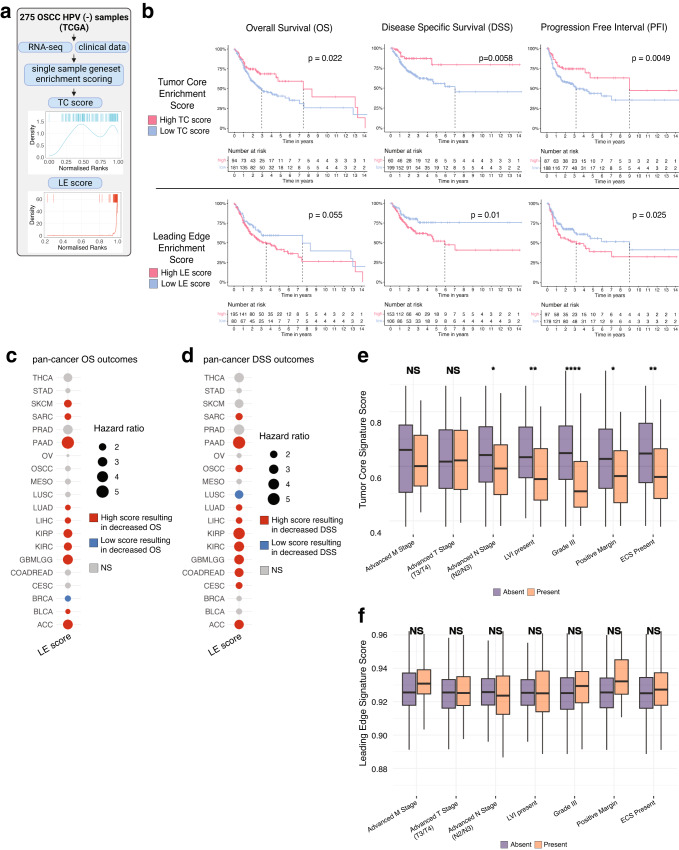
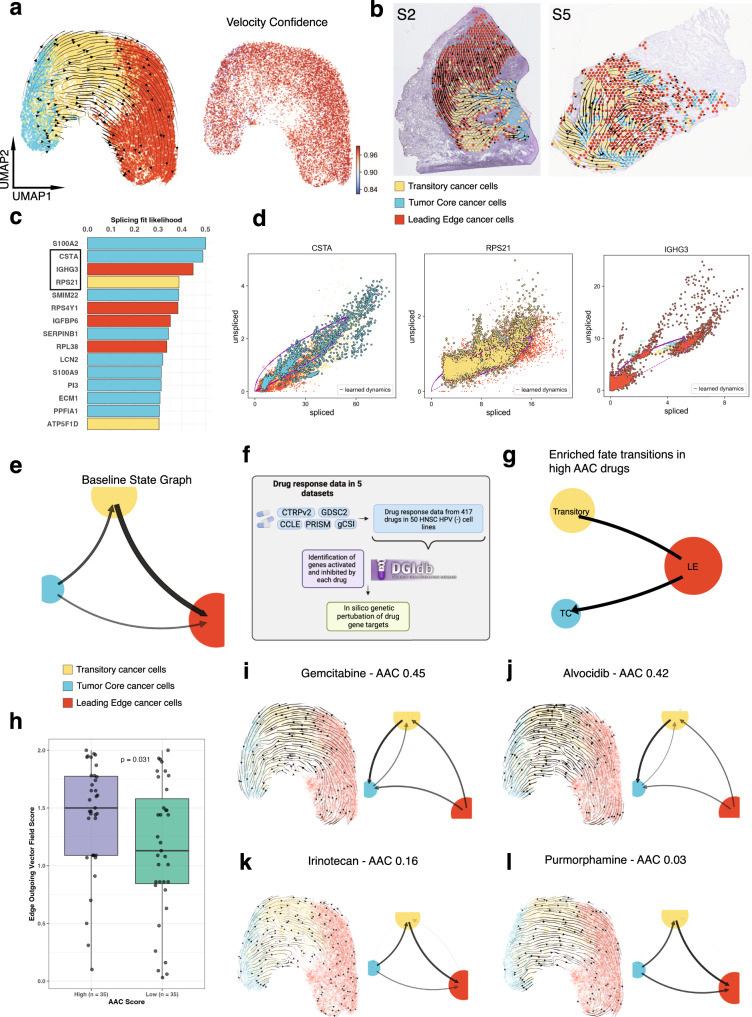
The spatial organization of the tumor microenvironment has a profound impact on biology and therapy response. Here, we perform an integrative single-cell and spatial transcriptomic analysis on HPV-negative oral squamous cell carcinoma (OSCC) to comprehensively characterize malignant cells in tumor core (TC) and leading edge (LE) transcriptional architectures. We show that the TC and LE are characterized by unique transcriptional profiles, neighboring cellular compositions, and ligand-receptor interactions. We demonstrate that the gene expression profile associated with the LE is conserved across different cancers while the TC is tissue specific, highlighting common mechanisms underlying tumor progression and invasion. Additionally, we find our LE gene signature is associated with worse clinical outcomes while TC gene signature is associated with improved prognosis across multiple cancer types. Finally, using an in silico modeling approach, we describe spatially-regulated patterns of cell development in OSCC that are predictably associated with drug response. Our work provides pan-cancer insights into TC and LE biology and interactive spatial atlases ( http://www.pboselab.ca/spatial_OSCC/ ; http://www.pboselab.ca/dynamo_OSCC/ ) that can be foundational for developing novel targeted therapies.


Conflict of interest statement

R.A. was a bioinformatics consultant at Phenomic AI. R.K.A was previously a Venture Fellow at Flagship Pioneering. R.K.A has served as a Technical Consultant for the Bill and Melinda Gates Foundation Strategic Investment Fund and was a former Senior Policy Advisor at Health Canada. R.K.A also holds a minority stake in Alethea Medical. P.B. is the co-founder and Vice President of Management and Planning at OncoHelix, Inc. All other study authors declare no competing interests.

Figures

Fig. 1
Fig. 1. Overview of experimental design for ST analysis and cellular deconvolution of OSCC patient samples.
a Schematic representing patient clinical data and sample acquisition and processing strategy. UMAP projection of 24,876 spots aggregated from all 12 spatially-profiled samples colored based-on. Created with BioRender. b Pathologist annotations, c single-cell HNSCC deconvolution based on scRNA-seq data from Puram et al., d CNV probability per spot, e malignant spot status, and f. spot annotations based on deconvolution and CNV probabilities. HPV human papillomavirus, OSCC oral squamous cell carcinoma, SCC squamous cell carcinoma, Tregs T-regulatory cell.
Fig. 2
Fig. 2. TC and LE are spatially unique regions in the OSCC microenvironment.
a UMAP projection of 13950 malignant spots aggregated from all 12 spatially-profiled samples, partitioned by Louvain clusters with an accompanying phylogenetic tree demonstrating cluster transcriptomic similarity. b UMAP projection of 13950 malignant spots aggregated from all 12 spatially-profiled samples partitioned by three major nodal clusters, with an accompanying heatmap visualizing the log2(FC) of the top 5 DEGs for each cluster. c Nebulosa kernel density plot visualizing gene expression of literature-validated OSCC tumor core and leading edge markers. d TC transitory, and LE annotations for samples 1, 2, and 9. e Whole transcriptome Pearson correlation heatmap of TC and LE annotations across all spatially-profiled samples. Samples are ordered based on transcriptomic similarity. f Ingenuity Pathway Analysis heatmap visualizing predicted activation and deactivation of TC and LE pathways. Pathways are displayed if they are activated or deactivated across 10 or more samples and ordered based on similarity of z-score for each pathway across samples. g Consensus plot displaying the cumulative average logFC for the top 25 genes significantly differentially expressed between the TC and LE across more than 9 samples (adj. p < 0.001, two-sided Wilcox rank sum test, Bonferroni correction). Source data are provided as a Source Data file where relevant. UMAP uniform manifold approximation projection, OSCC oral squamous cell carcinoma.
Fig. 3
Fig. 3. TC and LE cancer cell states are distinct entities with unique ligand-receptor interactions.
a Comparative expression of a CSC gene signature across TC, LE, and other squamous cell carcinoma (SCC) spots, visualized with nebulosa kernel density plot. UMAP of TC, LE, and transitory cancer spot annotations are provided for spatial reference. Circles are representative of mean and lines represent standard deviation (n = 12 samples across 10 independent patients). b Schematic representation of epithelial (eCSC) and mesenchymal cancer stem cell (mCSC) markers characterized by Liu et al. . c, d Comparative expression of mCSCs (p-value = 2e−04) and eCSC (p-value = 1.5e−06) gene sets across the TC, LE, and other SCC spots with nebulosa kernel density plot visualizing mCSCs and eCSC markers. Circles are representative of mean and lines represent standard deviation (n = 12 biologically independent samples). e Stacked bar plot visualizing enriched signaling pathways by overall information flow across TC and LE spots. Pathways are colored by their dominance within the TC or LE. Circos plots describing spatially deconvolved ligand-receptor pairs involved in cell-cell interactions between f cancer cells in the TC, g cancer cells in the LE, and h ecm-myCAF and cancer cells in the LE. The width of connecting bands represents the strength of ligand-receptor interaction. i Comparative boxplot representing the number of noncancer spots directly adjacent to TC and LE spots. Non-cancer spot identity was determined based on the most enriched non-cancer cell type deconvolution. Groups were compared using a two sided Wilcoxon rank sum test with a Benjamini–Hochberg FDR correction *p < 0.05, **p < 0.01, ***p < 0.001, ****p < 0.0001. P-values for Cytotoxic CD8 T cells = 0.003, ecm.myCAF = 2.2e−04, intermediate fibroblast = 0.002, macrophage = 0.008 (n = 12 samples across 10 independent patients). Box spans 25th–75th percentiles, center line indicates median, whiskers extend to minima and maxima within 1.5*IQR. Source data are provided as a Source Data file where relevant. Abbreviations: CSC cancer stem cell, TC tumor core, LE leading edge, MET mesenchymal-epithelial transition, EMT epithelial-mesenchymal transition, CD24 (−) inverse CD24 gene expression (1/CD24), Tregs T regulatory cells.
Fig. 4
Fig. 4. A Machine Learning model identifies conserved TC and LE signatures across multiple cancer types.
a Infographic describing the ML strategy used for the identification of TC and LE gene signatures in publicly-available spatially-profiled samples. b Infographic describing publicly-available spatially-profiled samples,–, included in subsequent ML-training dataset. Created with BioRender. c Probability distribution plotted across TC, LE, transitory, and other regions. d Bar plot displaying the scPred classification score of each spatially distinct region across 30 different spatially profiled samples. The plot is clustered based on the similarity in predicted proportion of TC, LE, transitory, and other regions. eh H&E-stained tissue section (left), scPred projections on stained tissue (middle), and a UMAP colored by scPred classification (right) for cSCC, COAD, and CESC representative spatial transcriptomics testing datasets. UMAP uniform manifold approximation projection, cSCC cutaneous squamous cell carcinoma, SCC squamous cell carcinoma, ICC intrahepatic cholangiocarcinoma, PRAD prostate adenocarcinoma, PDAC pancreatic ductal carcinoma, CESC cervical squamous cell carcinoma, COAD colon adenocarcinoma, IDC invasive ductal carcinoma, HCC hepatocellular carcinoma, SKCM skin cutaneous melanoma, ILC invasive lobular carcinoma, EC endometrial adenocarcinoma, CHC combined hepatocellular and cholangiocarcinoma, GBM glioblastoma multiforme, CNS embryonal central nervous system embryonal tumor, MB medulloblastoma.
Fig. 5
Fig. 5. Survival associations and prognostic characteristics of the TC and LE signature.
a Infographic describing TC and LE single-sample gene-set scoring strategy for TCGA transcriptomic data. b Kaplan–Meier visualizations of OS, DSS, and PFI end-points stratified by TC (upper panels) and LE (lower panels) gene set enrichment scores among 275 OSCC samples. P-values displayed were calculated using a cox proportional hazards regression. c, d OS and i DSS pan-cancer outcomes for TC and LE gene-set enrichment scores derived from 20 common cancer types from TCGA. P-values and hazard ratios displayed were calculated using a cox proportional-hazard regression. e, f Bar plots showing the relative TC and LE enrichment score in relation to relevant clinico-pathological covariates. Significance was determined using a two-sided Wilcoxon rank sum test with a Benjamini–Hochberg FDR correction applied. Error bars represent standard error of mean (SEM). *p < 0.05, **p < 0.01, ***p < 0.001, ****p < 0.0001. P-values for advanced N stage = 0.018, LVI = 0.002, grade III = 1.8e−06, positive margin = 0.02, ECS = 0.002 (n = 275 biologically independent HPV negative OSCC samples). Box spans 25th–75th percentiles, center line indicates median, whiskers extend to minima and maxima within 1.5*IQR. Source data are provided as a Source Data file where relevant. Abbreviations: TC tumor core, LE leading edge, THCA thyroid carcinoma, STAD stomach adenocarcinoma, SKCM skin cutaneous melanoma, SARC sarcoma, PRAD prostate adenocarcinoma, PAAD pancreatic adenocarcinoma, OV ovarian serous cystadenocarcinoma, OSCC oral squamous cell carcinoma, MESO mesothelioma, LUSC lung squamous cell carcinoma, LUAD lung adenocarcinoma, LIHC liver hepatocellular carcinoma, KIRP kidney renal papillary cell carcinoma, KIRC kidney renal clear cell carcinoma, GBMLGG brain lower grade glioma and glioblastoma multiforme, COADREAD colon adenocarcinoma/rectal adenocarcinoma, CESC cervical squamous cell carcinoma, BRCA breast invasive carcinoma, BLCA bladder urothelial carcinoma, ACC adrenocortical carcinoma, LVI lymphovascular invasion, ECS extracapsular spread.
Fig. 6
Fig. 6. Analysis of RNA splicing dynamics reveals differential developmental trajectories and therapeutic vulnerabilities in the TC and LE.
a UMAP of spatially deconvolved cancer cell spots, with overlaid RNA velocity streams, colored based on TC, transitory, and LE annotations, and UMAP plot with overlaidRNA velocity confidence. b Representative spatially profiled samples (samples 2 and 5) overlayed with RNA velocity streams and colored by TC and LE cancer cell annotations. c Bar plot visualizing top differentially spliced genes (genes with dynamic splicing behavior) within TC and LE regions. Bars are colored by whether a higher proportion of the gene exists in its spliced form in the TC or LE. d Phase portraits showing the ratio of spliced and unspliced RNA for top differentially spliced genes, purple lines depict predicted splicing steady state. e Cell fate transition probability state graph for TC, transitory, and LE annotations as inferred by vector field integration. f Infographic describing strategy used to systematically collect drug response data and test in silico drug perturbations. Created with BioRender. g Infographic state graph plot highlighting cell fate transitions enriched in high AAC drugs. h Boxplot comparing edge outgoing vector field strengths between high AAC and low AAC drugs stratified based on median. AAC groupings are compared using a two-sided Wilcoxon rank sum test (n = 70 independent drugs). Box spans 25th–75th percentiles, center line indicates median, whiskers extend to minima and maxima within 1.5*IQR. UMAPs showing the resultant vector field and state graphs following in silico perturbations of two targets of (i, j) high (effective) AAC anticancer drugs, and (k, l) low AAC anticancer drugs. Source data are provided as a Source Data file where relevant. Abbreviations: AAC area above curve.

References

    1. Markopoulos AK. Current aspects on oral squamous cell carcinoma. Open Dent. J. 2012;6:126–130. doi: 10.2174/1874210601206010126. - DOI - PMC - PubMed
    1. Ng JH, Iyer NG, Tan MH, Edgren G. Changing epidemiology of oral squamous cell carcinoma of the tongue: a global study: changing epidemiology of tongue cancer. Head. Neck. 2017;39:297–304. doi: 10.1002/hed.24589. - DOI - PubMed
    1. Moore S, Johnson N, Pierce A, Wilson D. The epidemiology of mouth cancer: a review of global incidence. Oral. Dis. 2008;6:65–74. doi: 10.1111/j.1601-0825.2000.tb00104.x. - DOI - PubMed
    1. Sung, H. et al. Global Cancer Statistics 2020: GLOBOCAN estimates of incidence and mortality worldwide for 36 cancers in 185 countries. CA Cancer J. Clin.71, 209–249 (2021). - PubMed
    1. Johnson DE, et al. Head and neck squamous cell carcinoma. Nat. Rev. Dis. Prim. 2020;6:92. doi: 10.1038/s41572-020-00224-3. - DOI - PMC - PubMed

Publication types

MeSH terms