. 2023 Aug 18;14(1):5024.
doi: 10.1038/s41467-023-40688-x.

An idiosyncratic zonated stroma encapsulates desmoplastic liver metastases and originates from injured liver

Affiliations

An idiosyncratic zonated stroma encapsulates desmoplastic liver metastases and originates from injured liver

Carlos Fernández Moro et al. Nat Commun. .

Abstract

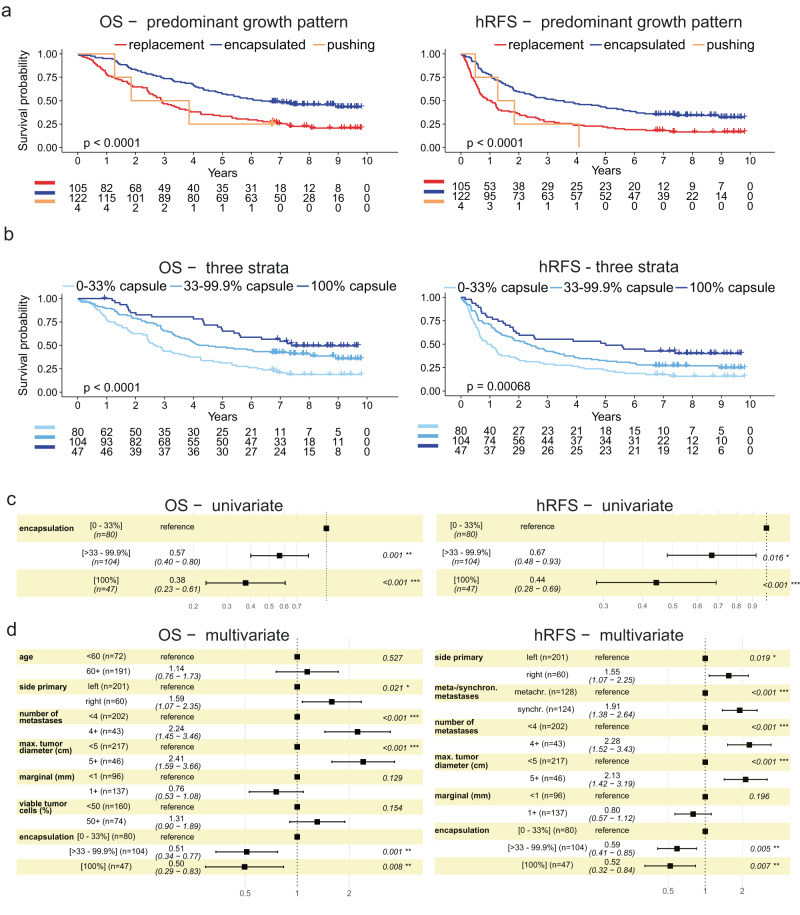
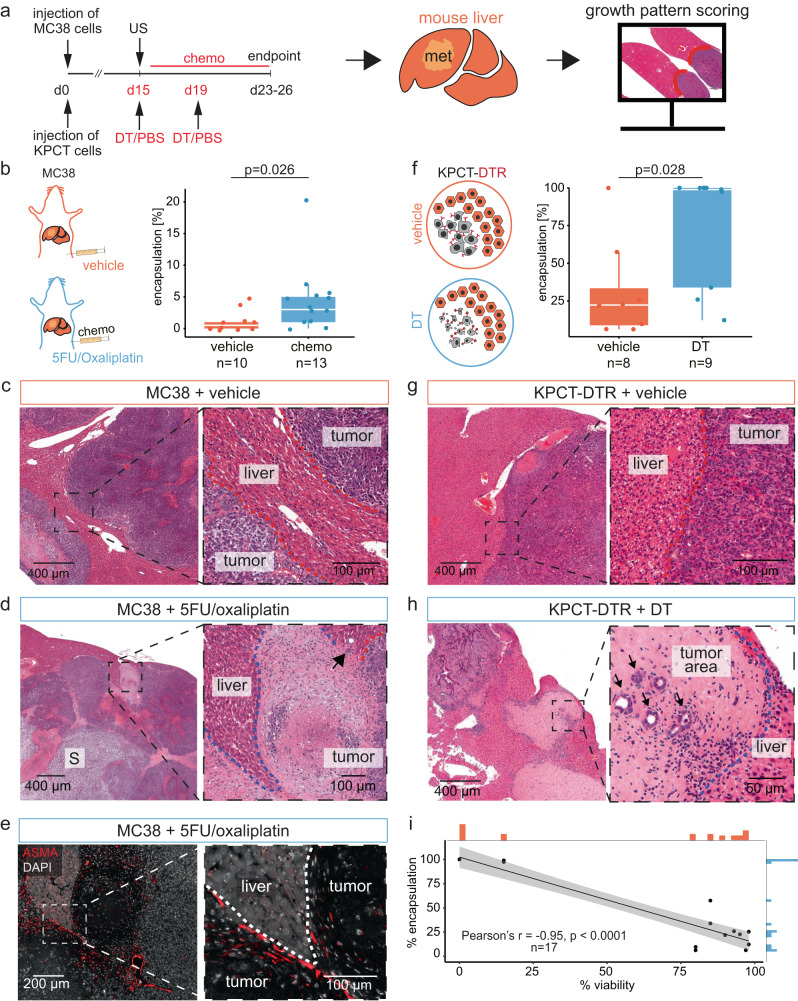
A perimetastatic capsule is a strong positive prognostic factor in liver metastases, but its origin remains unclear. Here, we systematically quantify the capsule's extent and cellular composition in 263 patients with colorectal cancer liver metastases to investigate its clinical significance and origin. We show that survival improves proportionally with increasing encapsulation and decreasing tumor-hepatocyte contact. Immunostaining reveals the gradual zonation of the capsule, transitioning from benign-like NGFRhigh stroma at the liver edge to FAPhigh stroma towards the tumor. Encapsulation correlates with decreased tumor viability and preoperative chemotherapy. In mice, chemotherapy and tumor cell ablation induce capsule formation. Our results suggest that encapsulation develops where tumor invasion into the liver plates stalls, representing a reparative process rather than tumor-induced desmoplasia. We propose a model of metastases growth, where the efficient tumor colonization of the liver parenchyma and a reparative liver injury reaction are opposing determinants of metastasis aggressiveness.


Conflict of interest statement

The authors declare no competing interests.

Figures

Fig. 1
Fig. 1. Extended versus standard scoring of colorectal cancer liver metastases.
a “Desmoplastic” or “encapsulated” pattern (left panel): A stromal rim separates tumor cells and liver parenchyma. The dashed line indicates the liver-capsule border, the continuous line indicates the distance from the liver to the nearest tumor across the capsule. Replacement pattern (right panel): Cancer cells are in contact with hepatocytes, appearing to replace them. The dashed line indicates the liver-tumor border. Images are representative of all the metastases in the cohort (n > 500). b Schematic of slide selection and extended annotations on whole slide images (WSIs). 1 (Selection): All available sections from each patient are reviewed using light microscopy of all available hematoxylin & eosin stains, and of all immunohistochemical stains, if available. Macroscopic pictures are used as guidance (related to Supplementary Fig. 1). The sections representing the largest metastasis diameter, maximizing the representation of the tumor-liver interface are selected from archived tissue, and slides without liver parenchyma as well as overlapping slides are excluded. 2 (Digitalization): Selected slides are digitized to WSIs. 3 (Puzzle): Multiple WSIs from the selected slides are combined, and final verification of correct selection (most complete representation and avoidance of overlaps) is performed; non-digitized slides are revisited if significant parts of the tumor-liver interface are missing. The dashed black line represents the tumor-liver interface. 4: (Annotation): Each slide is manually annotated for each growth pattern, indicated by the lines (red: replacement, blue: encapsulated). c Sankey plot depicting reclassifications resulting from visual estimates compared to extended WSI-based scoring. d Sankey plot showing reclassifications based on the indicated percentages of desmoplastic encapsulation; n = 94 patients for (c) and (d); source data are provided with the Source Data file.
Fig. 2
Fig. 2. Prognostic trifurcation by fraction of encapsulation.
a Overall survival (OS, left) and liver-specific (hepatic) relapse-free survival (hRFS, right), when scored by the predominant growth pattern, replacement, encapsulated, or pushing. b OS and hRFS stratified by the indicated proportions of encapsulation. Two-sided log-rank p-values given in the plots, (a) and (b). OS – predominant growth pattern, p = 0.000075; hRFS – predominant growth pattern, p = 0.000097; OS – three strata, p = 0.000038; hRFS – three strata, p = 0.000676. c Univariate Cox proportional hazard regression using three strata of encapsulation, OS left; hRFS right. OS – 100% encapsulation, p = 0.000063; hRFS – 100% encapsulation, p = 0.000312. d Multivariate Cox proportional hazard analysis using encapsulation in three strata; OS left; hRFS right. Hazard ratio (HR) with 95% confidence interval shown in brackets. Two-sided Wald-test p-value, asterisks represent significance levels; ***p < 0.001, **p < 0.01, *p < 0.05. OS – number of metastases, p = 0.000298; OS – max. tumor diameter (cm), p = 0.000037; hRFS – meta-/synchronous metastases, p = 0.000107; hRFS – number of metastases, p = 0.000070; hRFS – max. tumor diameter (cm), p = 0.000241.
Fig. 3
Fig. 3. Similarity of the capsule to benign fibrosis.
a Quantification of nerve growth factor receptor (NGFR) and alpha-smooth muscle actin (ASMA) protein expression in tumor, perimetastatic capsule, and liver, based on immunohistochemistry stains; the lines represent rolling averages, the areas represent the 95% confidence interval (CI; n = 6 patients). Note increased expression of NGFR and ASMA towards the outer, perihepatic edge of the rim. b Representative example (of n = 6 metastases from n = 6 patients) of ASMA staining (red), with cluster of differentiation (CD)146 (brown) marking, among other structures, ductular reactions. c Representative example (of n = 6 metastases from n = 6 patients) of NGFR+ gradient; note the strong NGFR expression (red) increasing towards the liver. CD146 (brown); arrowhead: intratumoral stroma; arrow: portal tract remnant in the capsule. PT: portal triad; note the NGFR+ portal stroma. d Representative hematoxylin and eosin stain (left panel) and corresponding image of 6-plex immunofluorescence of the indicated proteins, using 4′,6-diamidino-2-phenylindole (DAPI) for nuclear staining (right panel). Representative of n = 6 metastases from n = 6 patients; different patients from (a)–(c). e Quantification of immunofluorescence protein expression in the indicated regions; the lines represent rolling averages, the areas represent 95% CI (n = 6, for which at least n = 4 cases were quantified per stain; different encapsulated cases than shown in [a]). Tissue factor (TF) was analyzed in a separate run and is not included in the representative image (d). f Multiplex immunofluorescence of the sample shown in (d) for ASMA (left), fibroblast-associated protein (FAP, right), and for a composite ASMA, FAP, DAPI (large panel to the right); FAP dominates in the tumor center, ASMA increases towards the liver side of the capsule. Growth pattern indicated in red (replacement) or blue (encapsulated). The dashed white line marks the inner and outer borders of the capsule. Source data for the plots in (a) and (e) are provided with the Source Data file. Thresholding for low-intensity values was used in the fluorescent images in panels (d) and (f) to reduce autofluorescensce background in the channels depicting ASMA (480 nm) and PDGFRa (520 nm). Quantification for these channels was done by subtracting the signal from the automatically generated autofluorescence channel, without thresholding.
Fig. 4
Fig. 4. Protein expression gradients in the capsule.
a Immunohistochemistry (IHC)-based quantification of C-reactive protein (CRP) and cytokeratin 18 (CK18) across the entire perimeter of the fibrotic rim and in the perimetastatic liver parenchyma. Average values from n = 6 metastases, for which the entire desmoplastic rim was measured; the lines represent rolling averages, the areas represent 95% confidence intervals (CIs). b, c Representative examples of CRP, CK18/cluster of differentiation (CD) 68 IHC staining, as indicated. The dashed line marks the rim’s outer border; the solid line denotes the rim’s thickness. d Quantification of CD34 (endothelium), CD68 (macrophages), and CK7 (bile ducts and ductular reactions); rolling averages/CIs of results from n = 6 patients are shown. ef Representative images of the indicated IHC stains. A dashed line marks the outer border of the rim; the solid line denotes the thickness of the rim, and arrows point at CD34+ vessel remnants in the rim. Panels (b), (c), (e), (f) are representative of n = 6 metastases from n = 6 patients, corresponding to the quantifications shown in panels (a) and (d). Source data for the plots in (a) and (d) are provided with the Source Data file.
Fig. 5
Fig. 5. Liver parenchymal remnants in the capsule.
a mRNA in situ hybridization (ISH) of an encapsulated CRLM for albumin (ALB), nuclear stain with 4′,6-diamidino-2-phenylindole (DAPI). Arrows: ALB+ cells in the rim. Dashed line: liver-rim interface; dotted line: metastasis border towards the liver. Representative image of n = 4 encapsulated metastases. b Left: Whole-slide image (hematoxylin & eosin), annotated for the capsule and portal tract (PT) remnants: blue area marks the rim; red dots mark PTs consisting of artery and bile duct (A + BD), green dots mark PTs consisting of artery remnants (A). Right: Magnification, blue line marks the rim-liver interface, A remnants highlighted in blue, A + BD remnant highlighted in orange; representative of n = 49 patients. c PT density in the desmoplastic rim of encapsulated metastases from n = 49 patients, based on n = 141 whole-slide images (WSIs). d Box-and-Whisker plot of the distributions of PT arteries (A) and PT remnants consisting of artery and bile duct (A + BD). Result from two-sided Wilcoxon rank sum test is presented in the panel; based on the same data as (c). Median (line), interquartile range (box), minimum and maximum values within 1.5 times the IQR from the first and third quartiles (whiskers) and individual datapoints are shown. e Heatmap summarizing zonated expression patterns derived from different analysis modalities: immunohistochemistry (IHC, corresponding to Figs. 3a, 4d), multiplex RNA ISH (corresponding to Supplementary Fig. 5d) and multiplex immunofluorescence (m-IF, corresponding to Fig. 3e). Source data for the plots in (c, d) are provided with the Source Data file.
Fig. 6
Fig. 6. Impact of neoadjuvant chemotherapy on growth pattern frequency.
a Change in percentages of encapsulated, pushing, and replacement patterns in patients who received chemotherapy vs. those who did not; Box-and-Whisker plot with median (line), interquartile range (box), minimum and maximum values within 1.5 times the IQR from the first and third quartiles (whiskers) and individual datapoints are shown. Result from two-sided Wilcoxon-test shown in the panel. b Distribution of the growth patterns per slide in chemonaive patients and patients who received neoadjuvant chemotherapy. Note the difference in encapsulation (blue). c, d Correlation between the percentages of encapsulated growth pattern and percentages of viable tumor cells in chemotherapy-treated (c) vs. untreated (d) patients. Individual datapoints and linear regression model (black line) with confidence intervals (in gray) are shown in (c) and (d). e Example of a treated metastasis (hematoxylin & eosin; representative of metastases from n = 165 patients), illustrating viable tumor cells remote from the surrounding liver parenchyma. The black circled structures denote necrotic tumor, the blue line the encapsulated, and the red line the replacement growth pattern. f Growth pattern frequencies of patients with stable disease or regression (orange) vs patients that progressed on neoadjuvant chemotherapy (blue); Box-and-Whisker plot, median (line), interquartile range (box), minimum and maximum values within 1.5 times the IQR from the first and third quartiles (whiskers) and individual datapoints are shown. Result from two-sided Wilcoxon-test shown in the panel. g Representative image (of n = 8 patients; hematoxylin & eosin) of a treated metastasis that progressed during chemotherapy, red line indicates (replacement-type) invasion front. Source data for the plots in (a), (c), (d), and (f) are provided with the Source Data file.
Fig. 7
Fig. 7. Induction of perimetastatic encapsulation by chemotherapy and tumor cell ablation in mice.
a Experiment schematic. US: ultrasound. b Percentages of metastasis encapsulation in mice injected with MC38 cells and treated with either vehicle (saline) or 5-fluorouracil and oxaliplatin (5FU/Oxa); n = 30 mice were injected with MC38 cells, of which n = 24 mice had visible tumors on ultrasound (day 15); those were included and randomized into chemotherapy (n = 14) or saline (n = 10) treatment groups. No tumor was seen on histology of one mouse in the treatment group. Box-and-Whisker plot, result from two-sided Wilcoxon-test shown in the panel, median (line), interquartile range (box), minimum and maximum values within 1.5 times the IQR from the first and third quartiles (whiskers). c Histomorphology (hematoxylin & eosin) of mice bearing MC38 metastases treated with vehicle (saline) and d treated with 5FU/Oxa. Red dashed line indicates replacement, blue indicates encapsulated pattern. S: sarcomatoid growth. e Representative immunofluorescence for alpha-smooth muscle actin (ASMA, red) in an encapsulated, treated metastasis. The dashed lines indicate the rim-liver border. Representative of stains on metastases from n = 3 5FU/Oxa treated mice. f Percentages of metastasis encapsulation in mice treated with vehicle (phosphate-buffered saline, PBS) or diphtheria toxin (DT). n = 17 KPCT-DTR tumor-bearing mice (of n = 30 initially injected with KPCT cells) were treated either with PBS (n = 8) or DT (n = 9). Box-and-Whisker plots, result from two-sided Wilcoxon-test shown in the panel, median (line), interquartile range (box), minimum and maximum values within 1.5 times the IQR from the first and third quartiles (whiskers). g Representative histomorphology (hematoxylin & eosin) of liver metastases from mice treated with vehicle or h DT. Dashed lines as in (c, d). i Correlation of annotated percentages of encapsulated growth pattern and percentages of viable tumor cells in all mice n = 17 of this experiment, irrespective of treatment group. Individual datapoints and linear regression model (black line) with confidence intervals (in gray) are shown. Pearson correlation coefficient r with p-value shown in the panel, p = 0.0000000046. Source data for the plots in (b), (f) and (i) are provided with the Source Data file.
Fig. 8
Fig. 8. Illustration of zonation of the perimetastatic capsule.
Normal liver to the left, a central vein (CV) and a portal triad (PT) are indicated. At the outer part of the rim, liver atrophy and fibrotic stroma similar to benign liver fibrosis can be seen. PT remnants consisting of artery and bile duct (A + BD) or only artery surrounded by remnant of portal stroma (A), as well as hepatocyte-derived Albumin+ cells can be found in the rim. The stroma in the tumor still contains those remnants, although at a lower frequency. Together, the histology of the rim and its clinical characteristics (potentially inducible by chemotherapy and associated with decreased tumor cell viability, in conjunction with the proportion-dependency of outcome) suggest a model in which the perimetastatic capsule evolves upon failed replacement-type growth and represents a reparative hepatic injury reaction.

References

    1. Hanahan D. Hallmarks of cancer: new dimensions. Cancer Discov. 2022;12:31–46. doi: 10.1158/2159-8290.CD-21-1059. - DOI - PubMed
    1. Latacz, E. et al. Histopathological growth patterns of liver metastasis: updated consensus guidelines for pattern scoring, perspectives and recent mechanistic insights. Br. J. Cancer127, 988–1013 (2022). - PMC - PubMed
    1. Lugassy C, Kleinman HK, Vermeulen PB, Barnhill RL. Angiotropism, pericytic mimicry and extravascular migratory metastasis: an embryogenesis-derived program of tumor spread. Angiogenesis. 2020;23:27–41. doi: 10.1007/s10456-019-09695-9. - DOI - PubMed
    1. van Dam P-J, et al. International consensus guidelines for scoring the histopathological growth patterns of liver metastasis. Br. J. Cancer. 2017;117:1427–1441. doi: 10.1038/bjc.2017.334. - DOI - PMC - PubMed
    1. Barnhill R, et al. Replacement and desmoplastic histopathological growth patterns in cutaneous melanoma liver metastases: frequency, characteristics, and robust prognostic value. J. Pathol. Clin. Res. 2020;6:195–206. doi: 10.1002/cjp2.161. - DOI - PMC - PubMed

Publication types