. 2023 Aug 18;13(1):13442.
doi: 10.1038/s41598-023-39700-7.

Normative brain mapping using scalp EEG and potential clinical application

Affiliations

Normative brain mapping using scalp EEG and potential clinical application

Vytene Janiukstyte et al. Sci Rep. .

Abstract

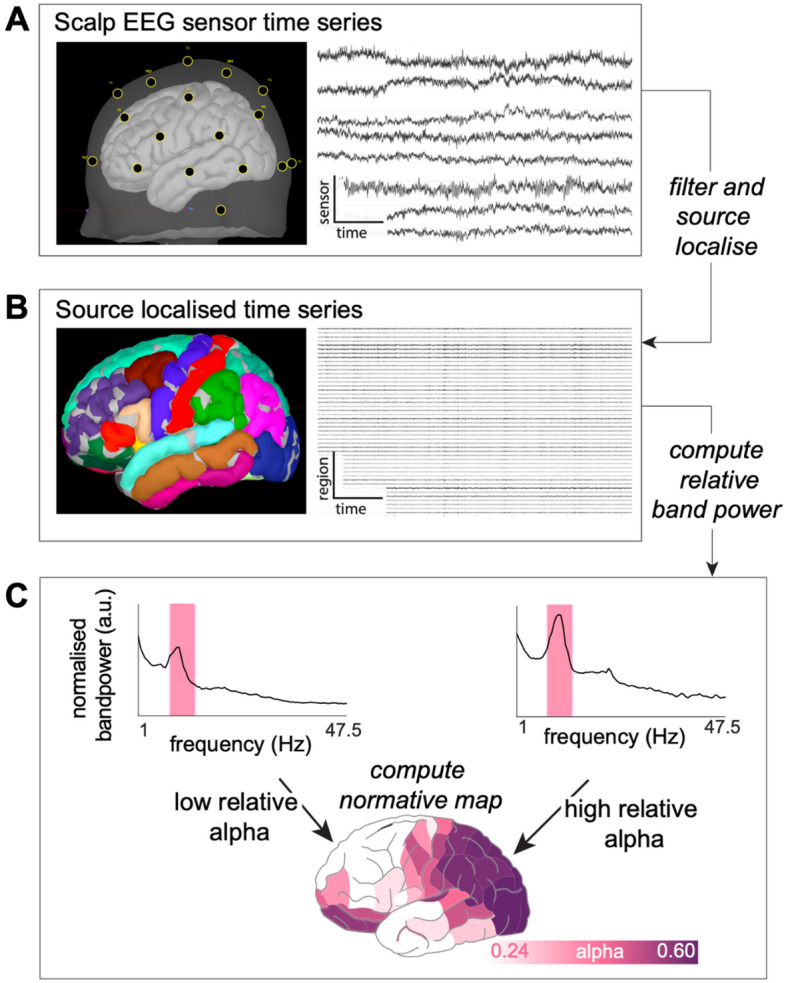
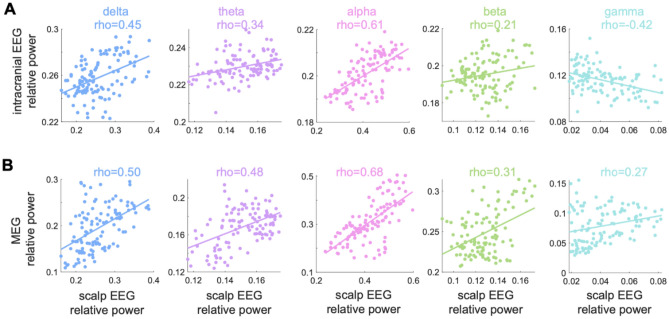
A normative electrographic activity map could be a powerful resource to understand normal brain function and identify abnormal activity. Here, we present a normative brain map using scalp EEG in terms of relative band power. In this exploratory study we investigate its temporal stability, its similarity to other imaging modalities, and explore a potential clinical application. We constructed scalp EEG normative maps of brain dynamics from 17 healthy controls using source-localised resting-state scalp recordings. We then correlated these maps with those acquired from MEG and intracranial EEG to investigate their similarity. Lastly, we use the normative maps to lateralise abnormal regions in epilepsy. Spatial patterns of band powers were broadly consistent with previous literature and stable across recordings. Scalp EEG normative maps were most similar to other modalities in the alpha band, and relatively similar across most bands. Towards a clinical application in epilepsy, we found abnormal temporal regions ipsilateral to the epileptogenic hemisphere. Scalp EEG relative band power normative maps are spatially stable across time, in keeping with MEG and intracranial EEG results. Normative mapping is feasible and may be potentially clinically useful in epilepsy. Future studies with larger sample sizes and high-density EEG are now required for validation.


Conflict of interest statement

The authors declare no competing interests.

Figures

Figure 1
Figure 1
Scalp EEG processing pipeline. (A) Digitised electrode locations are projected on a cortical surface for visual verification and raw time series from 8 selected electrodes (n.b. 8 are shown for visualisation only, all are used for processing). (B) Data is filtered and source localised MRI in ICBM152 standard space, followed by parcellation. The resulting time series in source space are imported into MATLAB to extract a 60-s epoch. Source space recordings are computed to allow comparison to other modalities (iEEG, MEG). (C) The absolute power is normalised to compute relative power of five frequency bands across different cortical regions.
Figure 2
Figure 2
Normative band power variation across regions and time. (A) Relative ROI band power averaged across the healthy subjects for the five individual frequency bands (from top to bottom: delta, theta, alpha, beta, gamma). The power density colour scales are normalised to each band’s power range. (B) Left vs. right mean relative ROI band power correlation, across the five bands [same colour scheme as (A)], (rho = 0.98). Each data point represents a ROI mean relative band power. Each region is therefore represented five times with different colours representing different frequencies. The identity line is plotted in black. (C, D) Reproducibility analysis. ROI band power calculated for two, 30-s, non-overlapping epochs: mean relative band power (C) (rho = 0.997), and standard deviation (D) (rho = 0.97).
Figure 3
Figure 3
Correlating scalp EEG to intracranial and MEG normative maps. Illustrating the similarity of the scalp EEG normative map with (A) intracranial EEG and (B) MEG normative maps across five individual band powers. The relative band powers are more positively correlated with scalp and MEG than scalp and intracranial across all frequency bands. Mean relative gamma band power is negatively correlated between intracranial and scalp maps (rho =  − 0.42). Note that, the x and y axes are on different scales.
Figure 4
Figure 4
Applying scalp EEG normative map to lateralise abnormality in temporal regions in individual patients. (A) Paired T-test effect size of ipsilateral versus contralateral absolute z-score illustrating abnormality gradient across 13 bilateral temporal regions. (B) Entorhinal cortex data from panel a, shown as an absolute z-score in the ipsilateral and contralateral hemispheres of the 22 patients with a greater abnormality in the ipsilateral hemisphere (t = 2.6). (C) Visualisation of max absolute z-score distribution in an example temporal epilepsy patient with score intensity indicating abnormality strength. The anterior temporal lobe is outlined by the blue contour, including entorhinal cortex (blue arrow), shows greater ipsilateral abnormality.

Update of

References

    1. Bonanni L, Thomas A, Tiraboschi P, Perfetti B, Varanese S, Onofrj M. EEG comparisons in early Alzheimer's disease, dementia with Lewy bodies and Parkinson's disease with dementia patients with a 2-year follow-up. Brain. 2008;131(Pt 3):690–705. doi: 10.1093/brain/awm322. - DOI - PubMed
    1. Bosch-Bayard J, Aubert-Vazquez E, Brown ST, Rogers C, Kiar G, Glatard T, Scaria L, Galan-Garcia L, Bringas-Vega ML, Virues-Alba T, Taheri A. A quantitative EEG toolbox for the MNI neuroinformatics ecosystem: Normative SPM of EEG source spectra. Front. Neuroinf. 2020;14:33. doi: 10.3389/fninf.2020.00033. - DOI - PMC - PubMed
    1. Bosch-Bayard J, Galan L, Aubert Vazquez E, Virues Alba T, Valdes-Sosa PA. Resting state healthy EEG: The first wave of the cuban normative database. Front. Neurosci. 2020;14:555119. doi: 10.3389/fnins.2020.555119. - DOI - PMC - PubMed
    1. Czigler B, Csikos D, Hidasi Z, Anna Gaal Z, Csibri E, Kiss E, Salacz P, Molnar M. Quantitative EEG in early Alzheimer's disease patients - power spectrum and complexity features. Int J Psychophysiol. 2008;68(1):75–80. doi: 10.1016/j.ijpsycho.2007.11.002. - DOI - PubMed
    1. Owen TW, Schroeder GM, Hall GR, McEvoy A, Miserocchi A, de Tisi J, Duncan JS, Rugg-Gunn F, Wang Y, Taylor PN. MEG abnormalities highlight mechanisms of surgical failure in neocortical epilepsy. Epilepsia. 2022;64(3):692–704. doi: 10.1111/epi.17503. - DOI - PMC - PubMed

Publication types