. 2023 Aug 18;14(1):5031.
doi: 10.1038/s41467-023-40680-5.

Mitochondria are secreted in extracellular vesicles when lysosomal function is impaired

Affiliations

Mitochondria are secreted in extracellular vesicles when lysosomal function is impaired

Wenjing Liang et al. Nat Commun. .

Abstract

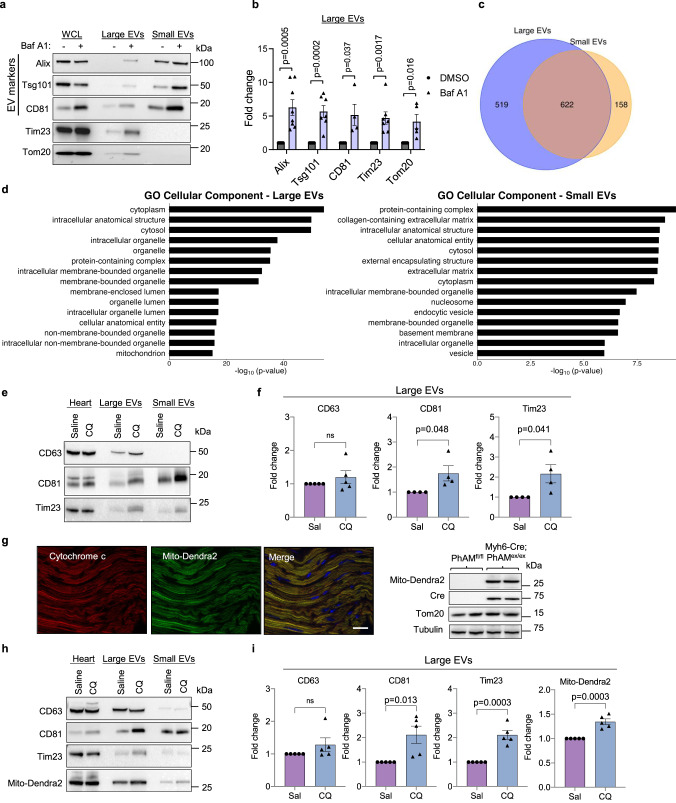
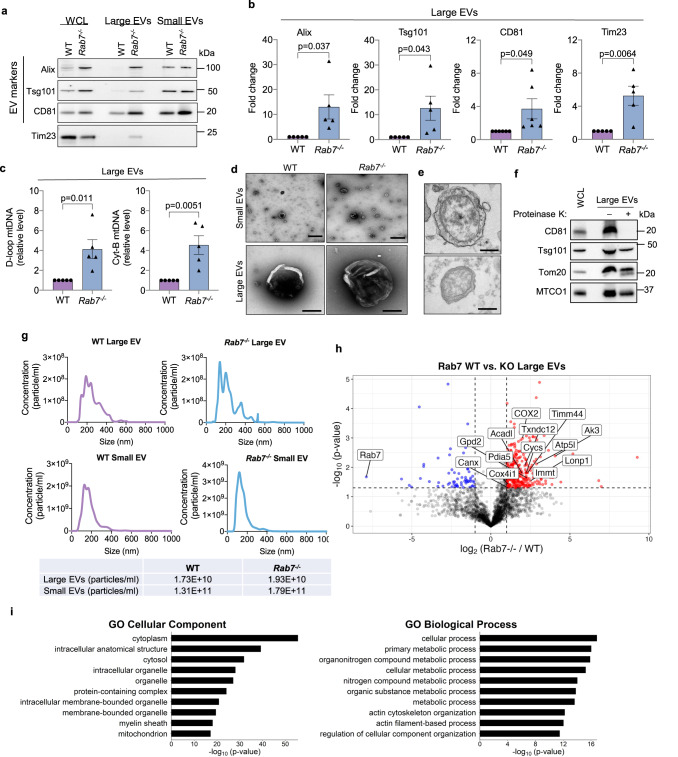
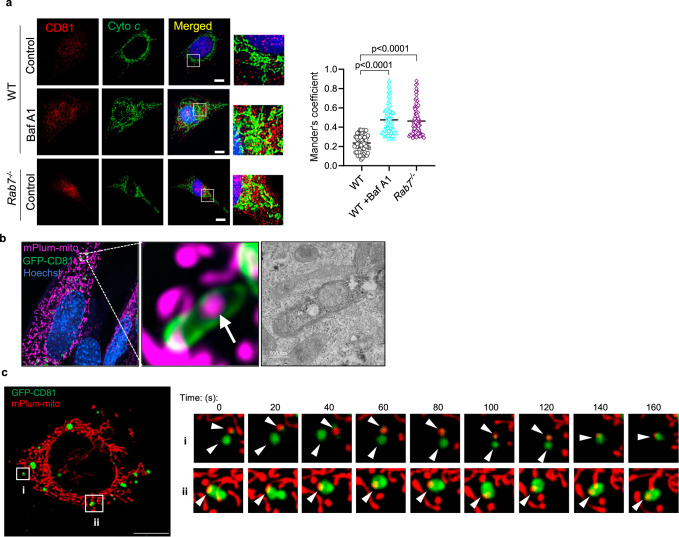
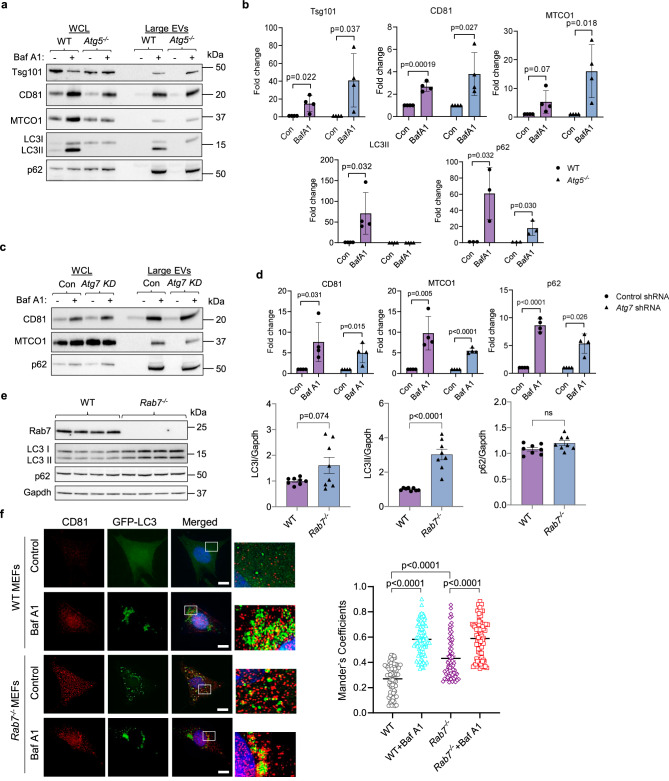
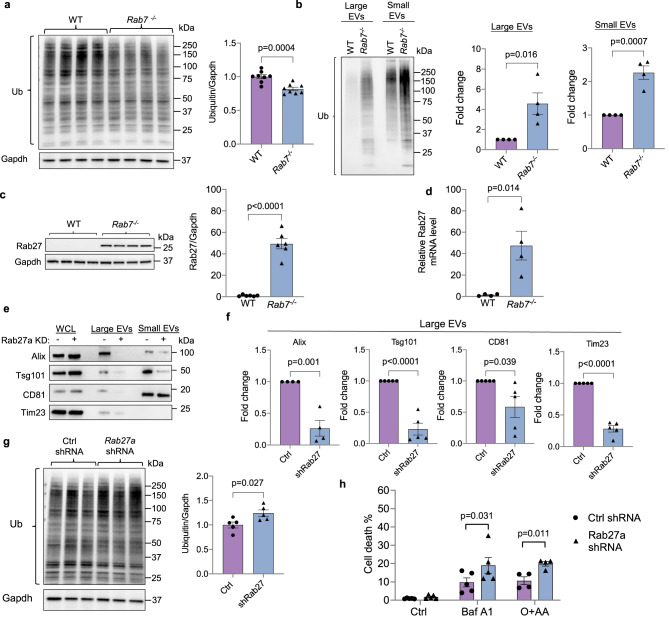
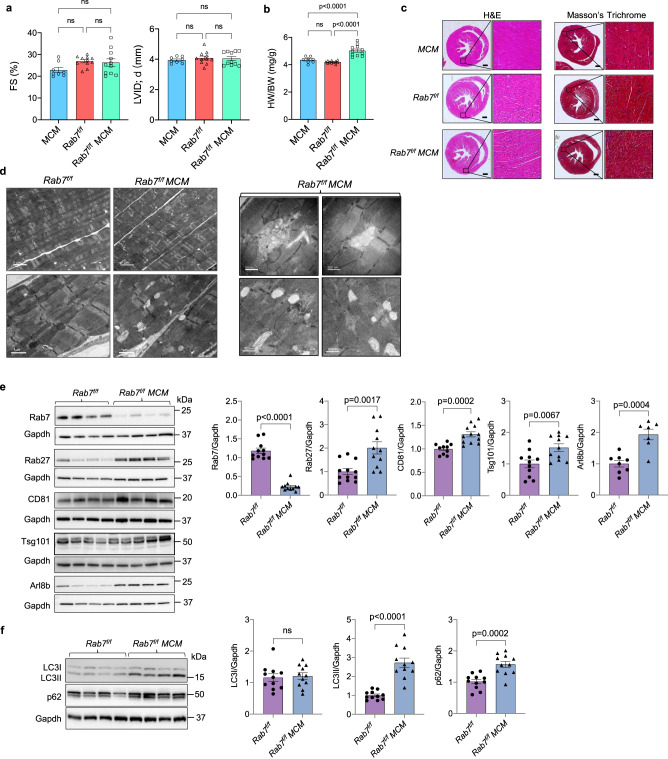
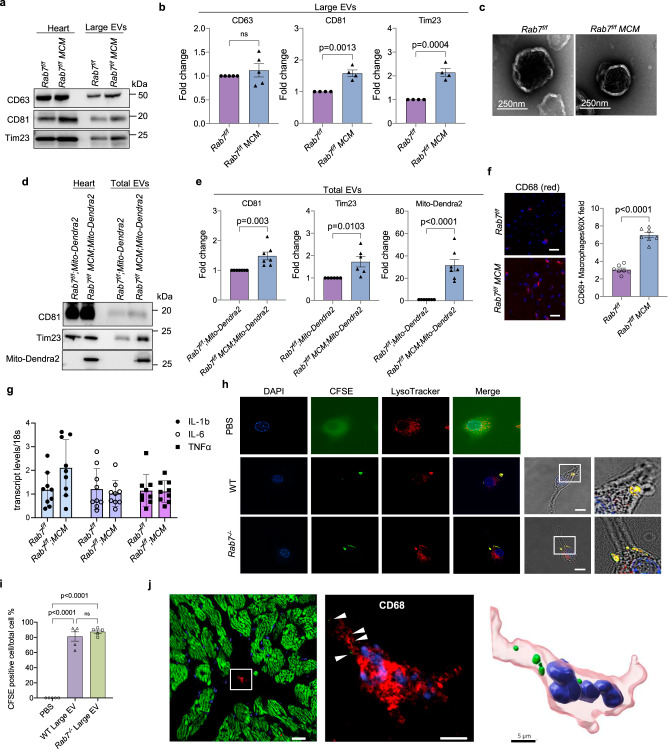
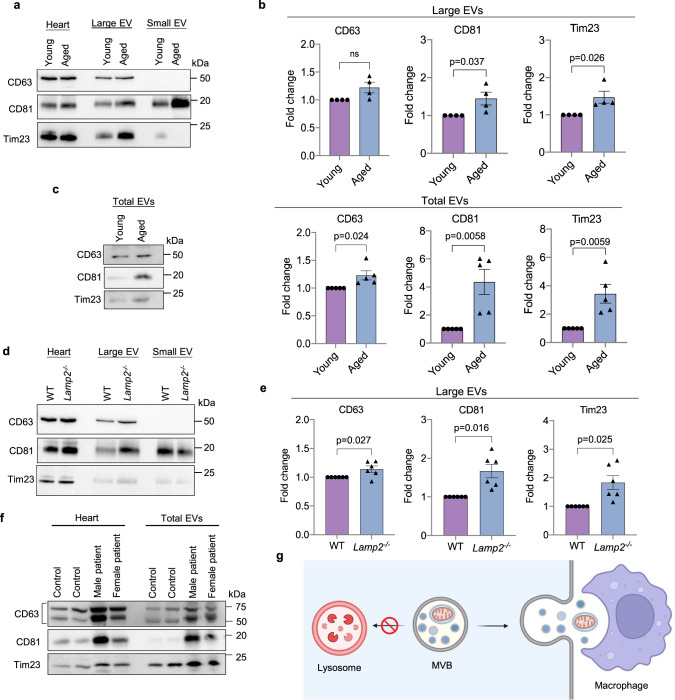
Mitochondrial quality control is critical for cardiac homeostasis as these organelles are responsible for generating most of the energy needed to sustain contraction. Dysfunctional mitochondria are normally degraded via intracellular degradation pathways that converge on the lysosome. Here, we identified an alternative mechanism to eliminate mitochondria when lysosomal function is compromised. We show that lysosomal inhibition leads to increased secretion of mitochondria in large extracellular vesicles (EVs). The EVs are produced in multivesicular bodies, and their release is independent of autophagy. Deletion of the small GTPase Rab7 in cells or adult mouse heart leads to increased secretion of EVs containing ubiquitinated cargos, including intact mitochondria. The secreted EVs are captured by macrophages without activating inflammation. Hearts from aged mice or Danon disease patients have increased levels of secreted EVs containing mitochondria indicating activation of vesicular release during cardiac pathophysiology. Overall, these findings establish that mitochondria are eliminated in large EVs through the endosomal pathway when lysosomal degradation is inhibited.


Conflict of interest statement

The authors declare no competing interests.

Figures

Fig. 1
Fig. 1. Inhibiting lysosomal acidification leads to increased release of large and small extracellular vesicles (EVs) from cells and hearts.
a Representative Western blots of whole cell lysate (WCL) and extracellular vesicle fractions for EV marker proteins Alix, Tsg101, CD81 and the mitochondrial proteins Tim23 and Tom20. The EVs were obtained by differential centrifugation of conditioned media from mouse embryonic fibroblasts collected over 48 h after treatment with vehicle or Bafilomycin (Baf A1, 5 nM). b Quantification of proteins in large EVs (Alix n = 8; Tsg101, Tim23 n = 7; Tom20 n = 5; CD81 n = 4 biologically independent experiments). c Venn diagram showing overlap of proteins detected in large and small EVs. d Gene ontology (GO) analysis of the unique 519 proteins identified in large EV fractions with the top 15 terms for cellular component plotted according to –log10False Discovery Rate (FDR). e Representative Western blot analysis of EV proteins CD63, CD81 and the mitochondrial protein Tim23 in heart lysates and EV fractions isolated from heart tissue. f Quantification of proteins in large EVs fraction (CD63 n = 5; DC81, Tim23 n = 4 biologically independent experiments). g Photo-activatable mitochondria (PhAMfloxed) mice were crossed with Myh6-Cre transgenic mice to generate a mouse line (PhAMexcised) with cardiac specific expression of Mito-Dendra2. Expression of Mito-Dendra2 (green) and Cre was confirmed by imaging of frozen heart sections (representative of n = 2 biologically independent samples) and by Western blotting of heart lysates (n = 3 biologically independent samples). Heart sections were stained with anti-Cytochrome c (red) to label mitochondria. Scale bar = 20 μm. h Representative Western blot analysis of CD63, CD81, Tim23, and Mito-Dendra2 in heart lysates and EV fractions isolated from heart tissue. i Quantification of proteins in large EVs (n = 5 biologically independent experiments). Data are mean ± SEM. ns = not significant. P values shown are by two-sided Student’s t-test. Source data are provided as a Source Data file.
Fig. 2
Fig. 2. Rab7-deficient cells have increased EV secretion at baseline.
a Representative Western blots of Alix, Tsg101, CD81, and Tim23 in total cell lysates and EV preparations from WT and Rab7−/ MEFs. b Quantification of proteins in large EV fractions (Alix, Tsg101, Tim23 n = 5; CD81 n = 6 biologically independent experiments). c Mitochondrial DNA (mtDNA) content in large EVs preparations (n = 5 biologically independent experiments). d Small and large EVs isolated from conditional media were visualized by negative stain electron microscopy (scale bars = 500 nm) (n = 3 biologically independent samples). e Representative electron microscopy images of large EVs from Rab7−/− MEFs containing mitochondria (scale bars = 500 nm) (n = 2 biologically independent samples). f Representative Western blots of proteins in large EV fraction from Rab7−/− MEFs after Proteinase K digestion (n = 4). g Representative histograms of a Nanosight nanoparticle tracking analysis of large and small EVs secreted by wild type (WT) and Rab7−/− MEFs. h Volcano plot of proteins identified in large EV fractions from WT and Rab7−/− MEFs. Proteins are plotted according to their –log10P values and log2 fold enrichment (WT/Rab7−/−). Red dots represents proteins that are significantly enriched in Rab7−/− EVs by two-sided Student’s t-test, while blue dots represents proteins that are decreased. i Gene ontology (GO) enrichment analysis of EV proteins isolated from Rab7−/− MEFs relative to wild type MEFs with top terms for cellular component and biological process plotted according to—log10False Discovery Rate (FDR). Data are mean ± SEM. In (b), (c), and (i), statistical analysis and P values are by two-sided Student’s t-tests. Source data are provided as a Source Data file.
Fig. 3
Fig. 3. Sequestration of mitochondria in CD81-positive vesicles.
a Co-localization between endogenous CD81 (red) and Cytochrome c (green) in WT +/− Baf A1 (50 nM for 24 h) and Rab7−/− MEFs. Scale bar = 20 μm. Mander’s coefficient (n = 3 independent experiments with a total of 76 cells per condition). b Correlative light and electron microscopy of Rab7−/− MEFs transfected with mPlum-mito3 and CD81-GFP (representative images are from n = 2). Fluorescent image and electron micrograph of a CD81-positive vesicle (green) containing a mitochondrion (magenta) are shown enlarged. c Time-lapse images from live cell imaging of Rab7−/− MEFs overexpressing CD81-GFP (green) and mPlum-mito3 (red) (See Supplementary Movie 1). Arrowheads mark vesicles and mitochondria. Data are mean ± SEM. P values shown are by ANOVA with Tukey’s post-hoc testing. Source data are provided as a Source Data file.
Fig. 4
Fig. 4. Secretion of large EVs is independent of the autophagy pathway.
a Representative Western blots of Alix, Tsg101, CD81, MTCO1, LC3 and p62 protein levels in total cell lysates and EV preparations from WT and Atg5−/ MEFs. The EVs were obtained by differential centrifugation of conditioned media collected over 48 h after treatment with vehicle or Bafilomycin A1 (Baf A1, 5 nM). EVs from 1 × 107 cells were loaded. b. Quantification of proteins in large EVs (n = 4 biologically independent experiments). c Representative Western blot analysis of CD81 and MTCO1 protein levels in whole cell lysates (WCL) and EV fractions from MEFs (Control shRNA vs Atg7 shRNA) after treatment with vehicle or Bafilomycin A1 (Baf A1, 5 nM). d Quantification of proteins in large EV fractions (n = 4 biologically independent experiments). e Representative Western blots and quantification of LC3I, LC3II and p62 protein levels in WT and Rab7−/− MEFs (n = 8 biologically independent experiments). f Representative images of co-localization between CD81 (red) and GFP-LC3 (green) in WT and Rab7−/ MEFs +/− Baf A1 (50 nM for 24 h). Mander’s correlation coefficient (n = 3 independent experiments with a total of 71 WT and Rab7−/ cells scored for controls and 74 cells scored for WT and Rab7−/− treated with Baf A1). Scale bar = 20 μm. Data are mean ± SEM. ns = not significant. P values shown are by two-sided Student’s t-test (b, d, e) or ANOVA with Tukey’s post-hoc testing (f). Source data are provided as a Source Data file.
Fig. 5
Fig. 5. Rab27a knockdown in Rab7-deficient cells abrogates secretion of large EVs containing mitochondria and increases susceptibility to stress.
a Representative Western blot and quantification of ubiquitinated proteins in WT and Rab7−/− MEFs at baseline (n = 8 biologically independent experiments). b Representative Western blot and quantification of total ubiquitin levels in small and large EVs secreted by WT and Rab7−/− MEFs at baseline (n = 4 biologically independent experiments). c Representative Western blot and quantification of Rab27a protein levels in WT and Rab7−/− MEFs (n = 6 biologically independent experiments). d Rab27a transcript levels in WT and Rab7−/− MEFs (n = 4 biologically independent experiments). e Western blot of Alix, Tsg101, CD81, and Tim23 protein levels in cell lysates and EV preparations from Rab7−/− MEFs infected with control or Rab27a shRNA. f Quantification of proteins in large EVs (Alix n = 4; Tsg101, CD81, Tim23 n = 5 biologically independent experiments). g Western blot and quantification of ubiquitinated proteins in Rab7−/− MEFs after Rab27a knockdown (n = 5 biologically independent experiments). h Analysis of cell death using Yo-Pro1 in Rab7−/− MEFs infected with control or Rab27a shRNA. Cells were treated with Baf A1 (50 nM) for 24 h or O + AA (10 μM + 10 μM) for 24 h (Ctrl, Baf A1 n = 5, O + AA n = 4 biologically independent experiments). Data are mean ± SEM. n.s. not significant. P values shown are by two-sided Student’s t-test. Source data are provided as a Source Data file.
Fig. 6
Fig. 6. Characterization of mice with cardiac specific deletion of Rab7.
a Echocardiographic analysis of ventricular function and structure at 28 days post-tamoxifen treatment. Percent (%) fractional shortening (FS) and left ventricular internal dimension in end diastole (LVID;d). MCM (n = 8 biologically independent animals), Rab7f/f (n = 11 biologically independent animals), Rab7f/f MCM (n = 11 biologically independent animals). b Heart weight to body weight ratio (HW/BW). MCM (n = 8), Rab7f/f (n = 11 biologically independent animals), Rab7f/f MCM (n = 11 biologically independent animals). c Hematoxylin and eosin (H&E) and Masson’s Trichrome staining of heart sections. Scale bar = 0.5 mm. d Ultrastructural analysis by transmission electron microscopy at D28 (representative of n = 2 biologically independent samples). e Representative Western blots and quantification of endosomal proteins (Rab7/Gapdh: Rab7f/f (n = 11 biologically independent animals) Rab7f/f MCM (n = 11 biologically independent animals); Rab27/Gapdh: Rab7f/f (n = 12 biologically independent animals), Rab7f/f MCM (n = 11 biologically independent animals); CD81/Gapdh: Rab7f/f (n = 10 biologically independent animals), Rab7f/f MCM (n = 12); Tsg101/Gapdh: Rab7f/f (n = 11 biologically independent animals), Rab7f/f MCM (n = 11 biologically independent animals); Arl8b/Gapdh: Rab7f/f (n = 8 biologically independent animals), Rab7f/f MCM (n = 7 biologically independent animals)). f Representative Western blots and quantification of autophagy proteins (n = 11 biologically independent animals). Data are mean ± SEM. ns = not significant. P values shown are by ANOVA with Tukey’s post-hoc testing (a) or two-sided Student’s t-test (e, f). Source data are provided as a Source Data file.
Fig. 7
Fig. 7. Enhanced secretion of large EVs containing mitochondria in Rab7-deficient hearts.
a Representative Western blots of CD63, CD81 and Tim23 in whole heart lysates and large EV fractions from Rab7f/f and Rab7f/f MCM heart tissue. b Quantification of protein levels in large EV fractions (CD63: Rab7f/f (n = 5 biologically independent animals) Rab7f/f MCM (n = 5 biologically independent animals); CD81: Rab7f/f (n = 4 biologically independent animals), Rab7f/f MCM (n = 4 biologically independent animals); Tim23: Rab7f/f (n = 4 biologically independent animals), Rab7f/f MCM (n = 4 biologically independent animals)). c Negative stain electron microscopy of large EVs isolated from Rab7f/f and Rab7f/f MCM heart tissue (representative of n = 3 biologically independent animals). d Representative Western blots of CD81, Tim23, and Mito-Dendra2 protein levels in whole heart lysates and extracellular vesicle fractions from Rab7f/f;Mito-Dendra2 and Rab7f/fMCM;Mito-Dendra2 heart tissue. Large and small (total) EVs were isolated from hearts using immunoaffinity capture method. e Quantification of protein levels in the EV fractions (CD81, MitoDendra2: Rab7f/f;Mito-Dendra2 (n = 7 biologically independent animals), Rab7f/fMCM;Mito-Dendra2 (n = 7 biologically independent animals); Tim23: Rab7f/f;Mito-Dendra2 (n = 6 biologically independent animals), Rab7f/fMCM;Mito-Dendra2 (n = 6 biologically independent animals)). f Immunostaining and quantification of CD68-positive (red) cells in Rab7f/f and Rab7f/f MCM hearts (n = 7 biologically independent animals), Scale bar = 20 μm. g qPCR analysis for inflammatory markers in Rab7f/f and Rab7f/f MCM hearts (n = 9 biologically independent animals). h Assessment of large EV uptake by RAW 264.7 macrophages. Representative images of cells after incubation (24 h) with CFSE-labelled EVs (green). Blue (nuclei) and red (Lysotracker Red). Scale bar = 10 μm. i Quantification of CFSE-labeled EV uptake by cells (n = 5, a minimum of 100 cells were scored in each independent experiment). j Frozen heart section from Rab7f/f MCM; Mito-Dendra2 mice shows co-localization between Mito-Dendra2 (green) and a CD68-positive macrophage (red) (white arrow heads) (representative of n = 6 biologically independent samples). 3D reconstruction from confocal image illustrates the presence of Mito-Dendra2-positive mitochondria (green) from myocytes inside the macrophage (red). Scale bars = 10 and 5 μm. Data are mean ± SEM. ns = not significant. P values shown are by two-sided Student’s t-test (b, e, f, g) or ANOVA with Tukey’s post-hoc testing (i). Source data are provided as a Source Data file.
Fig. 8
Fig. 8. Enhanced secretion of large EVs containing mitochondria in aged and Lamp2-deficient hearts.
a Representative Western blots of CD63, CD81, and Tim23 in whole heart lysates and cardiac tissue EVs prepared from young (4 month) and aged (24 month) mice using differential centrifugation. b Quantification of proteins in large EV fractions (n = 4 biologically independent animals). c Representative Western blots and protein quantification of total (large and small) EVs in hearts using immunoaffinity capture (n = 5 biologically independent animals). d Representative Western blots of CD63, CD81 and Tim23 in whole heart lysates and cardiac tissue EVs prepared from WT and Lamp2−/− mice using differential centrifugation. e Quantification of proteins in large EV fractions (n = 6 biologically independent animals). f Western blot of heart lysates and cardiac tissue EVs prepared from control and Danon Disease patients (male and female). Data obtained from four independent donors. g Overview of EV secretion in cells (Created with BioRender.com). Data are mean ± SEM. ns = not significant. P values shown are by two-sided Student’s t-test. Source data are provided as a Source Data file.

References

    1. Bock FJ, Tait SWG. Mitochondria as multifaceted regulators of cell death. Nat. Rev. Mol. Cell Biol. 2020;21:85–100. - PubMed
    1. Gustafsson AB, Dorn GW., 2nd Evolving and expanding the roles of mitophagy as a homeostatic and pathogenic process. Physiol. Rev. 2019;99:853–892. - PMC - PubMed
    1. Hamacher-Brady A, et al. Response to myocardial ischemia/reperfusion injury involves Bnip3 and autophagy. Cell Death Differ. 2007;14:146–157. - PubMed
    1. Song M, Mihara K, Chen Y, Scorrano L, Dorn GW., 2nd Mitochondrial fission and fusion factors reciprocally orchestrate mitophagic culling in mouse hearts and cultured fibroblasts. Cell Metab. 2015;21:273–285. - PMC - PubMed
    1. Ikeda Y, et al. Endogenous Drp1 mediates mitochondrial autophagy and protects the heart against energy stress. Circ. Res. 2015;116:264–278. - PubMed

Publication types