. 2023 Aug 18;3(1):80.
doi: 10.1038/s43705-023-00291-z.

Bacterial and archaeal community distributions and cosmopolitanism across physicochemically diverse hot springs

Affiliations

Bacterial and archaeal community distributions and cosmopolitanism across physicochemically diverse hot springs

Chanenath Sriaporn et al. ISME Commun. .

Abstract

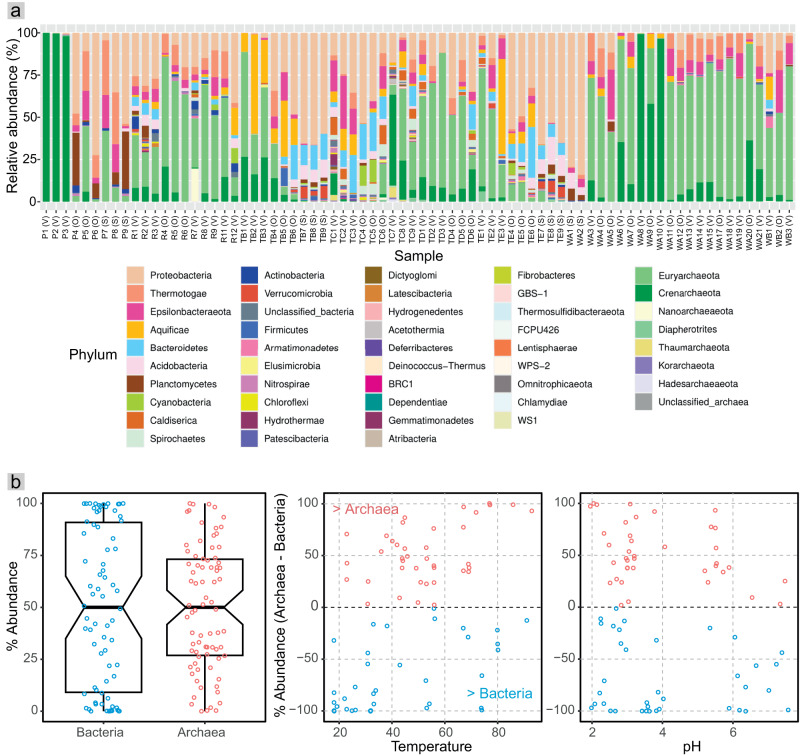
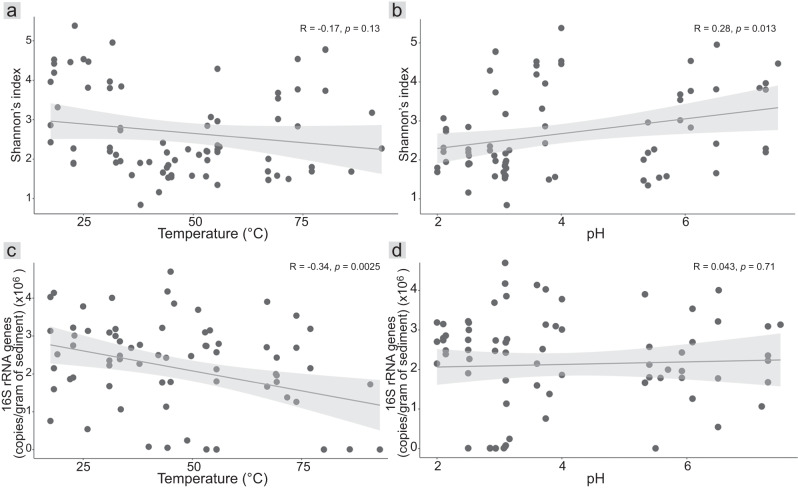
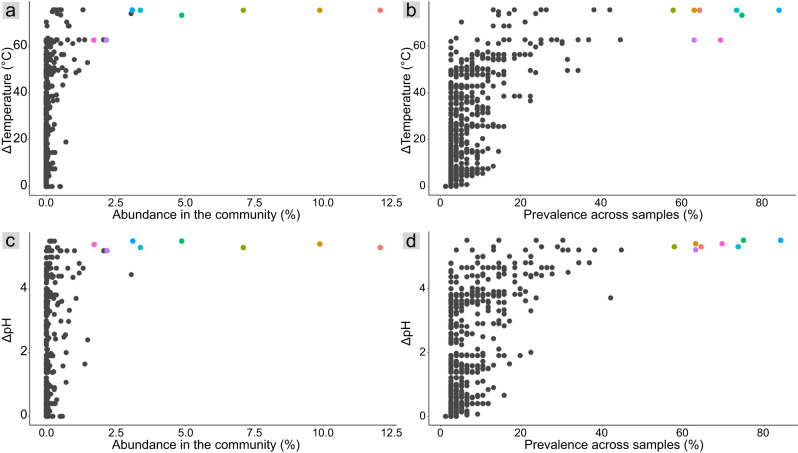
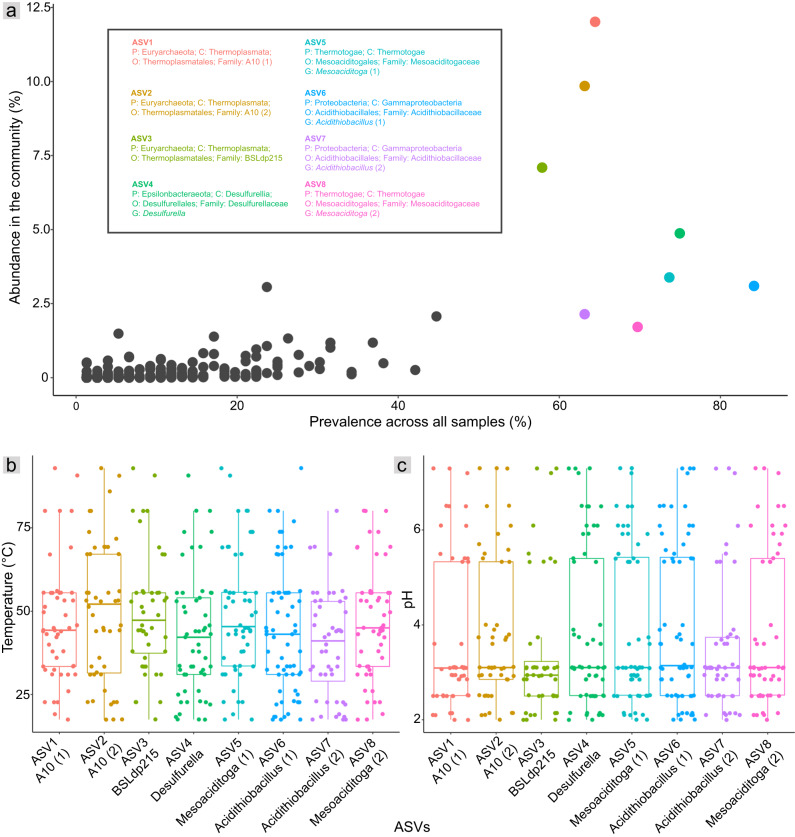
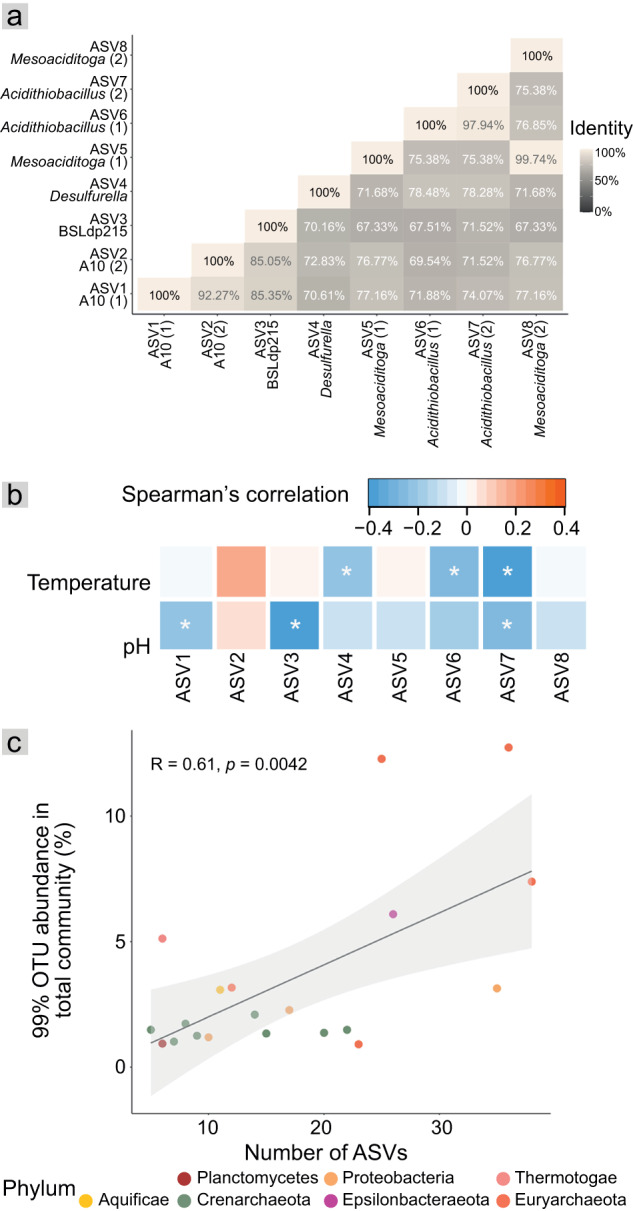
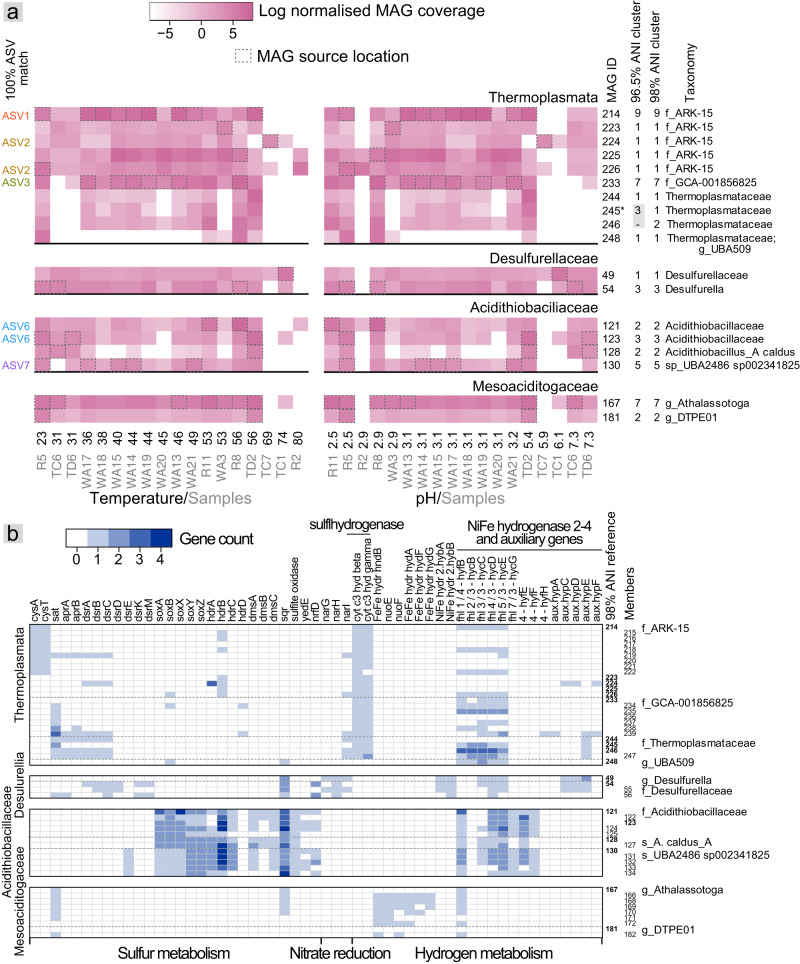
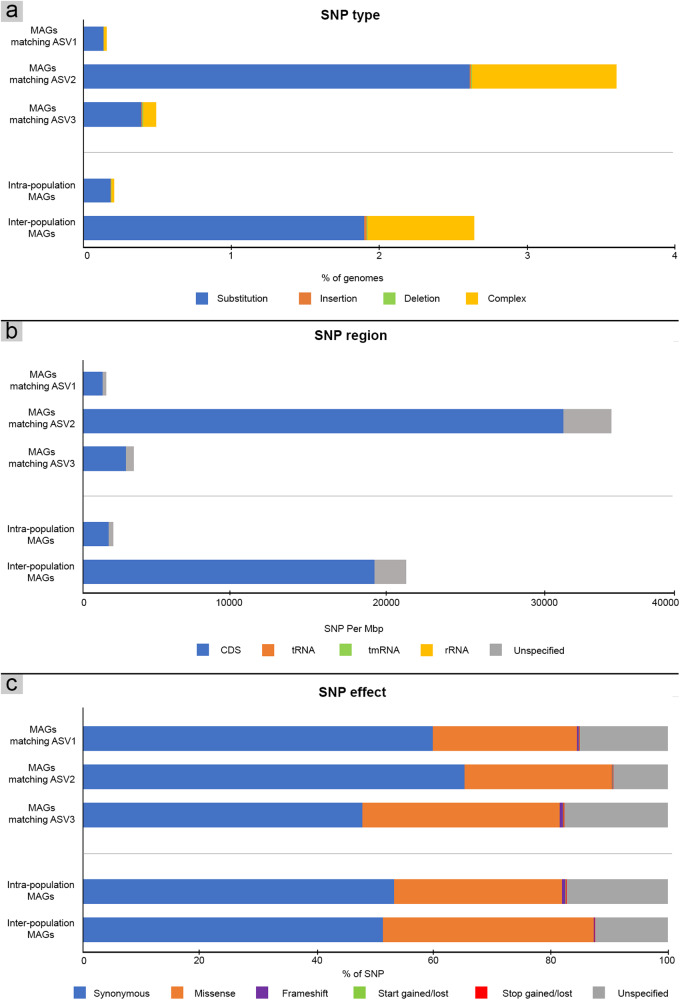
Terrestrial hot springs harbor diverse microbial communities whose compositions are shaped by the wide-ranging physico-chemistries of individual springs. The effect of enormous physico-chemical differences on bacterial and archaeal distributions and population structures is little understood. We therefore analysed the prevalence and relative abundance of bacteria and archaea in the sediments (n = 76) of hot spring features, in the Taupō Volcanic Zone (New Zealand), spanning large differences in major anion water chemistry, pH (2.0-7.5), and temperature (17.5-92.9 °C). Community composition, based on 16S rRNA amplicon sequence variants (ASVs) was strongly influenced by both temperature and pH. However, certain lineages characterized diverse hot springs. At the domain level, bacteria and archaea shared broadly equivalent community abundances across physico-chemically diverse springs, despite slightly lower bacteria-to-archaea ratios and microbial 16S rRNA gene concentrations at higher temperatures. Communities were almost exclusively dominated by Proteobacteria, Euryarchaeota or Crenarchaeota. Eight archaeal and bacterial ASVs from Thermoplasmatales, Desulfurellaceae, Mesoaciditogaceae and Acidithiobacillaceae were unusually prevalent (present in 57.9-84.2% of samples) and abundant (1.7-12.0% sample relative abundance), and together comprised 44% of overall community abundance. Metagenomic analyses generated multiple populations associated with dominant ASVs, and showed characteristic traits of each lineage for sulfur, nitrogen and hydrogen metabolism. Differences in metabolic gene composition and genome-specific metabolism delineated populations from relatives. Genome coverage calculations showed that populations associated with each lineage were distributed across a physicochemically broad range of hot springs. Results imply that certain bacterial and archaeal lineages harbor different population structures and metabolic potentials for colonizing diverse hot spring environments.


Conflict of interest statement

The authors declare no competing interests.

Figures

Fig. 1
Fig. 1. Distribution and relative abundances of bacteria and archaea in hot spring sediments of the Taupō Volcanic Zone (TVZ), New Zealand.
a Relative abundance of phyla based on 16S rRNA gene amplicons for prokaryotic communities associated with hot spring sediments across all samples. Each sample contained between 24 and 2,046 ASVs (or 16 to 274 after rarefying to the minimum number of sequences in a sample, 673, Table S1). Symbols in parentheses after the sample names refer to the local hot spring feature sampled: V = Vent, O = Outflow, and S = Geothermally-influenced stream. b Plots showing the relative abundances of bacteria and archaea across all samples (left), and their percent difference across hot springs with varying temperatures (middle) and pHs (right). Percent difference was calculated as archaeal abundance per sample - bacterial abundance per sample. The gap between pH 4.1 and 5.3 reflects the lack of hot springs with these pHs in the TVZ.
Fig. 2
Fig. 2. Hot spring community alpha diversity and 16S rRNA gene copy number relationships with physicochemistry.
Scatter plots showing (a) a non-significant correlation between Shannon’s indices and temperature (°C) (R = −0.17, p = 0.13); (b) a significantly positive correlation between Shannon’s indices and pH (R = 0.28, p = 0.013); (c) a significantly negative correlation between 16S rRNA gene copies and temperature (°C) (R = −0.34, p = 0.0025); (d) a non-significant correlation between 16S rRNA gene copies and pH (R = 0.043, p = 0.71). Correlations and statistical significances of correlations were determined using Pearson’s correlation coefficients and t-distribution tables (df = n–1), respectively. Lines represent linear regressions and shaded areas represent 95% confidence intervals.
Fig. 3
Fig. 3. ASV distributions across temperature and pH ranges.
a, b ASV relative abundance (summed across samples) and prevalence versus temperature range. c, d ASV relative abundance and prevalence versus pH range. Colored dots represent eight ASVs that are highly abundant (>1% abundance in the community) and prevalent (>50% of samples).
Fig. 4
Fig. 4. Plots showing ASV abundances and prevalence across temperature and pH ranges.
a Scatter plot illustrating the overall relative abundance (summed across samples) and prevalence of all ASVs. Colored dots represent eight ASVs that are highly abundant (>1% abundance in the community) and prevalent (>50% of samples). b, c Temperature and pH ranges where these eight prevalent ASVs were detected. Boxes, internal horizontal lines and whiskers represent upper/lower quartiles, median and minimum/maximum ranges, respectively. The gap between pH 4.1 and 5.3 reflects the lack of hot springs with these pHs in the TVZ, as shown in Fig. 1b.
Fig. 5
Fig. 5. Comparisons of dominant and prevalent variants.
a Pairwise 16S rRNA gene sequence identities (%) among the eight abundant and prevalent ASVs. b Heatmap of Spearman’s correlations between ASV relative abundance and hot spring temperature or pH. Asterisks indicate significant correlations (p < 0.05). c Plot comparing ASV numbers and OTU relative abundance. The linear trend line shows a significantly positive correlation between the top 20 most abundant OTUs in the total community and number of ASVs observed per OTU. Test = Pearson’s correlation coefficients. Shaded areas represent 95% confidence intervals.
Fig. 6
Fig. 6. Plots showing the distribution and S/N/H-related metabolic potential of MAGs affiliated with ASV-identified cosmopolitan lineages (Thermoplasmata, Desulfurellia, Acidithiobacillales and Mesoaciditogaceae).
a Heat maps showing the log relative genome abundance per site based on read mapping. Abundances were normalized to library size, and are included where the summed length of mapped reads equated to least 5% of each genome (72 Kbp to 6 Gbp). Samples are ordered by temperature (left plot), or pH (right plot), and sample conditions and locations are indicated below the x-axes. White dashed boxes indicate samples from which a genome was recovered. MAGs shown are representatives following dereplication at 98% ANI, and MAG cluster sizes based on 98% and 95% ANI thresholds are shown on the right, along with GTDB based taxonomy. Asterisks indicate references for ≥95% ANI clusters. Cosmopolitan ASV sequence matches are shown where 100% identical to a MAG-derived 16S rRNA gene sequence. b Heat maps showing gene copy numbers present (maximum = four) per MAG associated with sulfur metabolism (oxidation/reduction), energy-generating nitrogen-cycling processes (only nitrate reduction identified for the MAGs shown), and hydrogen metabolism (production/consumption). hydr hydrogenase, cyt cytochrome, aux auxiliary, fhl formate hydrogenlyase.
Fig. 7
Fig. 7. Single-Nucleotide Polymorphisms (SNPs) of MAGs that yielded 16S rRNA gene sequences 100% matched with ASV1, ASV2, and ASV3 of Thermoplasmatales (from Table S5), and SNP rate of members within populations (>99% identity) and between populations (<99% identity).
a Types of SNP point mutations including substitutions, insertions, and deletions, and complex (i.e., multiple points/combined mutations of substitutions and indels). b Genomic regions where SNPs were detected. SNPs identified as ‘unspecified’ were excluded, specifically 200–700 SNPs for intrapopulation and 100-3,200 SNPs for interpopulation MAGs. c The effects to CDS by SNPs.

References

    1. Lozupone CA, Knight R. Global patterns in bacterial diversity. Proc Natl Acad Sci. 2007;104:11436–40. - PMC - PubMed
    1. Kent AD, Yannarell AC, Rusak JA, Triplett EW, McMahon KD. Synchrony in aquatic microbial community dynamics. ISME J. 2007;1:38–47. - PubMed
    1. Bodvarsson G. Physical characteristics of natural heat resources in Iceland. Joekull. 1961;11:29–38.
    1. Brock TD. Bimodal distribution of pH Values of thermal springs of the world. GSA Bull. 1971;82:1393–4.
    1. Jones B, Renaut RW, Rosen MR. Microbial construction of siliceous stalactites at geysers and hot springs: examples from the Whakarewarewa Geothermal Area, North Island, New Zealand. PALAIOS. 2001;16:73–94.