. 2023 Aug 18;14(1):5022.
doi: 10.1038/s41467-023-40522-4.

iCLOTS: open-source, artificial intelligence-enabled software for analyses of blood cells in microfluidic and microscopy-based assays

Affiliations

iCLOTS: open-source, artificial intelligence-enabled software for analyses of blood cells in microfluidic and microscopy-based assays

Meredith E Fay et al. Nat Commun. .

Abstract

While microscopy-based cellular assays, including microfluidics, have significantly advanced over the last several decades, there has not been concurrent development of widely-accessible techniques to analyze time-dependent microscopy data incorporating phenomena such as fluid flow and dynamic cell adhesion. As such, experimentalists typically rely on error-prone and time-consuming manual analysis, resulting in lost resolution and missed opportunities for innovative metrics. We present a user-adaptable toolkit packaged into the open-source, standalone Interactive Cellular assay Labeled Observation and Tracking Software (iCLOTS). We benchmark cell adhesion, single-cell tracking, velocity profile, and multiscale microfluidic-centric applications with blood samples, the prototypical biofluid specimen. Moreover, machine learning algorithms characterize previously imperceptible data groupings from numerical outputs. Free to download/use, iCLOTS addresses a need for a field stymied by a lack of analytical tools for innovative, physiologically-relevant assays of any design, democratizing use of well-validated algorithms for all end-user biomedical researchers who would benefit from advanced computational methods.


Conflict of interest statement

The authors declare no competing interests.

Figures

Fig. 1
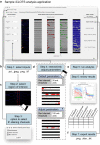
Fig. 1. iCLOTS software enables quantification of microscopy data from a wide range of established hematology assays.
a Versatile computational methods adapt to microscopy images and videomicroscopy of cells and cell suspensions obtained using static, standard microscopy assays as well as flow-based systems including traditional flow chambers, commercially-available microfluidic devices, and custom-made microfluidic devices. b iCLOTS is designed as a post-processing image analysis software such that users can continue to acquire imaging data using the methods they are accustomed to. This makes iCLOTS suitable for analysis of previously collected data or for new assays planned with iCLOTS’ capabilities in mind. c Image processing capabilities are separated into four main applications: cell adhesion applications provide single-cell resolution measures of biological functionality, single cell tracking applications provide single-cell resolution measures of cell dynamics and movement including a specialized assay to quantify cellular mechanical properties, velocity profile applications calculate rheological properties of suspensions under flow, and multiscale microfluidic accumulation applications provide insight into potentially pathologic processes such as thrombosis in blood samples. d Each application facilitates interactive analysis of a specific experimental workflow. From the microscopy imaging data provided by the user, after image processing algorithms are applied, iCLOTS detects events such as individual cells, patterns of cells, or regions of immunostaining signal, which are then labeled with a number/index on the original and processed imaging files. Numerical output metrics dependent on application type, e.g., cell velocity, area, and/or fluorescence intensity, are calculated for each event and generated as tabular data labeled with the associated index. Additionally, all numerical data is automatically graphed in common formats such as histograms or scatter plots to help users quickly parse the high-dimensional results output by iCLOTS. Should the user need assistance with interpretation of these results, numerical data outputs can be used in post-image analysis applied ML-based clustering algorithms, which assign individual data points with cluster labels suitable for additional methods such as Chi-square analysis.
Fig. 2
Fig. 2. All iCLOTS applications follow a common, easy-to-use interactive format.
a Analysis windows are designed to be intuitively followed from left (inputs) to right (outputs), with the image processing steps as applied displayed in the center. Here, the microchannel analysis application from iCLOTS’ suite of multiscale microfluidic accumulation tools is shown with whole blood perfused through an in vitro microvasculature-on-a-chip microfluidic model. b The user uploads the desired number of microscopy images, time course microscopy series, or videomicroscopy files as inputs. These files are then automatically displayed on the screen. c Depending on the application and file type, users are guided through a series of windows facilitating the analyses of their data, such as choosing a region of interest (ROI, shown) or indicating immunofluorescence staining color channels present in a file. iCLOTS applications designed for fluorescence microscopy can accommodate up to three stains in separate channels: here, red indicates CD41+ platelets, green indicates CD45+ white blood cells, and blue indicates the endothelial cell layer. Data in this example is taken at ×100 magnification, scale bars represent 50 μm (left) and 10 μm (right). d Parameters, numerical factors that define how image processing algorithms should be applied, are typically simple, e.g., minimum and maximum cell area, or fluorescence signal threshold, as shown here. All parameters are adjusted interactively from a default value to best match the researcher’s specific dataset. In iCLOTS, pixel intensity values are understood to be arbitrary units. Effects of changing parameters are shown in real time to assist in gauging the appropriateness of selected values. e A button initiates the finalized analysis with algorithms customized by the selected parameters. Upon completion, graphical results appropriate for the application are automatically displayed, such as line graphs representing quantitative accumulation and occlusion values at each time point for each channel of interest, as seen in this example. f Users may export any of the outputs generated by iCLOTS, including tabular data as an Excel file, graphical results as .png images, or the initial imaging dataset as transformed by the image processing algorithms and/or labeled with indices.
Fig. 3
Fig. 3. iCLOTS single-cell tracking applications provide high-resolution measurements of velocity relative to cell size and fluorescence intensity.
iCLOTS measures velocity of one or many single cells transiting in any direction(s). We demonstrate use of this application with a specialized microfluidic assay where velocity of a cell transiting a microchannel indicates relative cell stiffness. In all applications, users are guided to adjust input parameters via interactive entry fields. Microscopy data is automatically labeled with image feature (e.g., an individual cell) indices that correspond to a line within an output tabular data sheet. Quantitative velocity, cell size, and optional fluorescence intensity values are calculated for each cell. Histograms of single metrics and scatter plots of multiple metrics are generated. Sample video frames shown taken at ×20 magnification, scale bar represents 100 μm. a Dense/dark sickle cell disease patient RBCs (n = 2561 RBCs) travel more slowly and thus are less deformable than healthy control RBCs (n = 1519 RBCs), including a stiff subpopulation of sickle cell disease patient RBCs with a velocity ranging from 0 to 100 μm/sec. b Iron deficiency anemia patient RBCs (n = 7585 RBCs) are stiffer and smaller than healthy control RBCs (n = 3745 RBCs). *Indicates difference from control (p < 0.001 by Mann–Whitney). c Heterogenous-intensity cells such as WBCs or leukemia cell lines including Jurkat (n = 57 Jurkat cells) and HL-60 cell lines (n = 14 HL-60 cells), may also be analyzed using iCLOTS. d Optional fluorescence microscopy setting sums the total fluorescence intensity of individual cells, shown here with CD71+ sickle cell disease patient reticulocytes (n = 14 reticulocytes). Sample data taken at ×20 magnification, scale bar represents 50 μm. e K-means ML clustering algorithms automatically optimize groupings formed from combined SCD and healthy control RBCs into two mathematically defined high- and low-velocity clusters. A scatter plot of chosen metrics with cluster boundaries indicated is generated. f Differences between event frequencies within clusters show that more SCD RBCs exist in the low-velocity cluster (p < 0.0001 via Chi-squared test). A mosaic plot, a stacked bar chart that shows the percentages of each population within each cluster, is generated. Source data are provided as a Source data file.
Fig. 4
Fig. 4. iCLOTS adapts feature finding and tracking algorithms to calculate cell suspension velocity measurements in microfluidic devices.
a Cell suspension velocity applications rely on algorithms that find patterns within images, typically a cluster of cells, and algorithms that track these detected patterns from one frame to the next. To quantify cell suspension velocity, users must adjust window size (a region of interest in which a detected pattern is searched for in the subsequent frame), a minimum distance traveled, and an approximate feature/cell size for best quantification. Trajectories of individual cell patterns are labeled on the provided video data, seen here as cyan lines. Data generated includes a velocity measurement for each cell pattern tracked and mean and maximum velocity for each frame. Mean and maximum velocity measurements of sickle cell patient RBCs in suspension approach zero as oxygen tension is lowered from physiologic oxygen concentrations of 160 mm Hg O2 to deoxygenated conditions of 0 mm Hg O2 (n = 1 experiment). Data taken at ×40 magnification, all scale bars represent 10 μm. b Users may also indicate a bin size for automatic generation of channel-wise velocity profiles (representative data from n = 1 experiment). taken at ×20 magnification, all scale bars represent 50 μm. c Representative time course data shows a consistent mean and maximum velocity over the time course of videos of sepsis patient and healthy control whole blood samples at a shear rate of 350 s−1, chosen to recapitulate venous shear rate of a vessel of similar dimensions. d Representative profile data shows a blunted velocity profile in sepsis patient whole blood as compared to healthy control whole blood at a shear rate of 350 s−1 indicating changes in blood viscosity. e Sepsis patient whole blood (n = 6 experiments) had a higher ratio of mean wall velocity to frame maximum velocity values as compared to healthy control whole blood (n = 3 experiments), indicating a blunted velocity profile, at a shear rate of 350 s−1 (*p = 0.047 via two-sided Mann–Whitney test). Error bars = standard deviation. Source data are provided as a Source data file.
Fig. 5
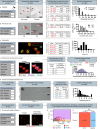
Fig. 5. iCLOTS cell adhesion applications provide indexed single-cell measurements of biological functionality.
After adjustment of relevant parameters, iCLOTS calculates numerical area and circularity values for individual cells within brightfield microscopy images, including a dark/dense platelets adhered on fibrinogen-coated surfaces (n = 231 platelets) and collagen-coated surfaces (n = 47 platelets) and b biconcave RBCs from patients with sickle cell trait (AS) genotypes (n = 134 RBCs) and sickle cell disease (SS) genotypes (n = 110 RBCs). Platelets adhered to fibrinogen surfaces spread less than those adhered to collagen (*p < 0.0001 via two-sided Mann–Whitney test). Data taken at ×30 magnification, scale bars represent 10 μm (a and b). To analyze fluorescence microscopy imaging data the user indicates pixel value thresholds for membrane and optional secondary stains and additional texture and staining intensity metrics are calculated per-cell. c Users may count regions of a secondary stain, here the number of nuclei lobes in neutrophils (n = 207 neutrophils). Data taken at ×20 magnification, scale bar represents 10 μm. d A cell protrusion characterization application calculates the number of filopodia-like protrusions present in an individual cell using additional application-specific parameters designed to apply objective requirement criteria. Data taken at ×20 magnification, scale bars represent 10 μm. e Transient adhesion time of individual cells to a biochemically-coated surface is calculated from videomicroscopy data, shown here with neutrophils (n = 1 experiment, n = 185 neutrophils) in a fibronectin-coated channel. Users adjust additional parameters designed to ensure veracity of returned data points. Data taken at ×20 magnification, scale bar represents 50 μm. f Analysis of fluorescence microscopy data of platelets reveals differences in the density of adhered platelets, the spreading area of individual platelets, and phosphatidylserine exposure in individual platelets from healthy controls and a Hermansky-Pudlak Syndrome patient. Data taken at ×40 magnification, scale bars represent 200 μm. g K-means ML analysis separates combined healthy (n = 1112) and HPS (n = 2674) platelets into two groups representing low- and high-PS exposure (n = 1 experiment). h The proportion of cells in cluster 2, the high-PS cluster, is greater in HPS samples than in healthy controls (**p < 0.0001, Chi-squared test). Source data are provided as a Source data file.
Fig. 6
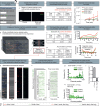
Fig. 6. iCLOTS multiscale microfluidic cell accumulation applications characterize cell aggregation in a variety of experimental devices, including those that are commercially available.
Designed for use with fluorescence microscopy images such that multiple components of a cell suspension can be simultaneously monitored, users adjust threshold values for any image color channel(s) where immunofluorescence signal is present. a Line graphs representing occlusion and accumulation over time are automatically generated. Here, CD41+ platelets and CD45+ white blood cells from sickle cell disease patient whole blood accumulate on an ibidi chamber device coated with collagen at a faster rate than healthy control whole blood (n = 3 replicates). Data taken at ×20 magnification, scale bar represents 50 μm. b The application is designed to automatically generate a map of all signals present, e.g., the dimensions of a microfluidic device, shown here with a microvasculature-on-a-chip device designed to investigate the effect of crizanlizumab on sickle cell disease whole blood samples (n = 1 experiment). Data taken at ×20, scale bar represents 200 μm. Percent occlusion (c) and accumulation rate (d) changes over the course of an experiment, showing microvascular occlusion instability. e A microchannel-specific application is available for spatial analysis of one or many straight microchannel portions of a microfluidic device. Data taken at ×20, scale bar represents 50 μm. f Spatial quantification of microvascular occlusion is automatically performed by calculating an occlusion percentage for each pixel point along the length of each microchannel. ML algorithms enable further analysis in microchannels by treating each x-coordinate and corresponding occlusion measurement from each channel as a data point. At the initial time course timepoint, t = 7 min, CD45+ white blood cells in SCD whole blood (g) and CD45+ white blood cells in SCD whole blood treated with drug crizanlizumab (h) occlude endothelialized microchannels to variable degrees at each point along the 32 analyzed microchannels. i CD45+ white blood cells in SCD whole blood predominantly occlude distal ends of microchannels at early timepoints, while CD45+ WBCs in SCD whole blood treated with crizanlizumab occlude proximal entry points of microchannels at early timepoints. Source data are provided as a Source data file.

References

    1. Myers DR, Lam WA. Vascularized microfluidics and their untapped potential for discovery in diseases of the microvasculature. Annu. Rev. Biomed. Eng. 2021;23:407–432. doi: 10.1146/annurev-bioeng-091520-025358. - DOI - PMC - PubMed
    1. Ayuso JM, Virumbrales-Muñoz M, Lang JM, Beebe DJ. A role for microfluidic systems in precision medicine. Nat. Commun. 2022;13:3086. doi: 10.1038/s41467-022-30384-7. - DOI - PMC - PubMed
    1. Mastrangeli M, van den Eijnden-van Raaij J. Organs-on-chip: the way forward. Stem Cell Rep. 2021;16:2037–2043. doi: 10.1016/j.stemcr.2021.06.015. - DOI - PMC - PubMed
    1. Iyer V, Yang Z, Ko J, Weissleder R, Issadore D. Advancing microfluidic diagnostic chips into clinical use: a review of current challenges and opportunities. Lab Chip. 2022;22:3110–3121. doi: 10.1039/D2LC00024E. - DOI - PMC - PubMed
    1. Schneider CA, Rasband WS, Eliceiri KW. NIH Image to ImageJ: 25 years of image analysis. Nat. Methods. 2012;9:671–675. doi: 10.1038/nmeth.2089. - DOI - PMC - PubMed

Publication types