. 2023 Aug 18;14(1):5018.
doi: 10.1038/s41467-023-40769-x.

Momentum-independent magnetic excitation continuum in the honeycomb iridate H3LiIr2O6

Affiliations

Momentum-independent magnetic excitation continuum in the honeycomb iridate H3LiIr2O6

A de la Torre et al. Nat Commun. .

Abstract

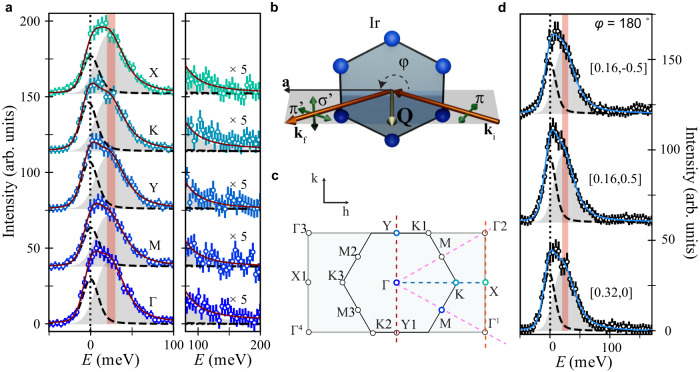
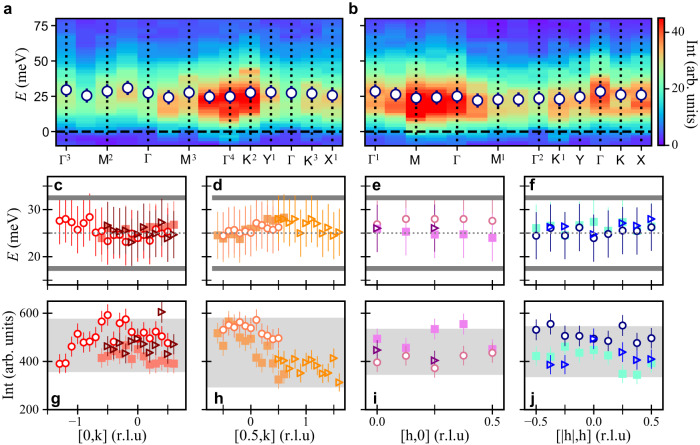
Understanding the interplay between the inherent disorder and the correlated fluctuating-spin ground state is a key element in the search for quantum spin liquids. H3LiIr2O6 is considered to be a spin liquid that is proximate to the Kitaev-limit quantum spin liquid. Its ground state shows no magnetic order or spin freezing as expected for the spin liquid state. However, hydrogen zero-point motion and stacking faults are known to be present. The resulting bond disorder has been invoked to explain the existence of unexpected low-energy spin excitations, although data interpretation remains challenging. Here, we use resonant X-ray spectroscopies to map the collective excitations in H3LiIr2O6 and characterize its magnetic state. In the low-temperature correlated state, we reveal a broad bandwidth of magnetic excitations. The central energy and the high-energy tail of the continuum are consistent with expectations for dominant ferromagnetic Kitaev interactions between dynamically fluctuating spins. Furthermore, the absence of a momentum dependence to these excitations are consistent with disorder-induced broken translational invariance. Our low-energy data and the energy and width of the crystal field excitations support an interpretation of H3LiIr2O6 as a disordered topological spin liquid in close proximity to bond-disordered versions of the Kitaev quantum spin liquid.


Conflict of interest statement

The authors declare no competing interests.

Figures

Fig. 1
Fig. 1. High-resolution resonant inelastic X-ray spectra of H3LiIr2O6 at the Ir L3 edge.
a (left) RIXS spectra at T = 10 K at high symmetry points of the Brillouin zone (BZ) (circular markers). The magnetic continuum extends up to 150 meV as shown in the right panel (right; data are scaled by a factor of 5). Spectra have been shifted vertically for clarity. b Sketch of the scattering geometry. The hexagonal arrangement of blue spheres represents a honeycomb layer of Ir4+ ions within the monoclinic crystal structure of H3LiIr2O6. The incident (ki) and outgoing (kf) radiation (orange arrows) define the scattering plane (gray), with momentum transfer Q (silver arrow). Green arrows show the polarization of the X-ray electric field (π: in-plane; σ,σ: out-of-plane for the incoming and outgoing X-ray beam, respectively). φ is the azimuthal angle defined by the crystallographic a-axis and the scattering plane. c Schematic of the extended hexagonal BZ highlighting relevant symmetry points and directions (dashed lines follow the color scheme of Fig. 3) explored in this study. L varies between 5.91 and 5.95 r.l.u. d RIXS intensity at the wavevectors of the 120° spiral order of α-Li2IrO3. Solid lines in (a) and (d) are fit to the data, including a Voigt profile for the elastic line (dotted black line) and a damped harmonic oscillator (gray shading) centered at E0 = 25 meV, red bar of width 10 meV reflects the statistical uncertainty in determining E = 0 meV. All data were taken at φ = 180°.
Fig. 2
Fig. 2. Temperature evolution of the magnetic continuum in H3LiIr2O6.
a High-resolution RIXS spectra at Γ (Q = [0, 0, 5.7]) and azimuthal angle φ = 0°, as a function of temperature. Spectra have been shifted vertically for clarity. b Circular markers indicate the center position of the damped harmonic oscillator (DHO) component as extracted from a fit to the data. Square markers are the extracted amplitude of the DHO normalized to the value at T = 10 K. The blue solid line indicates the Curie–Weiss temperature, θCW, and the dashed black lines are guides to the eye. Black error bars are the systematic error in determining E = 0 meV. Red error bars are the statistical uncertainty of RIXS intensity. c T = 300 K RIXS intensity (circular markers) at three high symmetry points (Γ, black, K, red, M, blue). The solid line is a fit to the data including a Voigt profile for the elastic line (dotted black line) and a damped harmonic oscillator (shading).
Fig. 3
Fig. 3. Absence of short-range correlations in the momentum-independent magnetic continuum.
a High-resolution elastic-background-subtracted RIXS intensity along high symmetry paths with H ≤ 0, φ = 0° and, b, H ≥ 0, φ = 180°. Overlaid circular markers indicate the center position of the continuum of magnetic excitations as extracted from a fit to the data. Error bars are the systematic error in determining E = 0 meV. The colorbar applies to both (a) and (b). cf Center energy of the continuum of magnetic excitations across the Brillouin zone as extracted from a fit to the inelastic RIXS intensity to a damped harmonic oscillator. The dashed line at E = 25 meV is the average momentum position of the continuum. The energy resolution was relaxed to a FWHM = 28 meV as indicated by the solid gray lines. Error bars are the systematic error in determining E = 0 meV. gj Integrated elastic-background-subtracted RIXS intensity in the range E ∈ [−50, 170] meV. The gray-shaded rectangle represents the variation of the elastic intensity. error bars are the statistical uncertainty of RIXS intensity. Circular markers (φ = 0°), triangular markers (φ = 180°), and square markers (φ = 90°) show the azimuthal dependence.
Fig. 4
Fig. 4. Local Ir electronic structure.
a RIXS intensity as a function of the incident X-ray energy near the Ir L3 edge. The intense inelastic feature centered at E ≈ 3.8 eV is from transitions between occupied t2g states and empty eg orbitals in a Ir4+ ion (see Supplementary Information). White dashed lines in (a) delineate the energy range shown in (b). b Intra-t2g RIXS excitations at Ei = 11.215 keV (circular markers) compared to the calculated RIXS intensity from exact diagonalization calculations. Blue solid line is a fit to the data including a Voigt peak, a DHO, four Gaussian peaks and an arctan step to account for the background (A–D). c O K-edge X-ray absorption spectroscopy data (μ(E)) and fit to the data in H3LiIr2O6 (circular markers; blue line) and α-Li2IrO3 (square markers; orange line). α and β highlight the two main features in the XAS data as discussed in the main text. Solid gray lines show the two Lorentzian and two Gaussian profiles included in the fit. Dashed line represents the arc tangent step to account for the electron hole continuum.

References

    1. Savary L, Balents L. Quantum spin liquids: a review. Rep. Prog. Phys. 2017;80:016502. - PubMed
    1. Broholm C, et al. Quantum spin liquids. Science. 2020;367:eaay0668. - PubMed
    1. Kitaev A. Anyons in an exactly solved model and beyond. Ann. Phys. 2006;321:2–111.
    1. Jackeli G, Khaliullin G. Mott insulators in the strong spin-orbit coupling limit: from Heisenberg to a quantum compass and Kitaev models. Phys. Rev. Lett. 2009;102:017205. - PubMed
    1. Rau JG, Lee EricKin-Ho, Kee Hae-Young. Generic spin model for the honeycomb iridates beyond the Kitaev limit. Phys. Rev. Lett. 2014;112:077204. - PubMed