. 2023 Aug 18;24(1):466.
doi: 10.1186/s12864-023-09573-1.

Complete mitochondrial genome of Agrostis stolonifera: insights into structure, Codon usage, repeats, and RNA editing

Affiliations

Complete mitochondrial genome of Agrostis stolonifera: insights into structure, Codon usage, repeats, and RNA editing

Jiaxing Li et al. BMC Genomics. .

Abstract

Background: Plants possess mitochondrial genomes that are large and complex compared to animals. Despite their size, plant mitochondrial genomes do not contain significantly more genes than their animal counterparts. Studies into the sequence and structure of plant mitochondrial genomes heavily imply that the main mechanism driving replication of plant mtDNA, and offer valuable insights into plant evolution, energy production, and environmental adaptation.

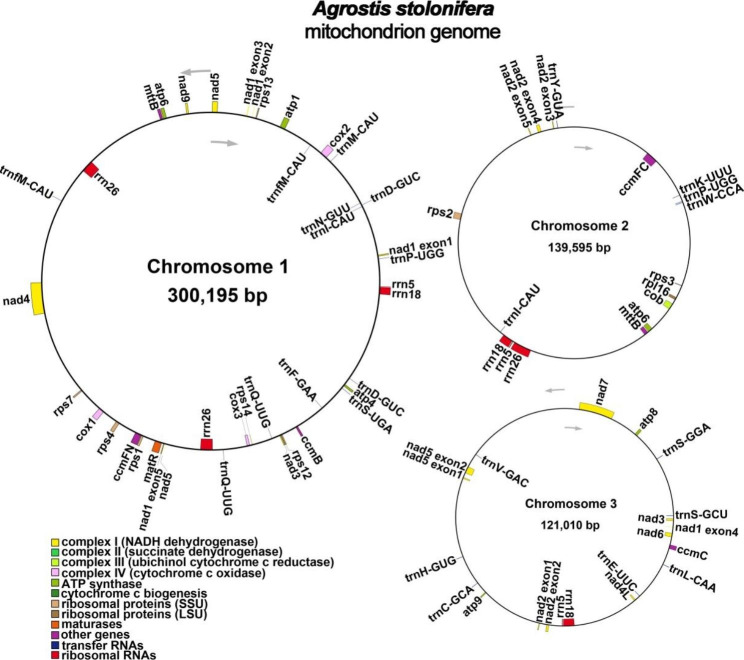
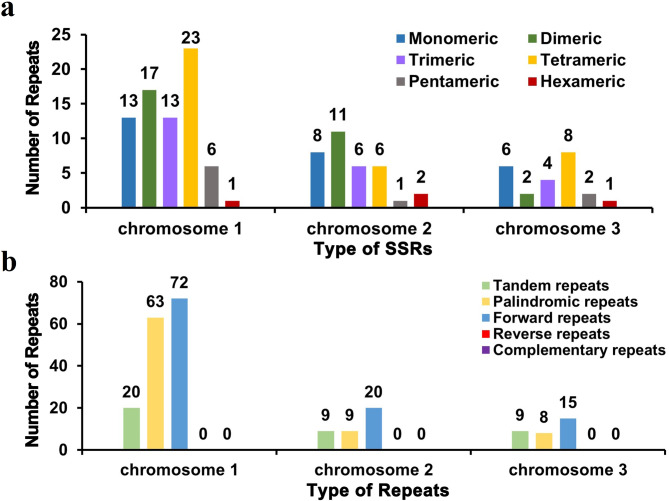
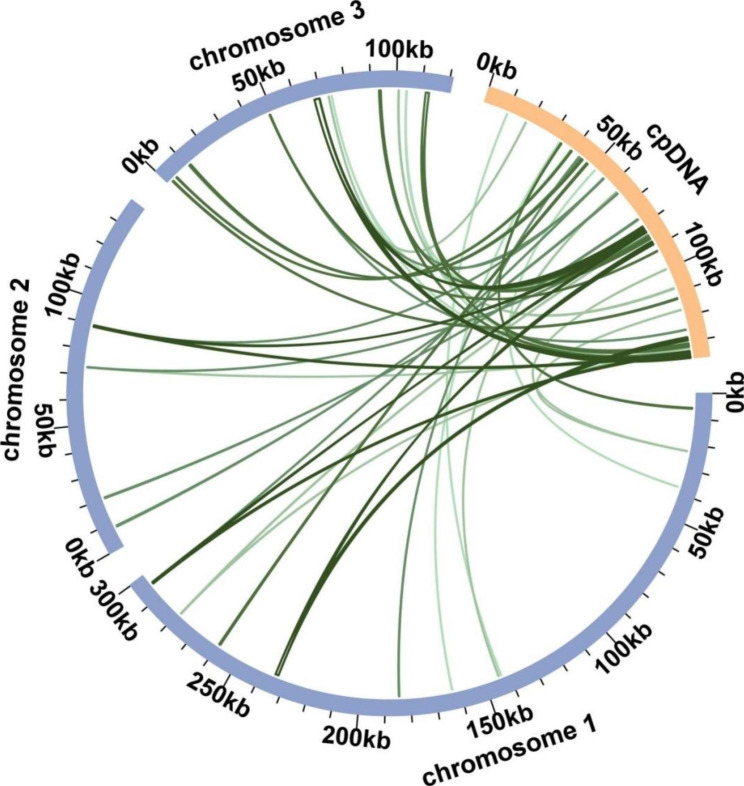
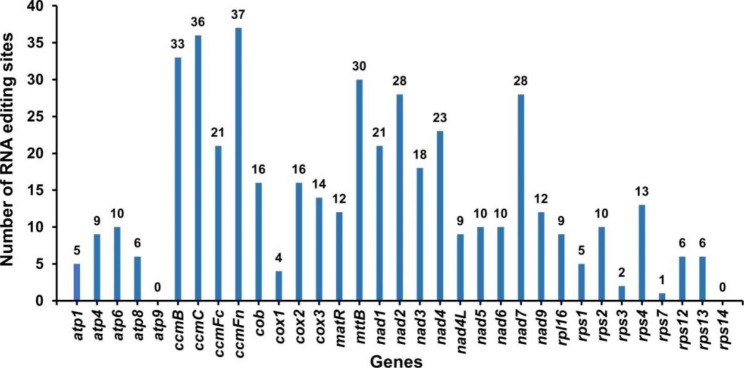
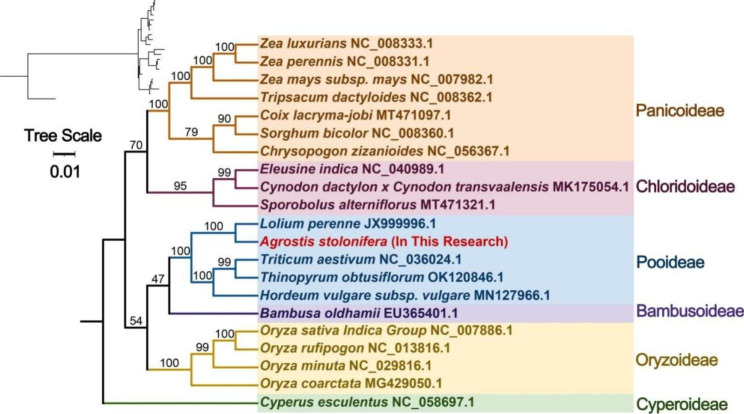
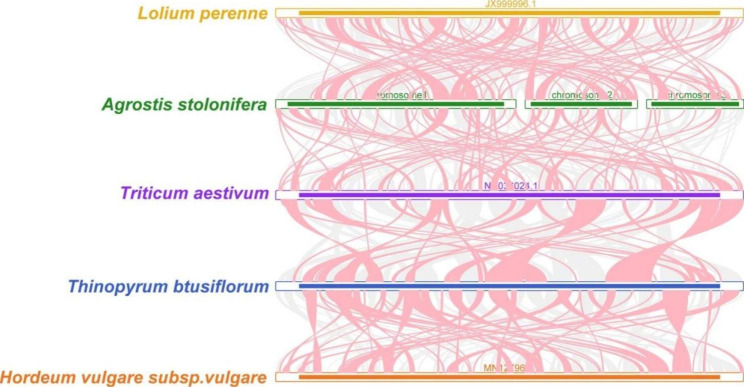
Results: This study presents the first comprehensive analysis of Agrostis stolonifera's mitochondrial genome, characterized by a branched structure comprising three contiguous chromosomes, totaling 560,800 bp with a GC content of 44.07%. Annotations reveal 33 unique protein-coding genes (PCGs), 19 tRNA genes, and 3 rRNA genes. The predominant codons for alanine and glutamine are GCU and CAA, respectively, while cysteine and phenylalanine exhibit weaker codon usage biases. The mitogenome contains 73, 34, and 23 simple sequence repeats (SSRs) on chromosomes 1, 2, and 3, respectively. Chromosome 1 exhibits the most frequent A-repeat monomeric SSR, whereas chromosome 2 displays the most common U-repeat monomeric SSR. DNA transformation analysis identifies 48 homologous fragments between the mitogenome and chloroplast genome, representing 3.41% of the mitogenome's total length. The PREP suite detects 460 C-U RNA editing events across 33 mitochondrial PCGs, with the highest count in the ccmFn gene and the lowest in the rps7 gene. Phylogenetic analysis confirms A. stolonifera's placement within the Pooideae subfamily, showing a close relationship to Lolium perenne, consistent with the APG IV classification system. Numerous homologous co-linear blocks are observed in A. stolonifera's mitogenomes and those of related species, while certain regions lack homology.

Conclusions: The unique features and complexities of the A. stolonifera mitochondrial genome, along with its similarities and differences to related species, provide valuable insights into plant evolution, energy production, and environmental adaptation. The findings from this study significantly contribute to the growing body of knowledge on plant mitochondrial genomes and their role in plant biology.

Keywords: A. stolonifera; Mitochondrial genome; RNA editing events; Repeat-mediated recombination.


Conflict of interest statement

The authors declare that they have no competing interests.

Figures

Fig. 1
Fig. 1
Structure features of A. stolonifera mitogenome. (a) Branched conformation of A. stolonifera mitogenome. (b) Three circular molecules of A. stolonifera mitogenome
Fig. 2
Fig. 2
 A. stolonifera mitogenome gene map. Genes located inside the circle are transcribed in a clockwise direction, while those outside the circle are transcribed counterclockwise. The inner circle features a dark gray region which depicts the GC content
Fig. 3
Fig. 3
Analysis of codon usage bias in A. stolonifera mitochondrial genomes. X-axis, codon families; Y-axis, the relative synonymous codon usage (RSCU) value. RSCU measures the likelihood of a specific codon being used among synonymous codons that encode the same amino acid and values greater than 1 indicate a higher frequency of usage for the codon
Fig. 4
Fig. 4
Repeat sequence analysis of the A. stolonifera mitochondrial genome. (a) The x-axis represents the type of SSRs while the y-axis represents the number of repeats. Each colored legend represents a different type of SSR: purple for monomer, yellow for dimer, blue for trimer, green for tetramer, gray for pentamer, and red for hexamer SSRs. (b) The x-axis displays the type of repeats, and the y-axis displays the number of repeats. The green, red, and blue legends correspond to tandem, palindromic, and forward repeats, respectively. Notably, neither reverse nor complementary repeats were identified in the mitochondrial genome under investigation
Fig. 5
Fig. 5
The gene transfers that occurred between the chloroplast and mitochondrial genomes of A. stolonifera. The blue and orange arcs denote the mitochondrial and chloroplast genomes, respectively, while the green lines connecting the arcs represent homologous genome segments that were transferred between the two organelles
Fig. 6
Fig. 6
The Number of RNA editing sites predicted in PCGs of A. stolonifera mitochondrial genome
Fig. 7
Fig. 7
The phylogenetic relationships of A. stolonifera with other closely related species.The Neighbor-Joining tree was constructed based on the sequences of 22 conserved PCGs. Colors indicate the families that the specific species belongs
Fig. 8
Fig. 8
Mitochondrial genome Multiple Synteny Plot of A. stolonifera and closely related species.The bars on the graph indicate the mitochondrial genomes of the species, while the ribbons depict the homologous sequences between adjacent species. The red areas highlight where inversions occurred, while the gray areas indicate regions with strong homology

References

    1. Schultze M, Kondorosi A. Regulation of symbiotic root nodule development. Annu Rev Genet. 1998;32:33–57. doi: 10.1146/annurev.genet.32.1.33. - DOI - PubMed
    1. Burger G, Gray MW, Franz Lang B. Mitochondrial genomes: anything goes. Trends Genet. 2003;19(12):709–16. doi: 10.1016/j.tig.2003.10.012. - DOI - PubMed
    1. Liere K, Börner T. Development-dependent changes in the amount and Structural Organization of Plastid DNA. 2013. doi:10.1007/978-94-007-5724-0_11.
    1. Wendel JF. Genome evolution in polyploids. Plant Mol Biol. 2000;42(1):225–49. doi: 10.1023/A:1006392424384. - DOI - PubMed
    1. Gaeta RT, Pires JC, Iniguez-Luy F, Leon E, Osborn TC. Genomic changes in Resynthesized Brassica napus and their effect on Gene expression and phenotype. Plant Cell. 2007;19(11):3403–17. doi: 10.1105/tpc.107.054346. - DOI - PMC - PubMed

LinkOut - more resources