. 2023 Aug 18;20(1):183.
doi: 10.1186/s12985-023-02146-4.

Influenza a virus regulates interferon signaling and its associated genes; MxA and STAT3 by cellular miR-141 to ensure viral replication

Affiliations

Influenza a virus regulates interferon signaling and its associated genes; MxA and STAT3 by cellular miR-141 to ensure viral replication

Mai Alalem et al. Virol J. .

Abstract

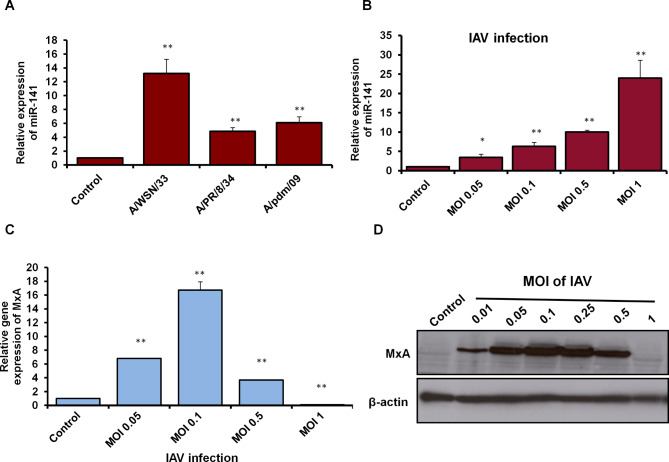
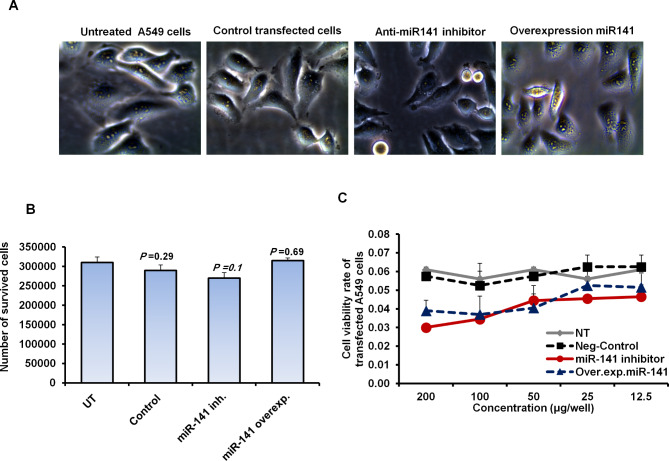
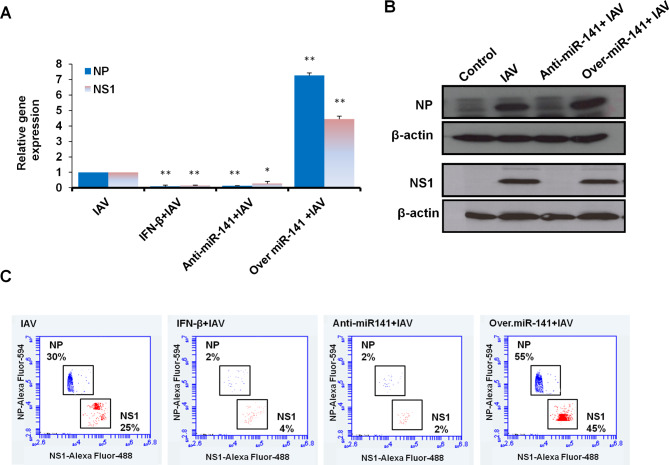
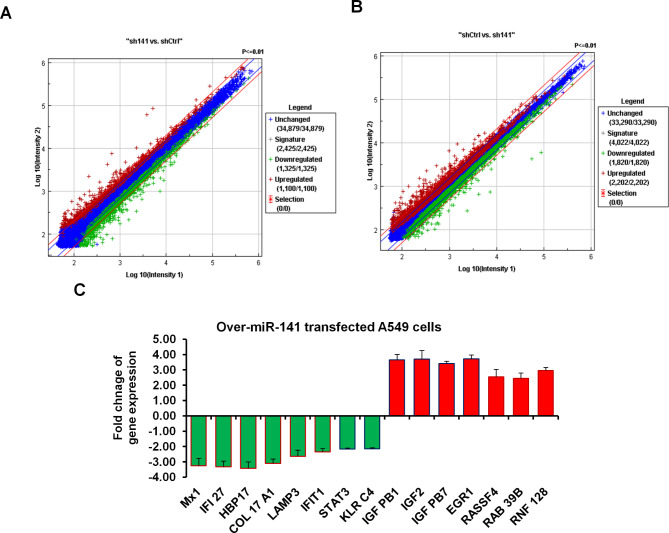
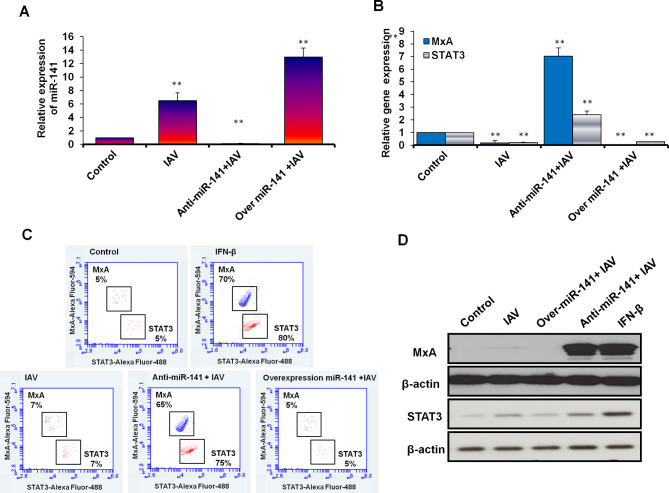
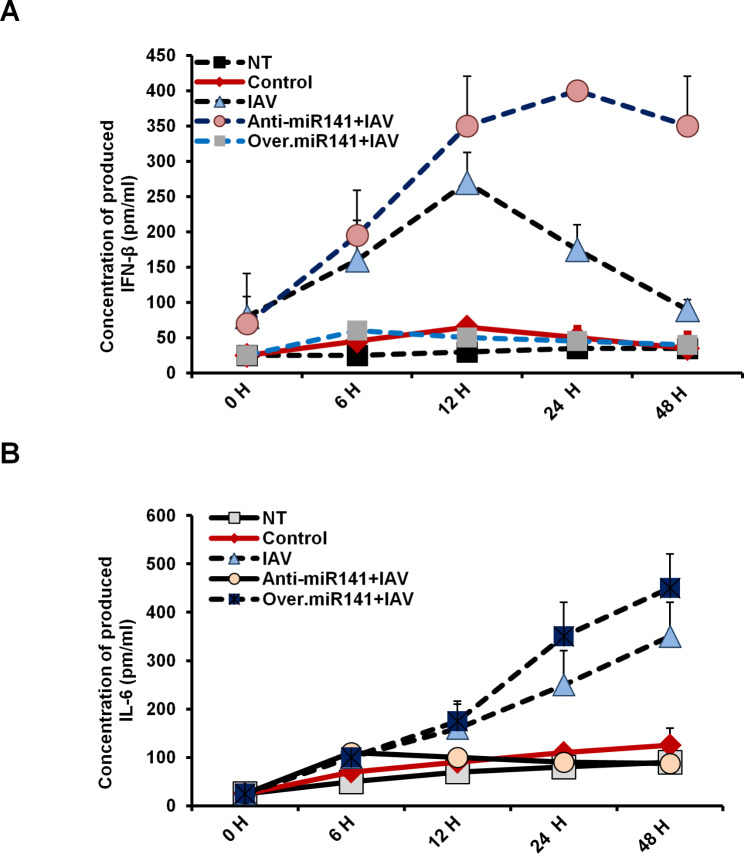
The antiviral response against influenza A virus (IAV) infection includes the induction of the interferon (IFN) signaling pathway, including activation of the STATs protein family. Subsequently, antiviral myxovirus resistance (MxA) protein and other interferon-stimulated genes control virus replication; however, the molecular interaction of viral-mediated IFN signaling needs more investigation. Host microRNAs (miRNAs) are small non-coding molecules that posttranscriptionally regulate gene expression. Here, we sought to investigate the possible involvement of miR-141 in IAV-mediated IFN signaling. Accordingly, the microarray analysis of A549 cells transfected with precursor miR-141 (pre-miR-141) was used to capture the potentially regulated genes in response to miR-141 overexpression independent of IAV infection. The downregulation of targeted genes by miR-141, in addition to viral gene expression, was investigated by quantitative real-time PCR, western blot analysis, and flow cytometric assay. Our findings showed a significant upregulation of miR-141 in infected A549 cells with different strains of IAV. Notably, IAV replication was firmly interrupted in cells transfected with the miR-141 inhibitor. While its replication significantly increased in cells transfected with pre-miR-141 confirming the crucial role of miRNA-141 in supporting virus replication. Interestingly, the microarray data of miR-141 transduced A549 cells showed many downregulated genes, including MxA, STAT3, IFI27, and LAMP3. The expression profile of MxA and STAT3 was significantly depleted in infected cells transfected with the pre-miR-141, while their expression was restored in infected cells transfected with the miR-141 inhibitor. Unlike interleukin 6 (IL-6), the production of IFN-β markedly decreased in infected cells that transfected with pre-miR-141, while it significantly elevated in infected cells transfected with miR-141 inhibitor. These data provide evidence for the crucial role of miR-141 in regulating the antiviral gene expression induced by IFN and IL-6 signaling during IAV infection to ensure virus replication.

Keywords: IAV; IFN-β signaling; IL-6; MxA gene; STAT3; miR-141.


Conflict of interest statement

The authors declare no competing interests.

Figures

Fig. 1
Fig. 1
Expression profile of miR-141 and MxA in IAV-infected cells. (A) Relative expression level of miR-141 in A549 cells infected with different strains of IAV, including A/WSN/33, A/PR/8/34, and A/pdm/09 indicated by fold change using qRT-PCR. (B) Expression levels of miR-141 in A549 cells infected with different MOIs of IAV/WSN/33 indicated by qRT-PCR. Error bars indicate the standard deviation (STD) of three independent experiments. (C) Relative gene expression of MxA in A549 cells infected with IAV/WAN/33, different MOIs, for 24 h indicated by qRT-PCR. Error bars indicate the STD of three independent experiments. Student two-tailed t-test used for statistical analysis, (*) indicates P ≤ 0.05, while (**) indicates P ≤ 0.01. (D) Immunoblotting analysis of MxA protein expression in A549 cells infected with different MOIs of IAV/WSN/33 for 24 h, β-actin expression profile severed as an internal control
Fig. 2
Fig. 2
Cytotoxic influence of pre-miR-141 and specific inhibitor transfection in A549 cells. (A) A549 cell morphology indicated by inverted microscope upon 48 h of transfection with either pre-miR-141 or an inhibitor antagonist miR-141 compared with control-transfected and untreated cells. (B) After transfection with the miR-141 inhibitor or precursor, the number of living A549 cells statement. (C) Cell viability rate of transfected A549 cells with different concentrations of the pre-miR-141 and specific inhibitor indicated by the absorbance rate of treated cells with MTT agent. Error panels present the STD of three independent experiments. Student two-tailed t-test was used for statistical analysis
Fig. 3
Fig. 3
Expression profile of viral NP and NS1 in A549 cells transfected with pre-miR-141 or specific inhibitor. (A) Relative gene expression of both viral NP and NS1 in A549 cells treated with IFN-β or transfected with pre-miR-141 or specific inhibitor compared with noninfected cells (control cells). Error bars indicate the STD of three independent experiments. Student two-tailed t-test used for statistical analysis, (*) indicates P-values ≤ 0.05, and (**) indicates P ≤ 0.01. (B) Immunoblotting analysis of viral NP and NS1 protein expression in infected A549 that either treated with IFN-β or transfected with miR-141 overexpression vector or specific inhibitor compared with control cells, β-actin expression profile severed as an internal control. (C) Flow cytometric assay quantifies the kinetic proteins expression profile of NP (in blue dots) and NS1 (in red dots) in infected and transfected A549 cells compared with control cells
Fig. 4
Fig. 4
Microarray analysis of transfected A549 cells with pre-miR-141. (A) Microarray analysis of gene expression in A549 cells transfected with pre-miR-141 overexpression vs. control-transfected cells using a miRNA library from Exiqon. (B) Microarray analysis of gene expression in A549 cells transfected with pre-miR-141 overexpression vs. control-transfected cells using oligonucleotides from Ambion. The blue color indicates the sustained gene expression, the red indicates the upregulated genes, and the green indicates the downregulated genes. (C) The expression of the most relevant genes to an antiviral strategy indicates the upregulated genes in red columns and downregulated genes in green. Error bars indicate the STD between Exiqon and Ambion data
Fig. 5
Fig. 5
The correlation between miR-141 level and the expression profile of MxA and STAT3 in infected A549 cells. (A) Quantification of steady-state miR-141 in infected A549 cells with MOI of 0.5 and transfected with either pre-miR-141 or miR-141 inhibitor compared with noninfected cells (control) using qRT-PCR. (B) Relative gene expression of MxA and STAT3 in infected A549 cells transfected with either specific inhibitor against miR-141 or pre- miR-141 compared with control-transfected cells using qRT-PCR. Error bars indicate the STD of three independent experiments. Student two-tailed t-test used for statistical analysis, (*) indicates P-values ≤ 0.05, and (**) indicates P ≤ 0.01. (C) Flow cytometric assay quantifies the kinetic proteins expression profile of MxA (in blue dots) and STAT3 (in red dots) in infected and transfected A549 cells compared with control cells. (D) Western blot analysis reveals the protein expression level of MxA and STAT3 in infected and transfected cells compared to control cells, β-actin expression profile severed as an internal control
Fig. 6
Fig. 6
Levels of produced cytokines in infected and transfected A549 cells. (A) The concentration of produced IFN-β (pm/ml) in the fluid media of infected and transfected A549 cells at the indicated time points in comparison with its concentration in the fluid media of nontreated cells (NT) and cells treated with the transfection reagent (Control). (B) The concentration of IL-6 in the culture media of infected and transfected A549 cells at the indicated time points compared with its concentration in the fluid media of NT cells and control-treated cells. Error bars indicate the STD of four different replicates

References

    1. Smith GJD, Vijaykrishna D, Bahl J, Lycett SJ, Worobey M, Pybus OG, et al. Origins and evolutionary genomics of the 2009 swine-origin H1N1 influenza a epidemic. Nature. 2009;459:1122–5. doi: 10.1038/nature08182. - DOI - PubMed
    1. Morens DM, Taubenberger JK, Fauci AS. The persistent legacy of the 1918 Influenza Virus. N Engl J Med. 2009;361:225–9. doi: 10.1056/NEJMp0904819. - DOI - PMC - PubMed
    1. Worobey M, Han G-Z, Rambaut A. Genesis and pathogenesis of the 1918 pandemic H1N1 influenza a virus. Proc Natl Acad Sci. 2014;111:8107–12. doi: 10.1073/pnas.1324197111. - DOI - PMC - PubMed
    1. Bai L, Zhao Y, Dong J, Liang S, Guo M, Liu X, et al. Coinfection with influenza a virus enhances SARS-CoV-2 infectivity. Cell Res. 2021;31:395–403. doi: 10.1038/s41422-021-00473-1. - DOI - PMC - PubMed
    1. Harris A, Cardone G, Winkler DC, Heymann JB, Brecher M, White JM, et al. Influenza virus pleiomorphy characterized by cryoelectron tomography. Proc Natl Acad Sci. 2006;103:19123–7. doi: 10.1073/pnas.0607614103. - DOI - PMC - PubMed

Publication types