. 2023 Aug 18;42(1):210.
doi: 10.1186/s13046-023-02782-2.

Breast cancer patient-derived microtumors resemble tumor heterogeneity and enable protein-based stratification and functional validation of individualized drug treatment

Affiliations

Breast cancer patient-derived microtumors resemble tumor heterogeneity and enable protein-based stratification and functional validation of individualized drug treatment

Nicole Anderle et al. J Exp Clin Cancer Res. .

Abstract

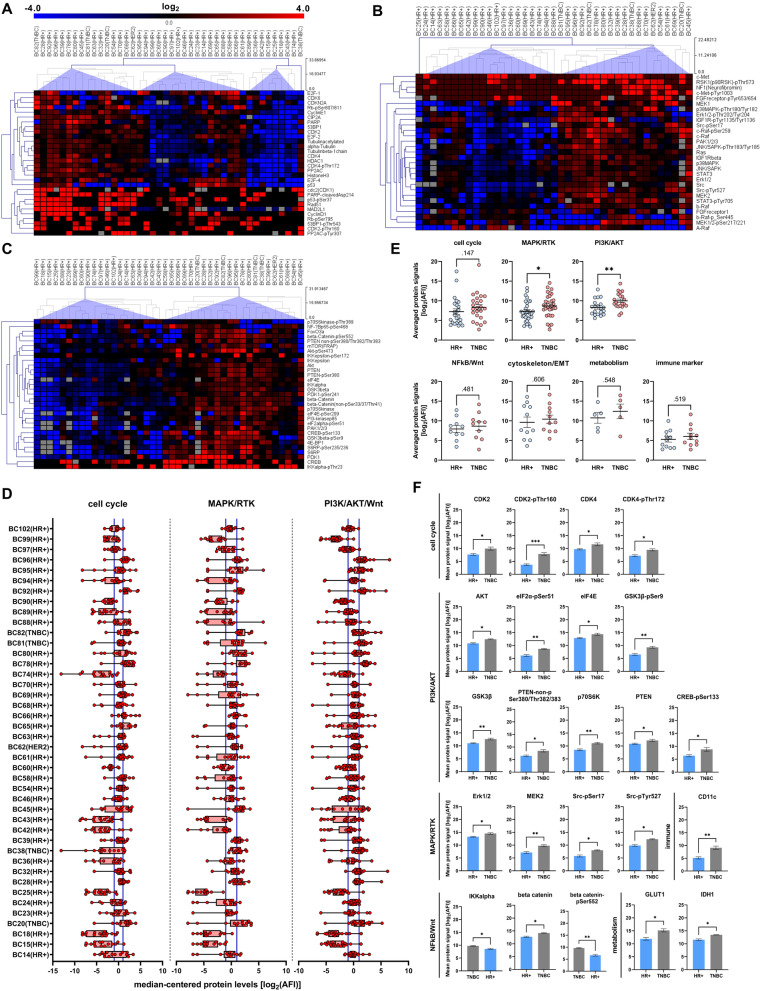
Despite tremendous progress in deciphering breast cancer at the genomic level, the pronounced intra- and intertumoral heterogeneity remains a major obstacle to the advancement of novel and more effective treatment approaches. Frequent treatment failure and the development of treatment resistance highlight the need for patient-derived tumor models that reflect the individual tumors of breast cancer patients and allow a comprehensive analyses and parallel functional validation of individualized and therapeutically targetable vulnerabilities in protein signal transduction pathways. Here, we introduce the generation and application of breast cancer patient-derived 3D microtumors (BC-PDMs). Residual fresh tumor tissue specimens were collected from n = 102 patients diagnosed with breast cancer and subjected to BC-PDM isolation. BC-PDMs retained histopathological characteristics, and extracellular matrix (ECM) components together with key protein signaling pathway signatures of the corresponding primary tumor tissue. Accordingly, BC-PDMs reflect the inter- and intratumoral heterogeneity of breast cancer and its key signal transduction properties. DigiWest®-based protein expression profiling of identified treatment responder and non-responder BC-PDMs enabled the identification of potential resistance and sensitivity markers of individual drug treatments, including markers previously associated with treatment response and yet undescribed proteins. The combination of individualized drug testing with comprehensive protein profiling analyses of BC-PDMs may provide a valuable complement for personalized treatment stratification and response prediction for breast cancer.

Keywords: Anti-cancer drug efficacy; Breast cancer; Preclinical tumor model; Protein profiling; Therapy resistance; Therapy sensitivity; Tumor heterogeneity.


Conflict of interest statement

A.H. received consulting and speaking fees from AstraZeneca, Amgen, Clovis, Daichii Synkyo, Eisai, ExactScience, Gilead, GSK, Hexal, Lilly, MSD, Novartis, Pfizer, Roche, Pierre-Fabre and Seagen. N.A., F.S-R., N.K, A.K., A.-L.K., B.G., A.S., S.L., M.P., M.H., S.Y.B., K.S-L., M.T. and C.S. declare no competing interest.

Figures

Fig. 1
Fig. 1
Isolation success of BC-PDMs. (A) Live-dead cell staining of isolated BC-PDMs from representative breast carcinoma tissue samples. BC-PDMs were stained with Calcein-AM (viable cells), SYTOX™ Orange (dead cells) and Hoechst 33258 (nuclei). Scale bars 50 µm. (B) Quantification of viable and dead cells in n = 27 BC models (on average three BC-PDMs per model) reveals high viability of BC-PDMs. Fluorescent intensities and volumes (µm3) were assessed using the Imaris Software. Wilcoxon paired signed rank test, ***p < 0.001. (C) Area measurement of BC-PDMs from n = 27 BC models. Data are shown as mean values with SD. (D) Success rate of microtumor isolation from n = 102 breast carcinomas. 50% of BC-PDMs reached a total number of more than 100 single microtumors. (E) Correlation of BC-PDM isolation success rate and clinical characteristics of corresponding breast carcinomas tissue samples
Fig. 2
Fig. 2
Histopathology and cytology of BC-PDMs and corresponding PTT. H&E staining of BC-PDMs and corresponding primary, (A) invasive ductal breast carcinomas (NST) with/without ductal in-situ (DCIS) lesions and (B) invasive lobular breast carcinomas (ILC) with/without lobular in-situ (LCIS) lesions. (C) Pathological evaluation of BC-PDMs. n = 39/40 BC-PDMs resembled histopathology of breast carcinomas, n = 36/38 of the corresponding primary tumor histotype (NST/ILC; NST/ILC histology not available for one sample; one other sample classified as medullary carcinoma and excluded from comparison of NST and ILC BC-PDMs) and n = 23/40 BC-PDMs displayed stromal parts. Histopathological tumor characteristics of BC-PDMs were assessed such as hyperchromasia and nuclei differentiation (nuclear grade 1: nuclei with little variation in size and shape; grade 3: large nuclei with high variation in size and shape; grade 2: nuclei show features between 1 and 3. (D) Movat-pentachrome staining revealed connective tissue compartments in BC-PDMs and PTT e.g. collagen fibers (yellow), PGs/GAGs (cyan blue), collagen/PGs/GAGs-superimposition (green), mucins (blue) and elastin (black; representative images shown for n = 8 matched pairs of BC-PDMs and corresponding PTT). (E) Amount of collagen fibers within BC-PTT and BC-PDMs. Collagen fibers are measured semi-quantitatively as %-area fraction. RGB images were unmixed by subtractive mixing (color deconvolution) via ImageJ. (F) Averaged %-area fraction of BC-PTT and BC-PDM (n = 17) samples shown in (E). Data are mean with SEM. *p < 0.05, **p < 0.01, ***p < 0.001. Unpaired, parametric t-test. Scale bars BC-PDMs: 50 µm/10 µm (zoom); PTT: 500 µm/50 µm (zoom; paired sections of BC-PDMs and corresponding PTT specimen were available from n = 17 samples displaying stromal parts for Movat-pentachrome stainings)
Fig. 3
Fig. 3
Immunohistochemical analysis of breast cancer specific and immune cell markers in BC-PDMs. DAB staining was analyzed semi-quantitatively as %-area fraction of a BC-PDMs. RGB images were unmixed by subtractive mixing (color deconvolution) using ImageJ software. (A) Hormone receptor (HR) DAB staining of clinically classified HR+ BC-PDMs vs. TNBC BC-PDMs. Clinically assessed immunoreactive scores (IRS) from primary tumor are indicated. HR+ BC-PDMs were arranged in ascending order of ERα expression (B) HR+ BC-PDMs have increased HR expression (ERα, PgR, HER2) compared to TNBC BC-PDMs. (C) DAB staining of luminal cytokeratin (CK18) and basal cytokeratins (CK5 and CK6). BC-PDMs were grouped into four groups according to CK staining: CK5CK18+, CK5+, CK5/6+ and CK5/6/18+. (D) Significantly elevated expression of luminal CK18 vs. basal CK5/CK6 in HR+ compared to TNBC BC-PDMs. Mann–Whitney U test, **p = 0.006. Differences in CK18, CK5 and CK6 expression in HR+ and TNBC BC-PDMs according to their classification into the previously determined groups. Within group: One-way ANOVA, Holm-Šídák’s multiple comparisons test. Different group comparison: Two-way ANOVA, Holm-Šídák’s multiple comparisons test. (E) Differences in CK and FAPα expression in ILC BC-PDMs vs. NST BC-PDMs. NST BC-PDMs show higher levels of CK18, while ILC BC-PDMs show significant higher levels of FAPα. Mann–Whitney U-test, *p = 0.028. Both ILC/NST BC-PDMs express basal CK5 and 6. (F) DAB staining of FAPα and immune markers in BC-PDMs grouped into HR+ and TNBC. For HR+ BC-PDMs, BC-PDMs were arranged in ascending order of FAPα expression. Data are mean with SEM. *p < 0.05, **p < 0.01, ***p < 0.001. ERα: estrogen receptor alpha; PgR: progesterone receptor; HER2: HER2/neu-ErbB2 receptor
Fig. 4
Fig. 4
Comparison of protein profiles from BC-PDMs and corresponding primary tumor tissue. N = 20 matched BC-PDM and PTT-pairs were analyzed. (A) X–Y plot of correlated protein means of BC-PDMs and PTT. Protein signals of measured BC-PDM-PTT samples were correlated using Pearson correlation. DigiWest AFI protein signals were averaged for BC-PDMs/ PTT and log2 transformed. Each dot represents one protein. Pearson r = 0.856; ***p < 0.001. (B) Overall signaling pathway activity in BC-PDMs resembled that of primary BC tumors. Proteins were sorted by pathway affiliation. Shown are AFI protein signals, averaged for BC-PDMs/PTT and log2 transformed. Mann–Whitney test; p values as indicated. (C-D) Differently expressed proteins of matched BC-PDMs-PTT samples. Volcano plot shows proteins with significantly decreased or increased expression in BC-PDMs (red) with an adjusted FDR p-value (-log10 (q)) > 1.3 and a log2 fold change >|1|; multiple t-test with Welch correction; Benjamini, Krieger, and Yekutieli FDR. Exact values are shown in (D). (E) Heatmap of unclustered pearson correlation coefficients (r) shows moderate correlation of AFI protein signals over BC-PDMs and matched PTT samples. (F) Pearson correlation coefficients (r) displayed as scatter plot with a median correlation of r = 0.44. Data are mean with SEM. AFI: averaged fluorescent intensities
Fig. 5
Fig. 5
DigiWest-based protein pathway profiling of BC-PDMs. Hierarchical cluster linkage analysis (HCL) of median-centered, log2 transformed AFI protein signals of n = 42 BC-PDMs, divided into cell cycle, MAPK/RTK and PI3K/Akt pathways. Molecular subtype classifications of BC-PDMs as indicated. (A) HCL of sample and cell cycle-related analytes with complete linkage. Four sample clusters were identified based on differential expression levels. (B) HCL of sample and MAPK/RTK-related analytes with average linkage. There are two main sample clusters (excl. BC-PDM #25) that separate samples with high MAPK/PI3K protein expression from those with low expression. (C) HCL of sample and PI3K/AKT-related analytes with complete linkage. Two main sample clusters were identified: “high-expression” and “low-expression”. (D) Differences in signal transduction in BC-PDMs samples. Box-whisker plots show median-centered, log2 transformed AFI protein signals of different pathways. Data distribution within samples is illustrated by lines connecting min. and max. values. Each red dot represents a protein. Black lines in box plots indicate the “median” of measured proteins within a sample. Blue lines delineate the values >|1| corresponding to a fold change > 0.5. (E) TNBC BC-PDMs showing elevated PI3K/AKT- and MAPK/RTK- pathway activity. The averaged, log2 transformed protein signals are compared between TNBC and HR+ BC-PDMs within different pathways. Mann–Whitney U test, PI3K: p = 0.006, MAPK/RTK: p = 0.032. (F) Differentially expressed proteins in TNBC BC-PDMs. Comparison of mean protein expression in TNBC vs. HR+ BC-PDMs. Enhanced protein abundances in TNBC BC-PDMs were found for several proteins associated with cell cycle, metabolism, immune system, PI3K/AKT, MAPK/RTK and NFkB pathway. Mann–Whitney U test, *p < 0.05, **p < 0.01, ***p < 0.001. Data are mean with SEM
Fig. 6
Fig. 6
Treatment responses analyzed in BC-PDMs and identification of resistance and sensitivity marker panels. (A) Treatment response of breast cancer (BC) PDM to anti-cancer drugs. Microtumors were classified as “responder” and non-responder” based on the results of cytotoxicity measurements (Celltox Green™ assay; Promega). Cytotoxicity was determined in a time series (24 h, 48 h and 72 h). Treatment effects were analyzed as fold change of the respective control for each measurement time point using a mixed-effects model (REML) and Fisher’s uncorrected LST test. Statistically significant fold changes were defined as “response” and BC-PDMs were accordingly classified as “responders”. The numbers indicate BC sample number. (B-D) TAM, (EH) DTX, (I-L) PTX and (MO) PAB resistance and sensitivity marker panels. Median-centered, log2-transformed DigiWest AFI protein signals were compared between R and Non-R groups. Each data point within the scatter bar plots represents the same protein in R and Non-R. Lines connect protein data points between Non-R and R. Therapy resistance and sensitivity panels were identified including up to thirteen proteins (for detailed protein list see Table 1). Comparison of R and Non-R protein “panel” signals by non-parametric, unpaired Mann–Whitney U test. Within these protein panels individual, differentially expressed proteins are depicted (non-parametric, unpaired Mann–Whitney U test). *p < 0.05, **p < 0.01 and ***p < 0.001. Shown are mean with SEM. AFI: average fluorescent intensities; Non-R: non-responder; R: responder; TAM: tamoxifen (100 nM), DTX: docetaxel (5.5 µM), PTX: paclitaxel (4 µM), PAB: Palbociclib (150 nM)

Similar articles

Cited by

References

    1. Caswell-Jin JL, Plevritis SK, Tian L, Cadham CJ, Xu C, Stout NK, et al. Change in Survival in Metastatic Breast Cancer with Treatment Advances: Meta-Analysis and Systematic Review. JNCI Cancer Spectr. 2018;2(4):pky062. - PMC - PubMed
    1. Lakhani SR, Ellis IO, Schnitt S, Tan PH, van de Vijver M. WHO Classification of Tumours of the Breast. 2012.
    1. Tavassoli F.A. & Devilee P. Pathology and Genetics of Tumours of the Breast and Female Genital Organs. WHO Classification of Tumours. IARCPress Lyon. 2003, 246.
    1. Perou CM, Sørlie T, Eisen MB, Van De Rijn M, Jeffrey SS, Rees CA, et al. Molecular portraits of human breast tumours. Nature. 2000;406(6797):747–752. - PubMed
    1. Sørlie T, Perou CM, Tibshirani R, Aas T, Geisler S, Johnsen H, et al. Gene expression patterns of breast carcinomas distinguish tumor subclasses with clinical implications. Proc Natl Acad Sci U S A. 2001;98(19):10869–10874. - PMC - PubMed