Review
. 2023 Aug 18;22(1):138.
doi: 10.1186/s12943-023-01827-6.

PI3K/AKT/mTOR signaling transduction pathway and targeted therapies in cancer

Affiliations
Review

PI3K/AKT/mTOR signaling transduction pathway and targeted therapies in cancer

Antonino Glaviano et al. Mol Cancer. .

Abstract

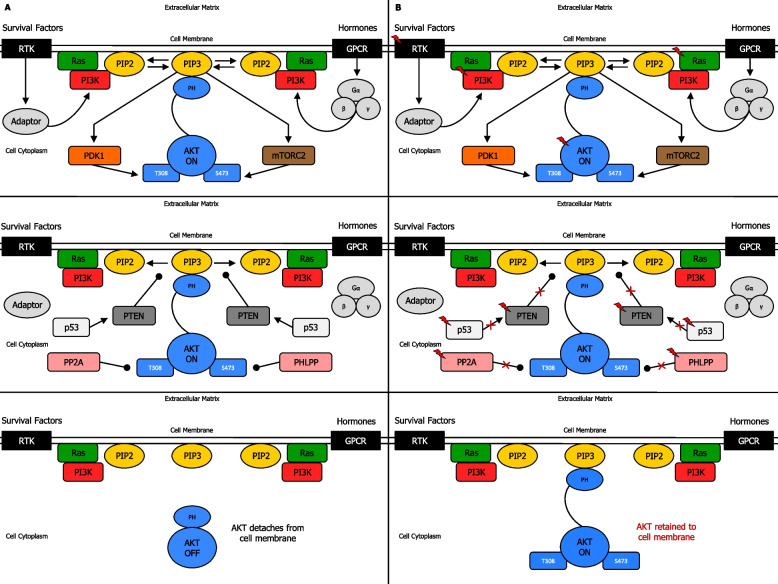
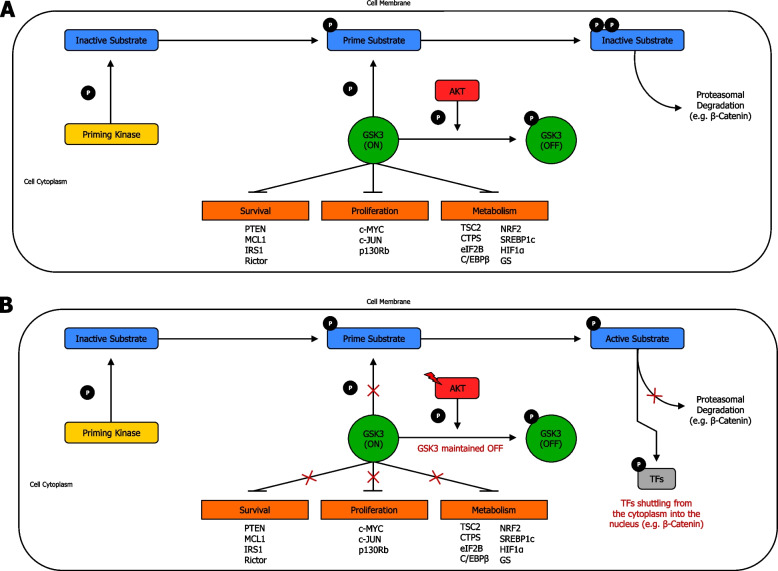
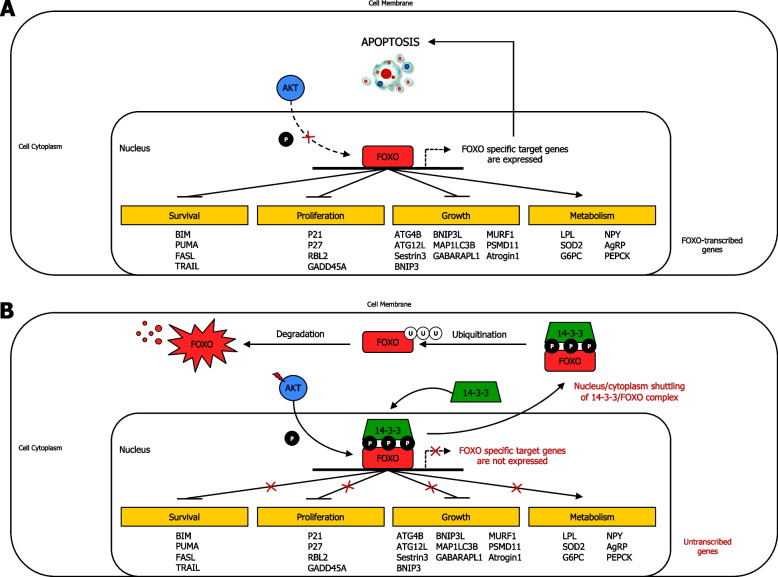
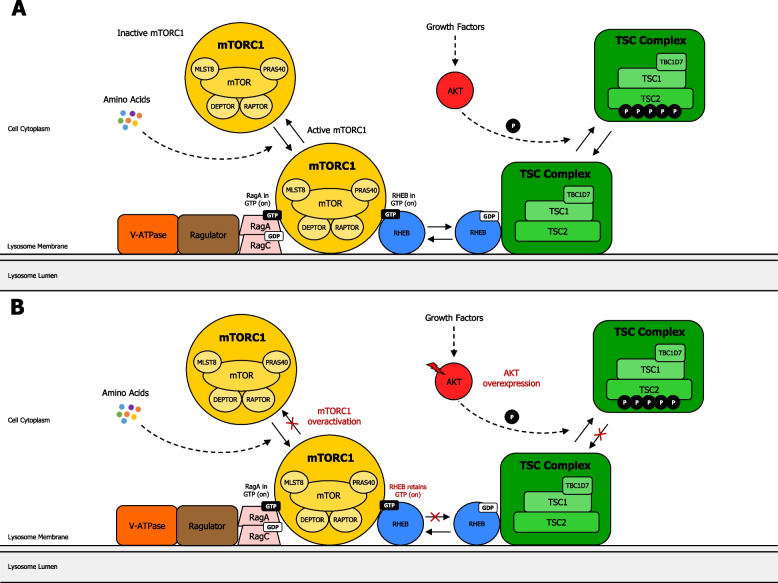
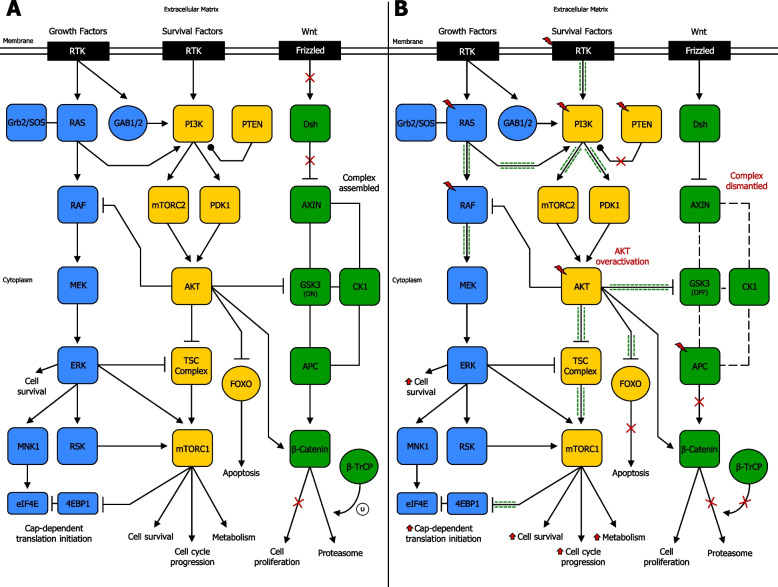
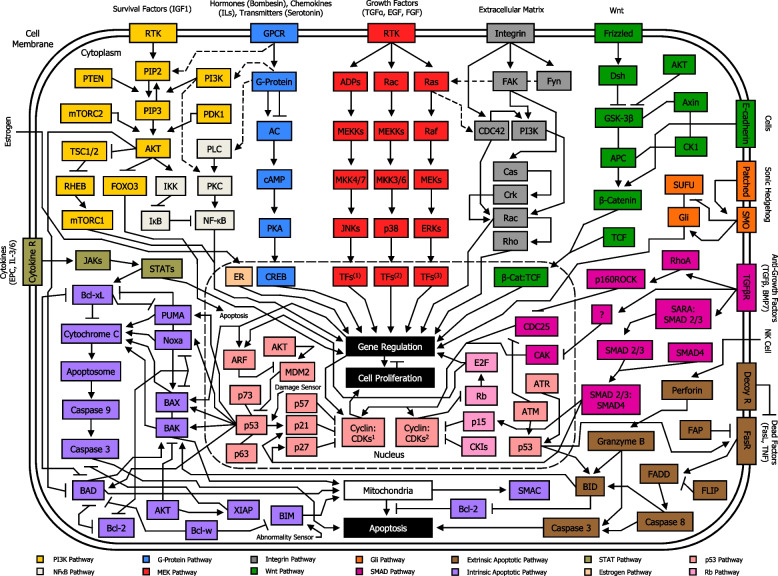
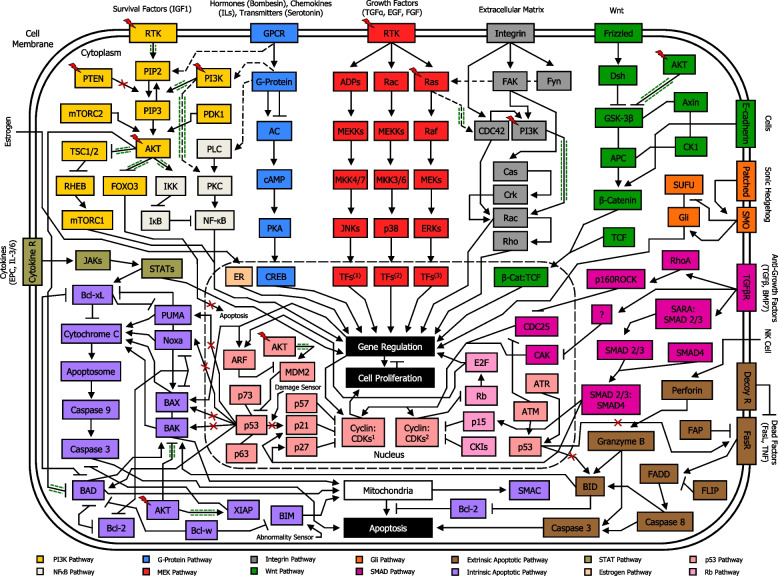
The PI3K/AKT/mTOR (PAM) signaling pathway is a highly conserved signal transduction network in eukaryotic cells that promotes cell survival, cell growth, and cell cycle progression. Growth factor signalling to transcription factors in the PAM axis is highly regulated by multiple cross-interactions with several other signaling pathways, and dysregulation of signal transduction can predispose to cancer development. The PAM axis is the most frequently activated signaling pathway in human cancer and is often implicated in resistance to anticancer therapies. Dysfunction of components of this pathway such as hyperactivity of PI3K, loss of function of PTEN, and gain-of-function of AKT, are notorious drivers of treatment resistance and disease progression in cancer. In this review we highlight the major dysregulations in the PAM signaling pathway in cancer, and discuss the results of PI3K, AKT and mTOR inhibitors as monotherapy and in co-administation with other antineoplastic agents in clinical trials as a strategy for overcoming treatment resistance. Finally, the major mechanisms of resistance to PAM signaling targeted therapies, including PAM signaling in immunology and immunotherapies are also discussed.

Keywords: AKT inhibitors; ATP-competitive mTOR inhibitors; Allosteric mTOR inhibitors; Bi-steric mTOR inhibitors; Cancer; Dual PI3K/mTOR inhibitors; Isoform-specific PI3K inhibitors; PDK1 inhibitors; PI3K/AKT/mTORC pathway; Pan PI3K inhibitors.


Conflict of interest statement

The authors declare no competing interests.

Figures

Fig. 1
Fig. 1
Biochemical mechanism of PI3K, PTEN and AKT regulation. A Mechanism of PI3K, PTEN and AKT regulation in normal cells. Induction of RTK or GPCR results in the activation of Ras-regulated PI3K, which interacts with PIP2, and produces PIP3 at the plasma membrane. Inactive AKT in the cytoplasmic matrix is recruited to cell membrane and binds PIP3 through a PH binding domain. This drives phosphorylation of T308 by PDK1, and phosphorylation of S473 by mTORC2, leading to complete activation of AKT (above). Signal termination is determined by loss of PI3K-PIP2 interaction, via inhibition by (PIP3) PTEN protein phosphatase, (AKT) PP2A protein phosphatase, and (AKT) PHLPP protein phosphatase, leading to AKT detaching from the cell membrane. Due to DNA damage response, p53 activates PTEN, whose function reduces PAM-induced cell proliferation (middle). AKT then shifts to off-mode in the cytoplasm (below). B Mechanism of PI3K, PTEN and AKT regulation in cancer cells. Mutations in RTK, Ras, PI3K, AKT (above), PTEN protein phosphatase, p53, (AKT) PP2A protein phosphatases and (AKT) PHLPP protein phosphatases may occur, resulting in AKT retention to cell membrane (middle). AKT then remains in on-mode in the cytoplasm (below), leading to dysregulation of PAM pathway signal transduction, and possibly cancer onset and/or progression (below). Activation (phosphorylation or non-phosphorylation) is shown with arrowhead lines, whereas dephosphorylation is indicated with roundhead lines. Red lightning symbol shows mutation for a particular gene in the PAM pathway. Red crosses emphasise signaling blockage. P: phosphoryl group
Fig. 2
Fig. 2
AKT signaling network targets and regulates critical cellular substrates. A AKT regulation of targeted proteins in normal cells. AKT phosphorylation of downstream substrates determines regulation of distinct cellular functions. There are several AKT cytoplasmic targets, including BAD, IKKα, FOXO, MDM2, CHK1, p21, p27, GSK-3, and TSC2, representing crucial signaling nodes that interlink AKT signaling with supplementary cellular regulatory circuits. In normal conditions, PAM pathway moderately promotes essential cellular functions such as survival, proliferation, growth and metabolism. B AKT regulation of targeted proteins in cancer cells. Mutations in RTK, Ras, PI3K, PTEN protein phosphatase, AKT, and/or other proto-oncogenes, may occur, resulting in AKT overexpression, leading to enhanced inhibition of BAD, FOXO, CHK1, p21, p27, GSK3, and TSC2, as well as increased activity of IKKα, MDM2, with consequently higher survival, increased proliferation, enhanced growth and boosted metabolism. Activation (phosphorylation or non-phosphorylation) is shown with arrowhead lines, inhibition (phosphorylation or non-phosphorylation) is indicated with blocked lines, and dephosphorylation, carried out by phosphatases, is displayed with roundhead lines. Red lightning symbol shows mutation for a particular gene in the PAM pathway. Red crosses emphasise signaling blockage, whereas green dash-dotted lines (adjacent to arrowhead lines) highlight signaling enhancement. P: phosphoryl group
Fig. 3
Fig. 3
AKT-mediated GSK3 phosphorylation and regulation. A AKT-mediated GSK3 regulation in normal cells. AKT-mediated GSK3 regulation is exerted by AKT phosphorylation on GSK3 amino-terminus, thereby creating an intramolecular pseudo-substrate that occludes the phosphate-binding pocket, and inhibits substrate accessibility to GSK3. When in active (on) form, GSK3 can only recognise and phosphorylate substrates previously phosphorylated by a priming kinase. Conversely, when in inactive (off) form, GSK3 results blocked due to AKT phosphorylation, and thus, its access to primed substrates is denied. Some GSK3 substrates, with their corresponding cellular function are shown. B AKT-mediated GSK3 regulation in cancer cells. Mutations in AKT can enhance phosphorylation, and thus, inactivation of GSK3. Consequently, inactivation or limited amount of active GSK3 can lead to dysregulation of several signal transduction, resulting in cancer onset and/or progression. Reduction or absence of phosphorylation, and thence decreased proteasomal degradation of molecules (e.g. β-catenin) can arise from excessive inhibition of GSK3 by AKT phosphorylation, which can lead to increased survival, enhanced proliferation, and boosted metabolism. Red lightning symbol shows mutation for a particular gene in the PAM pathway. TFs: transcription factors. Phosphorylation is shown with arrowhead lines, whereas inhibition is indicated with blocked lines. Red crosses emphasise signaling blockage. P: phosphoryl group
Fig. 4
Fig. 4
AKT-induced FOXO phosphorylation and regulation. A AKT-induced FOXO phosphorylation and regulation in normal cells. In normal condition, AKT exerts an ordinary moderate FOXO phosphorylation, which allows FOXO to transcribe its target genes. B AKT-induced FOXO phosphorylation and regulation in cancer cells. Mutations upstream AKT and/or AKT, with its consequent overexpression, can increase FOXO phosphorylation by AKT, resulting in binding of 14–3-3 adapter protein to FOXO, and leading to 14–3-3/FOXO complex being shuttled from nucleus to cytoplasm, thereby inhibiting the expression of FOXO gene targets. Therefore, excessive inhibition of FOXO by AKT phosphorylation can ultimately increase survival, enhance proliferation, increase growth, and suppress cell metabolism. Activation (phosphorylation or non-phosphorylation), interactions, and nucleus/cytoplasm shuttling are shown with arrowhead lines, moderate or possible phosphorylation is indicated with dotted-arrowhead lines, and inhibition is displayed with blocked lines. Red lightning symbol shows mutation for a particular gene in the PAM pathway. Red crosses emphasise signaling blockage. P: phosphoryl group. Survival: Cell survival; Proliferation: Cell proliferation; Growth: Cell growth; Metabolism: tissue-specific metabolic changes
Fig. 5
Fig. 5
Regulation of mTORC1 through the TSC complex. A Regulation of mTORC1 through the TSC complex in normal cells. The signal integration model of mTORC1 is regulated by growth factors and amino acids. Rag heterodimer (RagA and RagC) interacts with Ragulator and V-ATPase on the lysosome membrane. Amino acids then allow connection of mTORC1 to Rag heterodimer/Ragulator/V-ATPase complex. The TSC complex maintains Rheb in the GDP-bound state. Growth factor-induced AKT phosphorylates TSC2, leading to dissociation from the lysosomal membrane, promoting Rheb to become GTP loaded, and thus, activating mTORC1. B Regulation of mTORC1 through the TSC complex in cancer cells. Mutations in AKT or upstream genes in the PAM pathway, can potentially lead to overactivation of mTORC1, due to TSC complex being released from Rheb. Consequently, Rheb becomes GTP loaded, resulting in activation of mTORC1, recruited by Rag proteins. This dysregulation may promote the onset and/or progress of cancer, resulting in enhanced cell survival, proliferation, growth, and metabolism in cancer cells. Activation of mTORC1 potentially sends critical signals that engender tumor cells to metastasize and invade new tissues. mTORC1: mechanistic target of rapamycin complex 1; DEPTOR: DEP domain-containing mTOR-interacting protein; MLST8: mammalian lethal with SEC13 protein 8; PRAS40: proline-rich AKT1 substrate 1; RAPTOR: regulatory-associated protein of mTOR; RHEB: Ras homolog enriched in brain; TBC1D7: TBC1 Domain Family Member 7; TSC2: tuberous sclerosis complex 2. Activation (phosphorylation or non-phosphorylation) is shown with arrowhead lines or dotted-arrowhead lines. Red lightning symbol shows mutation for a particular gene in the PAM pathway. Red crosses emphasise signaling blockage. P: phosphoryl group
Fig. 6
Fig. 6
The PAM signaling pathway and its downstream functions. A PAM pathway downstream functions in normal cells. PI3K activation occurs by growth factor-induced receptors or through interaction with scaffolding adaptors, including IRS1/2 proteins. PI3K is then recruited to its substrate PIP2, promoting generation of PIP3. Inactive AKT in the cytoplasmic matrix binds to PIP3 on the cell membrane, allowing phosphorylation by PDK1 and mTORC2, leading to complete activation of AKT, which subsequently phosphorylates several downstream targets, including multiple sites on TSC2, which forms a functional complex with TSC1 (TSC Complex). AKT-induced phosphorylation on TSC2 hampers the ability of TSC Complex to act as a GAP toward the small GTPase Rheb, endorsing Rheb-GTP accumulation. As a result, Rheb-GTP remarkably activates mTORC1, which phosphorylates and activates S6K. In the negative PAM feedback loop, mTORC1 and S6K1 directly phosphorylate IRS1/2, impeding PI3K activation. In addition, mTORC1 blocks GRB10-mediated growth factor-induced receptor signaling to PI3K. Conversely, in the positive PAM feedback loop, AKT phosphorylates IKKα, which indirectly activates transcription factor NF-κB, allowing PTEN phosphatase inhibition. Besides, PRL-3 phosphatase can also inhibit PTEN phosphatase. PAM downstream functions include cell survival, metabolism, anabolism, catabolism, and cell cycle progression. B PAM pathway downstream functions in cancer cells. Mutations in RTK, PI3K, AKT, PTEN, and possibly other genes, may occur. Overactivation of AKT strongly enhances phosphorylation on TSC2, which further hampers the ability of the TSC Complex to act as a GAP toward the small GTPase Rheb, thereby remarkably endorsing Rheb-GTP accumulation. Thus, dysregulation of PAM pathway signal transduction, due to mutations and/or inevitable alterations in the negative feedback loop or positive feedback loop, can possibly lead to cancer onset and/or progression. This results in enhanced PAM downstream functions, such as increased cell survival, boosted metabolism, enhanced anabolism, reduced catabolism, and increased cell cycle progression. Activation (phosphorylation or non-phosphorylation) is shown with arrowhead lines or dotted-arrowhead lines, inhibition (phosphorylation or non-phosphorylation) is indicated with blocked lines, and dephosphorylation is displayed with roundhead lines. Red lightning symbol shows mutation for a particular gene in the PAM pathway. Red crosses emphasise signaling blockage, whereas green dash-dotted lines (adjacent to arrowhead lines or blocked lines) highlight signaling enhancement. Red upper-arrows show increases, whereas blue lower-arrows indicate reduction. Red upper-arrows show increases, whereas blue lower-arrows indicate reduction. P: phosphoryl group
Fig. 7
Fig. 7
Network of signaling cross-regulation between PAM pathway and RAS/ERK pathway or Wnt/GSK3/β-catenin pathway. A Simplified cross-regulation between PAM pathway and RAS/ERK pathway or Wnt/GSK3/β-catenin pathway in normal cells. Numerous cross-talk points occur between PAM pathway and RAS/ERK pathway or Wnt/GSK3/β-catenin pathway, leading to ordinary cell survival and proliferation, cell cycle progression, cell metabolism, apoptosis, and other cellular functions. B Simplified cross-regulation between PAM pathway and RAS/ERK pathway or Wnt/GSK3/β-catenin pathway in cancer cells. Mutations in RTK, RAS, PI3K, PTEN, AKT, APC, and possibly other genes, may occur, resulting in cross-talk dysregulations between PAM pathway and RAS/ERK pathway or Wnt/GSK3/β-catenin pathway. This can lead to enhanced PAM downstream signaling, such as increased cell survival and proliferation, enhanced cell cycle progression, boosted cell metabolism, reduced apoptosis, and dysregulation of other important cellular functions. Activation (phosphorylation or non-phosphorylation) is shown with arrowhead lines, inhibition (phosphorylation or non-phosphorylation) is indicated with blocked lines, interaction is displayed with continuous lines, disassociation is shown with dotted lines, and dephosphorylation, carried out by phosphatases, is indicated with roundhead lines. Red lightning symbol shows mutation for a particular gene in the PAM pathway. Red crosses emphasise signaling blockage, whereas green dash-dotted lines (adjacent to arrowhead lines or blocked lines) highlight signaling enhancement. Red upper-arrows show increases. U: ubiquitination
Fig. 8
Fig. 8
Simplified overview of PAM signaling pathway location among other major signal transduction pathways in the network circuit of a normal cell. Each component of a signaling pathway is termed according to the role it plays with respect to the initial stimulus, such as ligands (e.g. IGF1), receptors (e.g. RTK), and effectors (e.g. PI3K). In normal cells, PAM pathway moderately promotes essential cellular functions such as survival, proliferation, growth and metabolism. Signaling cross-talks between PAM pathway and other pathways play a major role in the ultimate function of the cell. PI3K pathway, NF-κB pathway, G-Protein pathway, MEK pathway, Integrin pathway, Wnt pathway, Gli pathway, SMAD pathway, extrinsic apoptotic pathway, intrinsic apoptotic pathway, STAT pathway, Estrogen pathway, p53 pathway, and Rb pathway are shown. Nuclear membrane is delimited by a long-dashed circular dotted line. Arrowhead lines: activation (phosphorylation or non-phosphorylation). Blocked lines: inhibition (phosphorylation or non-phosphorylation). Continuous lines: interaction. Dotted arrowhead lines: cross-talk activation (phosphorylation or non-phosphorylation) between pathways. Dotted blocked lines: cross-talk inhibition (phosphorylation or non-phosphorylation) between pathways. PI3K: PI3K/Ras complex. MEKs: MEK1/2. ERKs: ERK1/2. TFs1: Transcription factors Jun, ATF2, RNPK, p53, NFAT4, Shc. TFs2: Transcription factors CHOP, ATF2, MNK, MSK, MEF2, Elk-1. TFs3: Transcription factors Elk-1, Ets-2, RSK, MNK, MSK, cPLA2, Fos, Myc. FAK: FAK/Src complex. Fyn: Fyn/Shc complex. Dsh: Dishevelled. Cyclin:CDKs1: Cyclin A:CDK1, Cyclin A:CDK2, Cyclin B:CDK1, Cyclin E:CDK2. Cyclin:CDKs2: Cyclin D:CDK4, Cyclin D:CDK6. CKIs: Cyclin-dependent kinase inhibitors (p16, p18, p19)
Fig. 9
Fig. 9
Simplified overview of PAM signaling pathway location among other major signal transduction pathways in the network circuit of a cancer cell. Each component of a signaling pathway is termed according to the role it plays with respect to the initial stimulus, such as ligands (e.g. IGF1), receptors (e.g. RTK), and effectors (e.g. PI3K). In cancer cells, mutations in RTK, Ras, PI3K, PTEN protein phosphatase, AKT, and/or other proto-oncogenes, may occur, resulting in PAM signaling pathway overexpression. This condition can lead to stronger AKT-induced inhibition of pro-apoptotic proteins such as FOXO, BAD, BAX, BAK, NOXA, PUMA, as well as enhanced activity of anti-apoptotic proteins such as XIAP, and amplified activity of mTORC1, IKKα, PKC, CDC42, Rac, GSKβ, and MDM2, with consequently uncontrolled survival, proliferation, growth and boosted metabolism. Signaling cross-talk between PAM pathway and other pathways play a major role in the dysregulation of functions in a cancer cell. PI3K pathway, NF-κB pathway, G-Protein pathway, MEK pathway, Integrin pathway, Wnt pathway, Gli pathway, SMAD pathway, extrinsic apoptotic pathway, intrinsic apoptotic pathway, STAT pathway, Estrogen pathway, p53 pathway, and Rb pathway are shown. Nuclear membrane is delimited by a long-dashed circular dotted line. Arrowhead lines: activation (phosphorylation or non-phosphorylation). Blocked lines: inhibition (phosphorylation or non-phosphorylation). Continuous lines: interaction. Dotted arrowhead lines: cross-talk activation (phosphorylation or non-phosphorylation) between pathways. Dotted blocked lines: cross-talk inhibition (phosphorylation or non-phosphorylation) between pathways. Red lightning symbol shows mutation for a particular gene in the PAM pathway. Red crosses: signaling blockage. Green dash-dotted lines (adjacent to arrowhead lines or blocked lines or dotted arrowhead lines): signaling enhancement. PI3K: PI3K/Ras complex. MEKs: MEK1/2. ERKs: ERK1/2. TFs1: Transcription factors Jun, ATF2, RNPK, p53, NFAT4, Shc. TFs2: Transcription factors CHOP, ATF2, MNK, MSK, MEF2, Elk-1. TFs3: Transcription factors Elk-1, Ets-2, RSK, MNK, MSK, cPLA2, Fos, Myc. FAK: FAK/Src complex. Fyn: Fyn/Shc complex. Dsh: Dishevelled. Cyclin:CDKs1: Cyclin A:CDK1, Cyclin A:CDK2, Cyclin B:CDK1, Cyclin E:CDK2. Cyclin:CDKs2: Cyclin D:CDK4, Cyclin D:CDK6. CKIs: Cyclin-dependent kinase inhibitors (p16, p18, p19)
Fig. 10
Fig. 10
PI3K-, AKT-, mTOR- and PDK1-targeted inhibitors along the PAM pathway in cancer cells. PI3K inhibitors are divided into Pan-PI3K inhibitors (Pan-PI3Ki), Dual PI3K/mTOR inhibitors (Dual PI3K/mTORi), and Isoform-Specific PI3K inhibitors (IS PI3Ki), named Isoform-Specific PI3Kα inhibitors (IS PI3Kαi), Isoform-Specific PI3Kβ inhibitors (IS PI3Kβi), Isoform-Specific PI3Kγ inhibitors (IS PI3Kγi), and Isoform-Specific PI3Kδ inhibitors (IS PI3Kδi). Overall AKT inhibitors are referred as AKTi. mTOR inhibitors are divided into allosteric (non-competitive) mTOR inhibitors (A-NC mTORi), ATP-competitive mTOR inhibitors (ATP-C mTORi), and Bi-Steric mTOR inhibitors (Bi-Steric mTORi). PDK1 inhibitors are referred as PDK1i. Substrate activation (phosphorylation) along the PAM pathway is shown with arrowhead lines. Substrate inhibition along the PAM pathway, exerted by Pan-PI3Ki, Dual PI3K/mTORi, IS PI3Kαi, IS PI3Kβi, IS PI3Kγi, IS PI3Kδi, AKTi, A-NC mTORi, ATP-C mTORi, Bi-Steric mTORi, and PDK1i, is shown with blocked lines. Ⓐ: FDA-approved inhibitor

References

    1. Manning BD, Cantley LC. AKT/PKB signaling: navigating downstream. Cell. 2007;129(7):1261–1274. - PMC - PubMed
    1. Tian LY, Smit DJ, Jücker M. The Role of PI3K/AKT/mTOR Signaling in Hepatocellular Carcinoma Metabolism. Int J Mol Sci. 2023;24(3):2652. - PMC - PubMed
    1. Ahmad I, Hoque M, Alam SSM, Zughaibi TA, Tabrez S. Curcumin and Plumbagin Synergistically Target the PI3K/Akt/mTOR Pathway: A Prospective Role in Cancer Treatment. Int J Mol Sci. 2023;24(7):6651. - PMC - PubMed
    1. Janku F, Yap TA, Meric-Bernstam F. Targeting the PI3K pathway in cancer: are we making headway? Nat Rev Clin Oncol. 2018;15(5):273–291. - PubMed
    1. Mohan CD, Srinivasa V, Rangappa S, Mervin L, Mohan S, Paricharak S, et al. Trisubstituted-Imidazoles Induce Apoptosis in Human Breast Cancer Cells by Targeting the Oncogenic PI3K/Akt/mTOR Signaling Pathway. PLoS ONE. 2016;11(4):e0153155. - PMC - PubMed

Publication types

Substances