. 2023 Aug 18;21(1):555.
doi: 10.1186/s12967-023-04225-0.

Targeting FSCN1 with an oral small-molecule inhibitor for treating ocular neovascularization

Affiliations

Targeting FSCN1 with an oral small-molecule inhibitor for treating ocular neovascularization

Wen Bai et al. J Transl Med. .

Abstract

Background: Ocular neovascularization is a leading cause of blindness and visual impairment. While intravitreal anti-VEGF agents can be effective, they do have several drawbacks, such as endophthalmitis and drug resistance. Additional studies are necessary to explore alternative therapeutic targets.

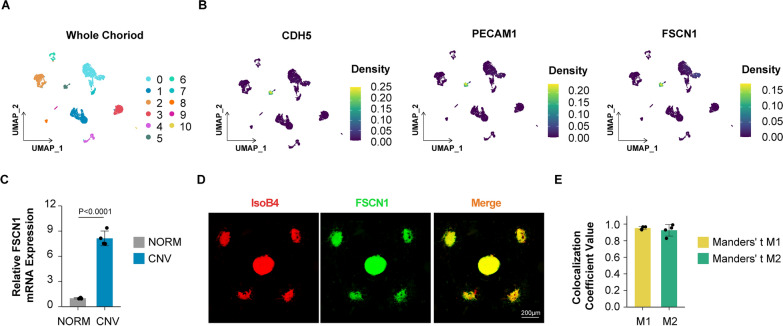
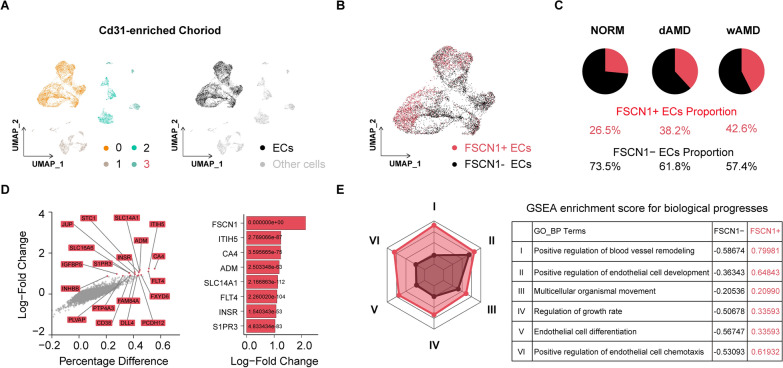
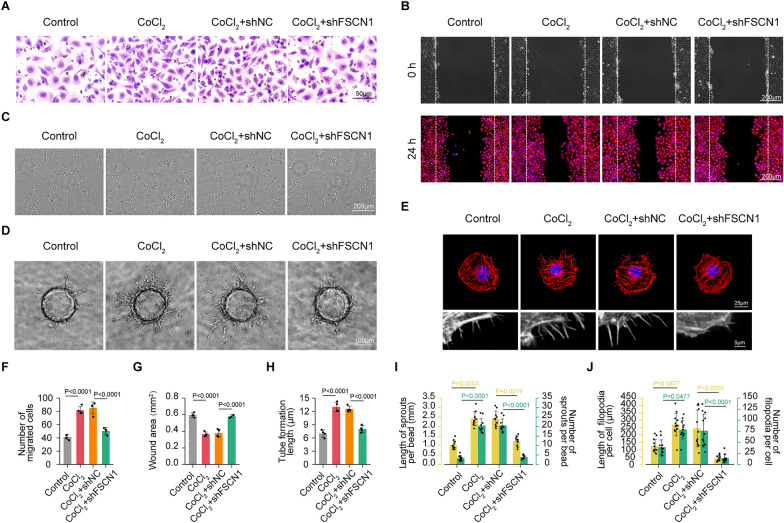
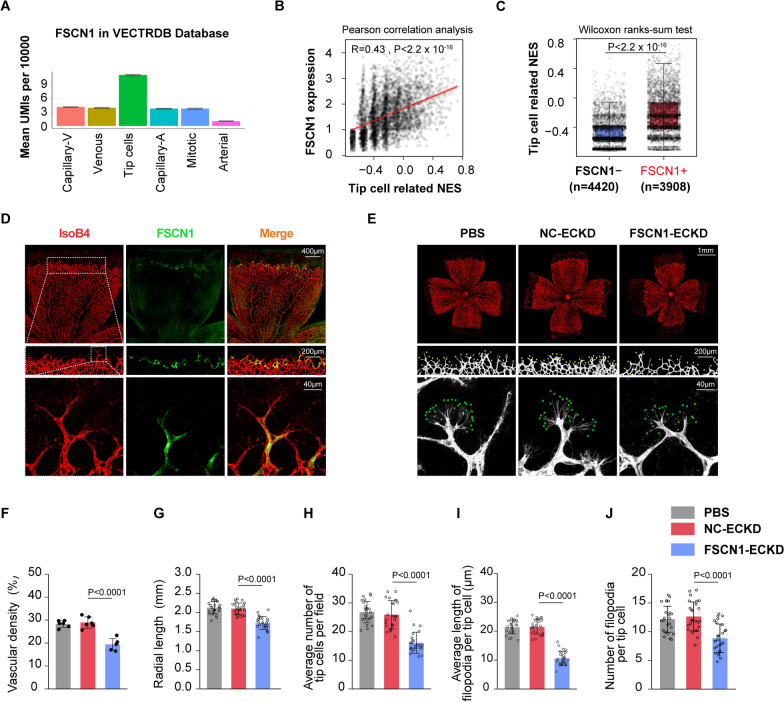
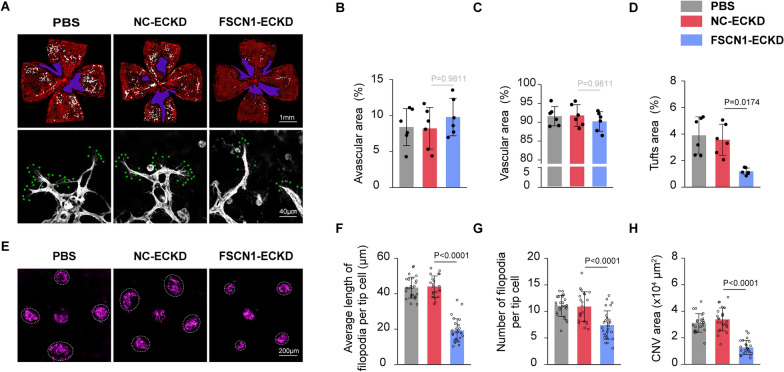
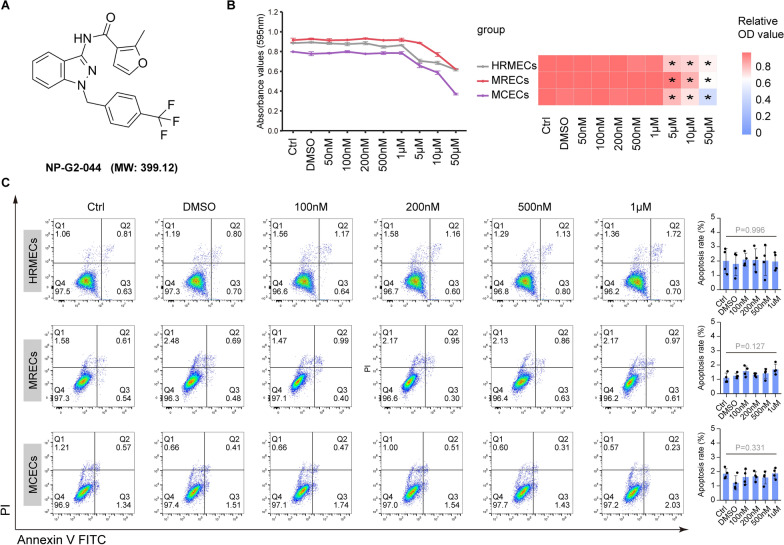
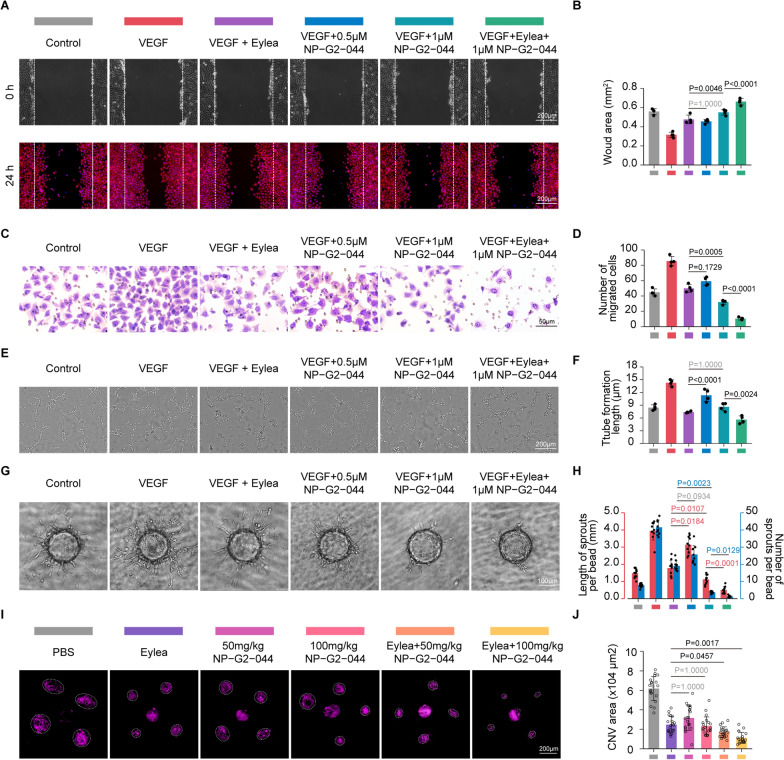
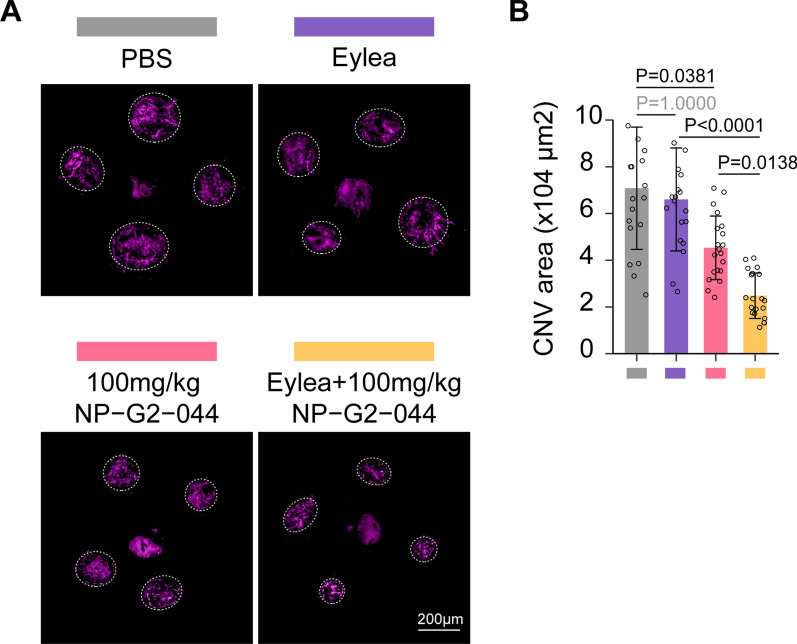
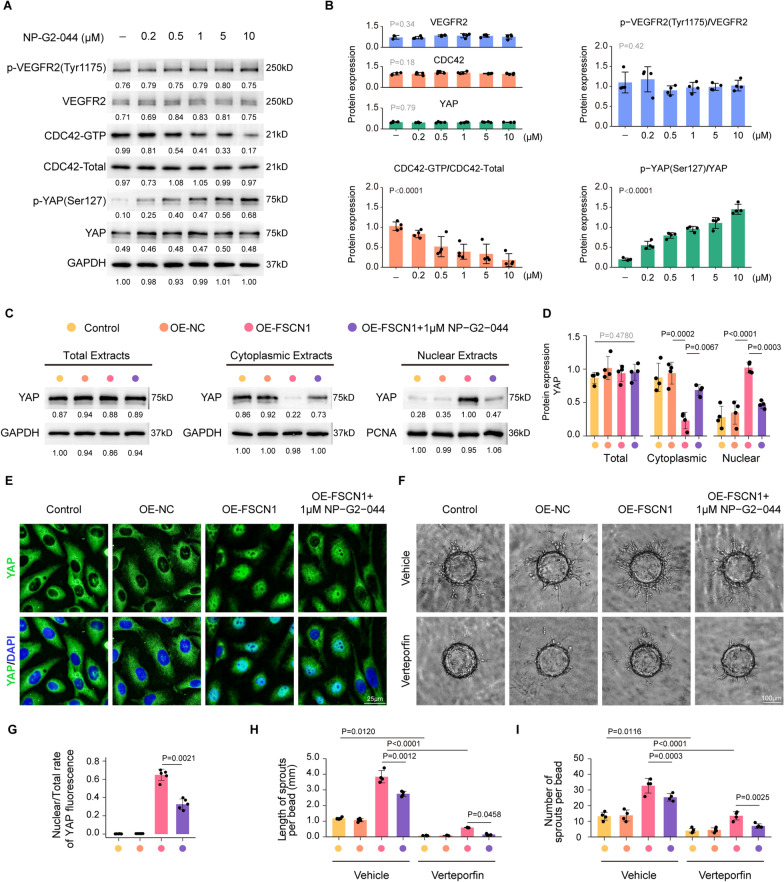
Methods: Bioinformatics analysis and quantitative RT-PCR were used to detect and verify the FSCN1 expression levels in oxygen-induced retinopathy (OIR) and laser-induced choroidal neovascularization (CNV) mice model. Transwell, wound scratching, tube formation, three-dimensional bead sprouting assay, rhodamine-phalloidin staining, Isolectin B4 staining and immunofluorescent staining were conducted to detect the role of FSCN1 and its oral inhibitor NP-G2-044 in vivo and vitro. HPLC-MS/MS analysis, cell apoptosis assay, MTT assay, H&E and tunnel staining, visual electrophysiology testing, visual cliff test and light/dark transition test were conducted to assess the pharmacokinetic and security of NP-G2-044 in vivo and vitro. Co-Immunoprecipitation, qRT-PCR and western blot were conducted to reveal the mechanism of FSCN1 and NP-G2-044 mediated pathological ocular neovascularization.

Results: We discovered that Fascin homologue 1 (FSCN1) is vital for angiogenesis both in vitro and in vivo, and that it is highly expressed in oxygen-induced retinopathy (OIR) and laser-induced choroidal neovascularization (CNV). We found that NP-G2-044, a small-molecule inhibitor of FSCN1 with oral activity, can impede the sprouting, migration, and filopodia formation of cultured endothelial cells. Oral NP-G2-044 can effectively and safely curb the development of OIR and CNV, and increase efficacy while overcoming anti-VEGF resistance in combination with intravitreal aflibercept (Eylea) injection.

Conclusion: Collectively, FSCN1 inhibition could serve as a promising therapeutic approach to block ocular neovascularization.

Keywords: Angiogenesis; FSCN1; NP-G2-044; Ocular pathologies; Vascular tip cell.


Conflict of interest statement

The authors declare that they have no conflict of interest.

Figures

Fig. 1
Fig. 1
FSCN1 is highly expressed and colocalized in pathological retinal neovascularization A Clustering is performed using resolution = 0.2 and visualized using UMAP algorithm in the publicly available scRNA-seq data (GEO: #GSE150703) of OIR mice through the Seruat package. B Cross validation of the identified EC marker genes (CDH5 and PECAM1) and FSCN1 in the publicly available scRNA-seq data (GEO: #GSE150703) of OIR mice by density plot through the Nebulosa package. The right side of the plot shows the scale of expression density. C Violin and scatter plots show the expression of FSCN1 from NORM_P14, OIR_P14, NORM_P17 and OIR_P17 groups in the publicly available scRNA-seq data (GEO: #GSE150703) of OIR mice. Each dot indicates an endothelial cell. Results are presented as mean ± SEM, statistical analyses were performed using Kruskal–Wallis with Bonferroni's post hoc test. **P = 0.0029 (OIR_P14 vs NORM_P14); ***P < 0.0001 (OIR_P17 vs NORM_P17). D Quantitative reverse‐transcription polymerase chain reactions (qRT–PCRs) are performed to detect FSCN1 levels in the retinal ECs of OIR mice at P12, P13, P15, P17, P19 and P21. Results are presented as mean ± SEM, statistical analyses were performed using One-way ANOVA with Bonferroni's post hoc test. (n = 4 mice per group for each time point tested, data pooled from 4 independent experiments). E, F Colocalization of FSCN1 and pathological retinal neovascularization (IsoB4: red; FSCN1: green). Scale bar:1 mm. Quantification of Manders' coefficient (right panel). Results are presented as mean ± SEM. (n = 4 independent experiments). (M1: red pixels overlapping green pixels, M2: green pixels overlapping red pixels)
Fig. 2
Fig. 2
FSCN1 is highly expressed and colocalized in pathological choroidal neovascularization A Clustering is performed using resolution = 0.1 and visualized using UMAP algorithm from the publicly available scRNA-seq data of AMD patients (GEO: #GSE135922) through the Seruat package. B Cross validation of the identified EC marker genes (CDH5 and PECAM1) and FSCN1 from the publicly available scRNA-seq data (GEO: #GSE135922) of AMD patients by density plot through the Nebulosa package. The right side of the plot shows the scale of expression density. C Quantitative reverse‐transcription polymerase chain reactions (qRT–PCRs) were performed to detect FSCN1 levels in primary choroidal endothelial cells of mice at 7 days after laser-induced choroidal neovascularization (CNV). Results are presented as mean ± SEM, statistical analyses were performed using two-tailed student's t-test. (n = 4 mice per group, data pooled from 4 independent experiments). D, E Colocalization of FSCN1 and pathological choroidal neovascularization (IsoB4: red; FSCN1: green). Scale bar: 200 μm. Quantification of Manders' coefficient (right panel). Results are presented as mean ± SEM. (n = 4 independent experiments). (M1: red pixels overlapping green pixels, M2: green pixels overlapping red pixels)
Fig. 3
Fig. 3
Functional annotations for differentially expressed genes (DEGs) between FSCN1 + ECs and FSCN1- ECs. A Clustering is performed in the left panel using resolution = 0.1 and visualized using UMAP algorithm from the publicly CD31-enriched scRNA-seq data of AMD patients (GEO: #GSE135922) through the Seruat package. The endothelial cells (cluster 0) are labeled (black dots) on the UMAP plot in the left panel. B FSCN1 + ECs (red dots) and FSCN1- ECs (black dots) are shown on the UMAP plot. C Proportional distribution of FSCN1 + ECs (red sector) and FSCN1- ECs (black sector) in wAMD, dAMD, NORM donors is represented by pie charts. D DEGs are displayed by using the log-fold change expression and the difference in the percentage of cells expressing the gene comparing FSCN1 + ECs versus FSCN1- ECs (Percentage Difference). In its left panel, genes labeled are top 20 genes sorted by log-fold change. In its right panel, the top 8 genes are displayed with adjusted P-value < 0.05.E The normalized enrichment scores (NES) of angiogenesis related biological progresses (BP) through GSEA analysis are calculated. In its left panel, Radar chart of NES is plotted in the FSCN1 + ECs (red area) versus FSCN1- ECs (black area). In its right panel, detailed NES values are displayed
Fig. 4
Fig. 4
FSCN1 shRNA could reverse the upregulation of tube formation, migration and sprouting capabilities of HRMECs under hypoxia. HRMECs were transfected with non-specific sequences shRNA (shNC), FSCN1 shRNA, or left untreated and then exposed to CoCl2 (200 μmol/L) for 24 h. The group without any treatment is taken as the control group. A Transwell assays of HRMECs under hypoxia factors (CoCl2) stimulation or simultaneously transfected with shFSCN1. Scale bar: 50 µm. (n = 4 per group, data pooled from 4 independent experiments). B Wound scratching assays of HRMECs under hypoxia factors (CoCl2) stimulation or simultaneously transfected with shFSCN1. Scale bar: 200 µm. [rhodamine-conjugated phalloidin: red (to visualize the actin cytoskeleton); DAPI: blue (to visualize nuclei)]. (n = 4 per group, data pooled from 4 independent experiments). C Tube formation Assay of HRMECs under hypoxia factors (CoCl2) stimulation or simultaneously transfected with shFSCN1. Scale bar: 200 µm. (n = 4 per group, data pooled from 4 independent experiments). D Three-dimensional (3D) Bead Sprouting Assay reveals the in vitro sprouting capabilities of HRMECs under hypoxia factors (CoCl2) stimulation or simultaneously transfected with shFSCN1. Scale bar: 100 µm. (n = 10 per group, data pooled from 4 independent experiments). E Rhodamine-phalloidin staining (top panels) reveals the actin cytoskeleton and filopodia of HRMECs under hypoxia factors (CoCl2) stimulation or simultaneously transfected with shFSCN1 (rhodamine-conjugated phalloidin: red; DAPI: blue). Scale bar: 25 µm. The down panels represent a partial magnification to see filamentous pseudopodia in more detail. (n = 12 per group, data pooled from 4 independent experiments). F Quantification of migrated cells. Results are presented as mean ± SEM, statistical analyses were performed using One-way ANOVA with Bonferroni's post hoc test. (n = 4 per group, data pooled from 4 independent experiments). G Quantification of wound area. The top panels represent the initial state of the wound area at 0 h, and the down panels represent the area after a period of 24 h of hypoxic migration. Results are presented as mean ± SEM, statistical analyses were performed using One-way ANOVA with Bonferroni's post hoc test. (n = 4 per group, data pooled from 4 independent experiments). H Quantification of Tube formation length. Results are presented as mean ± SEM, statistical analyses were performed using One-way ANOVA with Bonferroni's post hoc test. (n = 4 per group, data pooled from 4 independent experiments). I Quantification of length and number of sprouts per bead. Results are presented as mean ± SEM, statistical analyses were performed using Kruskal–Wallis with Bonferroni's post hoc test. (n = 10 per group, data pooled from 4 independent experiments). J Quantification of length and number of filopodia per cell. Results are presented as mean ± SEM, statistical analyses were performed using Kruskal–Wallis with Bonferroni's post hoc test. (n = 12 per group, data pooled from 4 independent experiments)
Fig. 5
Fig. 5
FSCN1 was located in the anterior end of the retinal vascular, and knockdown of FSCN1 could regulates tip cells behaviors in vivo. A The histogram of FSCN1 expression level in distinct endothelial subsets is downloaded from the Vascular Endothelial Cell Trans-omics Resource Database (VECTRDB) (https://markfsabbagh.shinyapps.io/vectrdb/).B A scatter plot correlation analysis is performed using Pearson correlation test to test the association between FSCN1 expression and tip cell-related normalized enrichment scores (NES). The scatter plot's correlation R-value and P-value is label on the top right. (n = 8,328 cells). C Tip cell-related normalized enrichment scores (NES) are compared between FSCN1 + ECs and FSCN1- ECs. Results are presented as mean ± SEM, statistical analyses were performed using Wilcoxon ranks-sun test. (FSCN1 + ECs, n = 3,908 cells vs FSCN1- ECs, n = 4,420 cells). D Colocalization of FSCN1 and the anterior end of the retinal vascular (IsoB4: red; FSCN1: green). Scale bar: 40 μm. (n = 4 independent experiments). E The vitreous body of C57BL/6 J mice pups are injected with PBS, AAVsig-TIE-FSCN1 shRNA (“FSCN1-ECKD”) or AAVsig-TIE-NC shRNA (“NC-ECKD”) at P1, and collected retinas five days after injection. The group injected PBS is taken as the control group. Retinal flat is stained with IsoB4, and red areas highlighted vascular tufts. Top panels represent the vascular radial length and density of developing retinas (Scale bar: 1 mm). (n = 6 mice per group); Middle and down panels represent the number of tip cells (yellow arrow) (Scale bar:200 μm) at the vascular front of developing retinas (n = 24 fields from 6 mice per group), the number and length of filopodia (green asterisk) (Scale bar: 40 μm) respectively. (n = 12 fields from 6 mice per group). F Quantification of the density of developing retinal vascular. Results are presented as mean ± SEM, statistical analyses were performed using One-way ANOVA with Bonferroni's post hoc test. (n = 6 mice per group). G Quantification of the length of developing retinal vascular radial. Results are presented as mean ± SEM, statistical analyses were performed using One-way ANOVA with Bonferroni's post hoc test. (n = 24 directions from 6 mice per group). H Quantification of the average number of tip cells per field. Results are presented as mean ± SEM, statistical analyses were performed using One-way ANOVA with Bonferroni's post hoc test. (n = 24 fields from 6 mice per group). I Quantification of the average length of filopodia per tip cell. Results are presented as mean ± SEM, statistical analyses were performed using Kruskal–Wallis with Bonferroni's post hoc test. (n = 12 fields from 6 mice per group). J Quantification of the number of filopodia per tip cell. Results are presented as mean ± SEM, statistical analyses were performed using One-way ANOVA with Bonferroni's post hoc test. (n = 12 fields from 6 mice per group)
Fig. 6
Fig. 6
Knockdown of FSCN1 could represses pathological ocular neovascularization in vivo A The vitreous body of oxygen-induced retinopathy (OIR) C57BL/6 J mice were injected with PBS, AAVsig-TIE-FSCN1 shRNA (“FSCN1-ECKD”) or AAVsig-TIE-NC shRNA (“NC-ECKD”) at P12, and removed retinas five days after injection (P17). The group injected PBS is taken as the control group. Top panels: [Retinal flat are stained with IsoB4.The blue regions represent central avascular areas and the white regions highlight neovascular tuft area. (Scale bar:1 mm). (n = 6 mice per group)]; [Down panels represent the number and length of filopodia (green asterisk) (Scale bar:40 μm) at the leading edge of retinal vascularization. (n = 12 fields from 6 mice per group)]. B Quantification of central avascular area in P17 OIR. Results are presented as mean ± SEM, statistical analyses were performed using One-way ANOVA with Bonferroni's post hoc test. (n = 6 mice per group). C Quantification of peripheral vascular area in P17 OIR. Results are presented as mean ± SEM, statistical analyses were performed using One-way ANOVA with Bonferroni's post hoc test. (n = 6 mice per group). D Quantification of neovascular tuft area in P17 OIR. Results are presented as mean ± SEM, statistical analyses were performed using Kruskal–Wallis with Bonferroni's post hoc test. (n = 6 mice per group). E Choroidal flat mounts of 4-week-old mice subjected one week prior to laser-CNV injected with PBS, AAVsig-TIE-FSCN1 shRNA (“FSCN1-ECKD”) or AAVsig-TIE-NC shRNA (“NC-ECKD”) stained with IsoB4 (purple). Scale bar, 200 μm. (n = 6 mice per group). F Quantification of the average length of filopodia per tip cell. Results are presented as mean ± SEM, statistical analyses were performed using One-way ANOVA with Bonferroni's post hoc test. (n = 12 fields from 6 mice per group). G Quantification of the number of filopodia per tip cell. Results are presented as mean ± SEM, statistical analyses were performed using One-way ANOVA with Bonferroni's post hoc test. (n = 12 fields from 6 mice per group). H Quantification of CNV surface area. Results are presented as mean ± SEM, statistical analyses were performed using One-way ANOVA with Bonferroni's post hoc test. (n = 24 laser dots from 6 mice per group)
Fig. 7
Fig. 7
FSCN1 inhibitor (NP-G2-044) with the range of 0.05-1 μmol /L was nontoxic to critical ocular cells. After 48 h of treatment with different concentrations of NP-G2-044, the cells were examined for apoptosis. A The chemical structure and molecular formula of the NP-G2-044 is provided from PubChem database. B Cytotoxicity of different concentrations (50 nM-50 μM) of NP-G2-044 measured by MTT assay on different cell lines. MTT activity of different cell lines is read at OD 595 nm and indicated by the line chart (left panel). The OD values are corrected by the control group and indicated by the heatmap (right panel), (asterisk indicate that the concentration is statistically significant compared with Ctrl group), (n = 3 per group, data pooled from 3 independent experiments). C Flow cytometry assay for cell apoptosis in endothelial cell lines (HRMEC, MREC, MCEC). Both early-apoptotic (AV + and PI –) and late-apoptotic (AV + and PI –) cells were included in the analyses. Quantification of the rate of apoptosis. Results are presented as mean ± SEM, statistical analyses were performed using One-way ANOVA. (n = 4 per group, data pooled from 4 independent experiments)
Fig. 8
Fig. 8
The toxicity, visual function and pharmacokinetics studies of NP-G2-044 in vivo after oral administration. A, B The ocular concentration of NP-G2-044 in the retinal and choroidal tissues at the different time points (~ 0 h, 0.5 h, 2 h, 4 h, 6 h, 12 h, 24 h and 48 h) analyzed by HPLC–MS/MS to identify the preclinical pharmacokinetic study following a single-dose oral administration (100 mg/kg) to mice. T1/2: half-life. C Quantification of the weight of mice at different time points after long-term oral administration (2 times daily for 30 days in the dose of 50 mg/kg or 100 mg/kg). (n = 4 per group, data pooled from 3 independent experiments). D H&E staining shows the morphology of retinal and choroidal to mice after different treatments with PBS,1%DMSO, 50 mg/kg NP-G2-044 or 100 mg/kg NP-G2-044 oral administration twice daily for 30 days. Oral administration of PBS is considered as the control group. (Scale bar: 80 μm). (n = 4 per group, data pooled from 4 independent experiments). E Dark-adapted Electroretinography (ERG) assessed retinal function after long-term oral administration. [a-wave (derived from photoreceptors) reflects outer retinal function, while the b-wave (derived from müller and bipolar cells) reflects inner retinal function.]. (n = 3 per group, data pooled from 3 independent experiments). F TUNEL staining assays evaluate the apoptosis of cells in the retina and choroid after long-term oral administration. (Scale bar: 80 μm). (n = 4 per group, data pooled from 4 independent experiments). G Quantification of the amplitude of a − wave (µm) and b − wave (µm) in ERG. Results are presented as mean ± SEM, statistical analyses were performed using One-way ANOVA. (n = 3 per group, data pooled from 3 independent experiments). H The light/dark transition test assesses visual sensitivity in the mice after long-term oral administration. Schematic diagram of the visual cliff tests (left panel). Quantification of the percentage of time in dark compartment (right panel). Results are presented as mean ± SEM, statistical analyses were performed using One-way ANOVA. (n = 4 independent experiments). (n = 10 per group, data pooled from 3 independent experiments). I The visual cliff test assesses visual depth perception in the mice after long-term oral administration. Schematic diagram of the visual cliff tests (left panel). Quantification of the percentage of choosing the shallow side (right panel). Results are presented as mean ± SEM, statistical analyses were performed using Fisher’s exact test. (n = 4 independent experiments). (n = 10 per group, data pooled from 3 independent experiments)
Fig. 9
Fig. 9
NP-G2-044 could attenuate pathological ocular neovascularization and increases the efficacy of anti-VEGF therapy in vivo and in vitro. HRMECs are added in VEGF, VEGF + Eylea, VEGF + 0.5 μM NP − G2 − 044, VEGF + 1 μM NP − G2 − 044, VEGF + Eylea + 1 μM NP − G2 − 044 or left untreated. The group without any treatment is taken as the control group. A Wound scratching assays of HRMECs under different treatments. Scale bar: 200 µm. [ rhodamine-conjugated phalloidin: red (to visualize the actin cytoskeleton); DAPI: blue (to visualize nuclei)]. (n = 4 per group, data pooled from 4 independent experiments). B Quantification of wound area. The top panels represent the initial state of the wound area at 0 h, and the down panels represent the area after a period of 24 h of hypoxic migration. Results are presented as mean ± SEM, statistical analyses were performed using One-way ANOVA with Bonferroni's post hoc test. (n = 4 per group, data pooled from 4 independent experiments). C Transwell assays of HRMECs under different treatments. Scale bar: 50 µm. (n = 4 per group, data pooled from 4 independent experiments). D Quantification of migrated cells. Results are presented as mean ± SEM, statistical analyses were performed using One-way ANOVA with Bonferroni's post hoc test. (n = 4 per group, data pooled from 4 independent experiments). E Tube formation Assay of HRMECs under different treatments. Scale bar: 200 µm. (n = 4 per group, data pooled from 4 independent experiments). F Quantification of tube formation length. Results are presented as mean ± SEM, statistical analyses were performed using One-way ANOVA with Bonferroni's post hoc test. (n = 4 per group, data pooled from 4 independent experiments). G Three-dimensional (3D) Bead Sprouting Assay reveals the in vitro sprouting capabilities of HRMECs under different treatments. Scale bar: 100 µm. (n = 10 per group, data pooled from 4 independent experiments). H Quantification of length and number of sprouts per bead. Results are presented as mean ± SEM, statistical analyses were performed using Kruskal–Wallis with Bonferroni's post hoc test. (n = 10 per group, data pooled from 4 independent experiments). I Choroidal flat mounts of 4-week-old mice subjected one week prior to laser-CNV injected with PBS or Eylea whether added different concentrations of NP − G2 − 044 or not stained with IsoB4 (purple). The vitreous body of all mice (except group injected with Eylea) are injected with PBS and the group injected with only PBS is taken as the control group. Scale bar, 200 μm. (n = 20 laser dots from 5 mice per group). J Quantification of CNV surface area. Results are presented as mean ± SEM, statistical analyses were performed using One-way ANOVA with Bonferroni's post hoc test. (n = 20 laser dots from 5 mice per group). (n = 20 laser dots from 5 mice per group)
Fig. 10
Fig. 10
NP-G2-044 combined with anti-VEGF drugs could improve anti-VEGF resistance. A Choroidal flatmounts of old CNV mice (around 12-months-old) treated with Eylea, 100 mg/kg NP − G2 − 044 or Eylea + 100 mg/kg NP − G2 − 044 were stained with IsoB4 (purple). The vitreous body of all mice (except group injected with Eylea) are injected with PBS and the group injected with only PBS is taken as the control group. Scale bar, 200 μm. (n = 20 laser dots from 5 mice per group). B Quantification of CNV surface area. Results are presented as mean ± SEM, statistical analyses were performed using One-way ANOVA with Bonferroni's post hoc test. (n = 20 laser dots from 5 mice per group)
Fig. 11
Fig. 11
NP-G2-044 inhibited FSCN1 binding to F-actin, resulting in reduced nuclear entry of YAP and inhibited CDC42 GTP activity. A Western blotting assays test the protein expression of p-VEGFR2(Tyr1175), VEGFR2, CDC42-GTP, CDC42-Total, p − YAP(Ser127), YAP and GAPDH in HRMECs after treatment with VEGF-A (20 ng/ml) for 5 min and different concentrations of NP − G2 − 044. (n = 4 independent experiments). B Densitometric quantitation of Western blot band intensity shown in A. Results are presented as mean ± SEM, statistical analyses were performed using One-way ANOVA. (n = 4 independent experiments). C HRMECs were transfected with OE-NC, OE-FSCN1, OE-FSCN1 added with 1 μM NP − G2 − 044 or left untreated for 24 h. The group without any treatment is taken as the control group (D, F). Total, cytoplasmic, nuclear extracts from the resulting cells are analyzed by WB for YAP expression. (n = 4 independent experiments). D Densitometric quantitation of Western blot band intensity shown in C. Results are presented as mean ± SEM, statistical analyses were performed using One-way ANOVA with Bonferroni's post hoc test. (n = 4 independent experiments). E Localization of YAP is demonstrated by immunofluorescence. Scale bar, 50 μm. (n = 5 per group, data pooled from 5 independent experiments). F HRMECs were transfected with OE-NC, OE-FSCN1, OE-FSCN1 added with 1 μM NP − G2 − 044 or left untreated in the presence or absence of 5 μM verteporfin for 24 h, DMSO as a vehicle control. Three-dimensional (3D) Bead Sprouting Assay reveals the in vitro sprouting capabilities of HRMECs under different treatments. Scale bar: 100 µm. (n = 4 per group, data pooled from 4 independent experiments). G Quantification of the rate of Nuclear/Total YAP fluorescence. Results are presented as mean ± SEM, statistical analyses were performed using Kruskal–Wallis with Bonferroni's post hoc test. (n = 5 per group, data pooled from 5 independent experiments). H, I Quantification of length and number of sprouts per bead. Results are presented as mean ± SEM, statistical analyses were performed using One-way ANOVA with Bonferroni's post hoc test. (n = 4 per group, data pooled from 4 independent experiments)

Similar articles

Cited by

References

    1. Lee P, Wang CC, Adamis AP. Ocular neovascularization: an epidemiologic review. Surv Ophthalmol. 1998;43:245–269. doi: 10.1016/S0039-6257(98)00035-6. - DOI - PubMed
    1. Miller JW, Le Couter J, Strauss EC, Ferrara N. Vascular endothelial growth factor a in intraocular vascular disease. Ophthalmology. 2013;120:106–114. doi: 10.1016/j.ophtha.2012.07.038. - DOI - PubMed
    1. Rubio RG, Adamis AP. Ocular angiogenesis: vascular endothelial growth factor and other factors. Dev Ophthalmol. 2016;55:28–37. doi: 10.1159/000431129. - DOI - PubMed
    1. Li Y, Busoy JM, Zaman BAA, Tan QSW, Tan GSW, Barathi VA, Cheung N, Wei JJ, Hunziker W, Hong W, et al. A novel model of persistent retinal neovascularization for the development of sustained anti-VEGF therapies. Exp Eye Res. 2018;174:98–106. doi: 10.1016/j.exer.2018.05.027. - DOI - PubMed
    1. Falavarjani KG, Sadda SR. Hot topics in pharmacotherapy for neovascular age-related macular degeneration. Curr Pharm Des. 2017;23:535–541. doi: 10.2174/1381612822666161216121105. - DOI - PubMed

Publication types