. 2024 May;168(5):855-867.
doi: 10.1111/jnc.15923. Epub 2023 Aug 18.

Ketamine improves neuronal recovery following spreading depolarization in peri-infarct tissues

Affiliations

Ketamine improves neuronal recovery following spreading depolarization in peri-infarct tissues

Katelyn M Reinhart et al. J Neurochem. 2024 May.

Abstract

Spreading depolarization (SD) has emerged as an important contributor to the enlargement of acute brain injuries. We previously showed that the N-methyl-D-aspartate receptor antagonist ketamine was able to prevent deleterious consequences of SD in brain slices, under conditions of metabolic compromise. The current study aimed to extend these observations into an in vivo stroke model, to test whether gradients of metabolic capacity lead to differential accumulation of calcium (Ca2+) following SD. In addition, we tested whether ketamine protects vulnerable tissuewhile allowing SD to propagate through surrounding undamaged tissue. Focal lesions were generated using a distal middle cerebral artery occlusion in mice, and clusters of SD were generated at 20 min intervals with remote microinjection of potassium chloride. SDs invading peri-infarct regions had significantly different consequences, depending on the distance from the infarct core. Proximal to the lesion, Ca2+ transients were extended, as compared with responses in better-perfused tissue more remote from the lesion. Extracellular potential shifts were also longer and hyperemia responses were reduced in proximal regions following SDs. Consistent with in vitro studies, ketamine, at concentrations that did not abolish the propagation of SD, reduced the accumulation of intracellular Ca2+ in proximal regions following an SD wave. These findings suggest that deleterious consequences of SD can be targeted in vivo, without requiring outright block of SD initiation and propagation.

Keywords: NMDA receptor; calcium; excitotoxicity; spreading depression; stroke.


Conflict of interest statement

Conflicts of interest: None

=> if ‘none’, insert “The authors have no conflict of interest to declare.”

=> else insert info unless it is already included

Figures

Figure 1.
Figure 1.. Regional heterogeneity of cerebral perfusion responses to SD.
A. Experimental timeline and design for study. Before dMCAo or sham surgeries, burr holes were prepared for electrophysiology and SD inductions (arrowheads; ~20 min. between each SD). Imaging (LSCI and GCaMP5G fluorescence) and local field potential (LFP) recording sessions began shortly after distal middle cerebral artery occlusion (dMCAo) or sham surgeries and continued throughout the experiment (solid and dotted lines). Filled symbols on timeline indicate the time points of animal exclusions during LSCI (blue, n = 4 mice) and GCaMP5G (green, n = 6 mice) experiments. Text box on right shows mouse numbers that were included for each data set shown in Figures. +Poor imaging quality (n = 2 mice) prevented accurate analysis GCaMP5G imaging during all three SDs and were thus excluded from Ca2+ (Figure 3C), but not DC shift, data sets (Figure 4B). B. Diagram showing regions of interest (ROIs) used for LSCI (and GCaMP5G, in Fig.3) analysis labeled “remote” and “proximal” with respect to their relative proximity to the dMCA occlusion site (inset image). C. Representative pseudo-colored LSCI maps (images) and group data (normalized to the contralateral hemisphere) show decreased ipsilateral perfusion 50 min. after dMCAo (n = 7 mice shown) compared to sham (n = 7 mice). Ipsilateral perfusion was similar to the contralateral hemisphere and did not differ between the two ROI locations in sham mice (P > 0.9). After dMCAo, perfusion deficits were seen in both ROI locations (vs. sham) and were further augmented in proximal locations (remote vs. proximal in dMCAo). The perfusion deficit seen in one animal from the dMCAo group (filled data point at 0.625, remote) was an outlier and excluded from statistical analysis (see Supplemental Table 1B). D. Traces show representative perfusion responses in remote and proximal ROIs during the first SD (~60 min. post dMCAo) from an individual animal (arrowheads indicate the onset of the SD-induced cerebral blood flow response). Group data from the same animals shown in C quantifies the magnitude of hypoperfusion ((a) in traces) and hyperperfusion ((b) in traces) components during SD. Hypoperfusion was similar across ROIs in sham and dMCAo experiments while hyperperfusion after SD was significantly blunted only in proximal ROIs from dMCAo mice (n = 7 SDs per ROI location from n = 7 mice). See Supplementary Table 1 for all statistics related to Figure 1. * P<0.05, ** P<0.01, ***P<0.001, **** P<0.0001 from Bonferroni’s multiple comparisons test.
Figure 2.
Figure 2.. Prolonged DC shift durations in proximal brain regions after dMCAo.
A. Schematic showing the relationship of LSCI ROIs (black and red circles, analysis in Figure 1) with respect to remote and proximal LFP recording locations and SD induction site. B. Traces show DC potential shifts during repetitive SDs (arrowheads) in remote (black) and proximal (red) recording locations after dMCAo and sham procedures (double lines indicate each SD was separated by 15 - 20 min). C. Data from the same animals shown in Figure 1, demonstrate that DC shift durations were prolonged in proximal locations after dMCAo. In one sham animal, the final SD stimulation took longer than 20 min. and was excluded from analysis. In one animal from the dMCAo group, the DC shift during the 1st SD (proximal) was prolonged (data point at 920s) and DC shifts for subsequent stimulations were not detectable in this same location thus preventing quantification of duration. In this same animal, the 3rd SD in the remote location was also not detected. In a second dMCAo animal with an extended proximal DC shift (data point at 880s), the 3rd SD stimulation also had no detectable DC shift. In total, plot shows n = 20 SDs each in proximal and remote locations from n = 7 sham mice and shows n = 20 SDs (remote) and n = 18 SDs (proximal) from n = 7 dMCAo mice. DC shift duration data followed a lognormal distribution and thus Y = log(Y) was used to transform the data for use in parametric tests. D. DC duration versus the maximum hyperperfusion response (from the same animals in Figure 1D(b)) shows that prolonged DC shifts in proximal locations were also characterized by blunted hyperperfusion during SD. Symbols plotted >500s were outliers also shown in C. *** P < 0.001, **** P<0.0001, n.s. denotes P > 0.05, from Bonferroni’s multiple comparisons test (see Supplementary Table 2).
Figure 3.
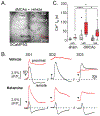
Figure 3.. Ketamine reduces intracellular neuronal Ca2+ load during SD.
A. (Right) average projection of 10 frames taken ~50 minutes after dMCAo in a vehicle-treated GCaMP5G-expressing animal. Image shows the location of recording electrodes, Ca2+ ROIs, and SD initiation site relative to bregma (b) and the dMCA. B. Top: Ca2+ traces during repetitive SDs (arrowheads) in a vehicle-treated dMCAo animal show an example of prolonged elevations (red trace) in neuronal Ca2+ during the first SD and failure of subsequent SDs to propagate in the same location. In this animal, neurons in remote (black trace) brain regions had progressively worse recovery of SD-induced Ca2+ elevations during the SD cluster. SDs in the presence of ketamine showed delayed progression of irrecoverable Ca2+ transients in proximal ROIs with no change in remote locations during repetitive SDs. Fluorescence changes are normalized to levels prior to SD1 (dotted lines). C. Group data showing Ca2+ signal half-life (t50) during repetitive SDs. In this data set, two animals (one each from vehicle- and ketamine- treated dMCAo groups), were excluded due to poor imaging quality which prevented accurate Ca2+ analysis. In one animal from the dMCAo + vehicle group, Ca2+ increases remained elevated from the 2nd SD preventing quantification of the 3rd SD (proximal location). 1 SD (filled symbol, remote location) was an outlier. Plot shows n=17,14 SDs from remote and proximal ROIs, respectively for the dMCAo + vehicle group (n = 6 mice). In one animal from the dMCAo + ketamine group (n = 6 mice), the 3rd SD stimulation did not induce Ca2+ changes in the proximal ROI. Figure shows data from n = 18,17 SDs from remote and proximal ROIs, respectively. In one animal from the sham group, imaging artifacts emerged after the 1st SD stimulation that prevented the measurement of subsequent SDs (both ROIs). Data shows n = 7 SDs in remote and proximal locations from n = 3 mice. *P <0.05, **** P < 0.0001. See Supplementary table for full statistical reports.
Figure 4.
Figure 4.. Ketamine can decrease the duration of depolarization during SD.
A. DC shift traces during repetitive SDs in a ketamine-treated animal shows that ketamine can reduce the duration of SD in proximal recording locations after dMCAo. B. Group DC shift durations from the same animals shown in Figure 4 are shorter in ketamine-treated animals after dMCAo. Sham: n = 9 SDs (proximal and remote) from n = 3 animals, dMCAo + vehicle: n = 15 SDs (remote) and n = 15 SDs (proximal) from n = 5 animals, dMCAo + ketamine: n = 21, 20 SDs (remote and proximal, respectively) from n = 7 animals. Exclusions: one animal from the dMCAo + vehicle group had a spontaneous SD, and the DC potential did not recover to >80% of baseline prior to subsequent evoked SD stimulations (both recording locations, data not shown); from the dMCAo + ketamine group the DC potential during one SD did not recover to >80% prior to the next SD stimulation (data not shown). Group comparisons were conducted on transformed DC shift data (as in Figure 2), see Supplementary Table 4 for full statistical reports. C. DC shift duration versus Ca2+ half-life during SD demonstrates that slower recovery of Ca2+ is related to the duration of depolarization within the same animal. Note the different x and y-axis scales between graphs: the dotted box in dMCAo ketamine (middle) shows the relationship to sham animals (left) while the two dotted boxes in the dMCAo + vehicle group show both sham and ketamine-treated dMCAo scales. Data is from the same animals in B that had both calcium and DC shift data. *P<0.05, ***P<0.001.

Similar articles

Cited by

References

    1. Abou-Chebl A, Lin R, Hussain MS, Jovin TG, Levy EI, Liebeskind DS, Yoo AJ, Hsu DP, Rymer MM, Tayal AH, Zaidat OO, Natarajan SK, Nogueira RG, Nanda A, Tian M, Hao Q, Kalia JS, Nguyen TN, Chen M and Gupta R (2010). “Conscious sedation versus general anesthesia during endovascular therapy for acute anterior circulation stroke: preliminary results from a retrospective, multicenter study.” Stroke 41(6): 1175–1179. - PubMed
    1. Aiba I, Carlson AP, Sheline CT and Shuttleworth CW (2012). “Synaptic release and extracellular actions of Zn2+ limit propagation of spreading depression and related events in vitro and in vivo.” Journal of neurophysiology 107(3): 1032–1041. - PMC - PubMed
    1. Aiba I and Shuttleworth CW (2012). “Sustained NMDA receptor activation by spreading depolarizations can initiate excitotoxic injury in metabolically compromised neurons.” The Journal of physiology 590(Pt 22): 5877–5893. - PMC - PubMed
    1. Ayata C and Lauritzen M (2015). “Spreading Depression, Spreading Depolarizations, and the Cerebral Vasculature.” Physiological reviews 95(3): 953–993. - PMC - PubMed
    1. Busch E, Gyngell ML, Eis M, Hoehn-Berlage M and Hossmann KA (1996). “Potassium-induced cortical spreading depressions during focal cerebral ischemia in rats: contribution to lesion growth assessed by diffusion-weighted NMR and biochemical imaging.” J Cereb Blood Flow Metab 16(6): 1090–1099. - PubMed

Publication types

MeSH terms

LinkOut - more resources